Mortality, Length of Stay, and Inpatient Charges for Heart Failure Patients at Public versus Private Hospitals in South Korea
Sun Jung Kim,
1Eun-Cheol Park,
2,3Tae Hyun Kim,
2,4Ji Won Yoo,
5,6and Sang Gyu Lee
2,41Department of Health Administration, Namseoul University, Cheonan, Korea;
2Institute of Health Services Research, Yonsei University College of Medicine, Seoul, Korea;
3Department of Preventive Medicine, Yonsei University College of Medicine, Seoul, Korea;
4Department of Hospital Management, Graduate School of Public Health, Yonsei University, Seoul, Korea;
5Department of Medicine, University of Wisconsin School of Medicine and Public Health, Milwaukee, WI, USA;
6Center for Senior Health and Longevity, Aurora Health Care, Milwaukee, WI, USA.
Received: June 24, 2014 Revised: August 4, 2014 Accepted: August 11, 2014
Corresponding author: Dr. Sang Gyu Lee, Department of Hospital Management, Graduate School of Public Health, Yonsei University,
50-1 Yonsei-ro, Seodaemun-gu, Seoul 120-752, Korea.
Tel: 82-2-2228-1524, Fax: 82-2-392-7734 E-mail: [email protected]
∙ The authors have no financial conflicts of interest.
© Copyright:
Yonsei University College of Medicine 2015 This is an Open Access article distributed under the terms of the Creative Commons Attribution Non- Commercial License (http://creativecommons.org/
licenses/by-nc/3.0) which permits unrestricted non- commercial use, distribution, and reproduction in any medium, provided the original work is properly cited.
Purpose: This study compared in-hospital mortality within 30 days of admission, lengths of stay, and inpatient charges among patients with heart failure admitted to public and private hospitals in South Korea. Materials and Methods: We obtained health insurance claims data for all heart failure inpatients nationwide between No- vember 1, 2011 and May 31, 2012. These data were then matched with hospital-level data, and multi-level regression models were examined. A total of 8406 patients from 253 hospitals, including 31 public hospitals, were analyzed. Results: The in-hospital mortality rate within 30 days of admission was 0.92% greater and the mean length of stay was 1.94 days longer at public hospitals than at private hospitals (mortality:
5.18% and 4.26%, respectively; LOS: 12.08 and 10.14 days, respectively). The inpa- tient charges were 11.4% lower per case and 24.5% lower per day at public hospitals than at private hospitals. After adjusting for patient- and hospital-level confounders, public hospitals had a 1.62-fold higher in-hospital mortality rate, a 16.5% longer length of stay, and an 11.7% higher inpatient charge per case than private hospitals, although the charges of private hospitals were greater in univariate analysis. Conclu- sion: We recommend that government agencies and policy makers continue to moni- tor quality of care, lengths of stay in the hospital, and expenditures according to type of hospital ownership to improve healthcare outcomes and reduce spending.
Key Words: Public hospitals, mortality, fees and charges, length of stay
INTRODUCTION
Previous studies examining differences between public and private hospitals have produced inconsistent results, and debate regarding the association of hospital ownership with the quality and cost of care has persisted.1-4 Advocates for the pri- vate sector argue that their involvement in healthcare is associated with a higher quality of care5-7 at competitive prices,6 which leads to rapid and innovative re- sponses5 to customer demands.6 Their criticisms of public hospitals underscore the
Since the implementation of NHI, all types of hospitals generally use a fee-for-service (FFS) reimbursement sys- tem.29 Patients have considerable freedom to choose and ac- cess care providers; no restrictions on the use of primary, sec- ondary, and tertiary medical institutions exist; and there are no penalties for repeated care.30,31 In addition to NHI cover- age, private hospitals can provide aggressive, expensive, and the latest non-NHI-covered treatment services, the costs of which are borne by patients; however, public hospitals are re- stricted in their ability to provide non-NHI-covered treatment services. Although NHI guarantees universal access to any hospital, co-payments (‒20% for covered and 100% for non- covered services) are relatively high. Financially vulnerable individuals cannot afford the extra costs, especially for non- NHI-covered services; hence, they tend to rely on public hos- pitals, in which mainly NHI-covered services are provided.
The prosperity of private hospitals over the past few de- cades is the result of increasing demand and limited supply;
however, public hospitals seem to be currently regarded as the last resort for members of the low-income population, primarily because of their financial constraints. Although private hospitals have been coping well with the dynamic healthcare market situation in Korea, public hospitals may have fallen behind private ones due to a lack of state-of-the- art medical equipment, direct control by municipal and pro- vincial governments over all hospital operations, use of ad- ditional procedures or new treatments that are not covered by NHI, bureaucratization, politicization, lack of skilled physicians and other health professionals due to lower sala- ries, and lack of incentives for improved performance be- cause hospital workers are regarded as government workers and are protected by strong labor unions.
Despite the importance of understanding the differences between public and private hospitals in terms of in-hospital mortality rates, lengths of stay (LOSs), and inpatient charg- es, a limited number of studies have examined these issues in South Korea.32 In this context, this study was designed to compare in-hospital mortality rates, LOSs, and inpatient charges to inpatients suffering from heart failure at public and private hospitals in South Korea.
MATERIALS AND METHODS
Study population
We extracted nationwide data from the Korean NHI claims database for all inpatients with the diagnosis of heart failure latter’s presumed inefficiency, which they attribute to bureau-
cratization; politicization; lack of incentives for workers,8 be- cause of strong unions that may increase the cost of firing staff, leading to a less efficient labor force; and delays in fi- nancial decision making.9 Although empirical studies have produced mixed results regarding public hospitals, several European studies have indicated that either public hospitals are more efficient10,11 than private hospitals or that no signifi- cant differences exist between the two types of institutions.12
In addition to concerns about the efficiency of public hos- pitals, questions about their quality of care have also been raised. Patient populations in public hospitals differ from those in other facilities, and these patient characteristics may influence outcomes.13 Additionally, one study found that the adjusted mortality rates were significantly higher in public hospitals than in private hospitals,14 suggesting a low- er level of quality of care in the former. In contrast, some have argued that tax exemptions for15 and lower administra- tive costs of16 public hospitals may allow them to offer low- cost services. They maintain that a culture of quality assur- ance and patient safety is more achievable at public hospitals than at private institutions because profit is not the primary goal.2,17 However, studies of the quality, cost, efficiency, and performance of healthcare providers according to own- ership type have relied primarily on data from the United States18-21 and countries in Europe.22-24
Following the Korean Civil War (1950‒1953), the Korean government devoted considerable resources to rebuilding district public hospitals in order to provide necessary health- care services to citizens. These municipal and provincial public hospitals played important roles in support of the na- tion’s healthcare system, and the capacity of these institu- tions reached 4830 beds by 1979.25 Increasing healthcare de- mands due to remarkable post-war economic growth, higher per capita income, increased recognition of the importance of good health, a new age distribution, and, most important- ly, the introduction of the National Health Insurance (NHI) system in 1977 and its extension to the entire country in 1989 promoted the growth of private hospitals.26 Indeed, the number of private hospitals increased from 234 in 1980 to 2548 in 2011.27 Although the number of public hospitals has remained almost unchanged (there are currently 39 public hospitals), the private sector has quickly responded to and filled the gap between growing demand and limited sup- ply.28 Since the growth of the private sector has been sponta- neous, it has not been necessary for the government to de- vote resources to the development of healthcare systems.
only mid-sized general hospitals in the dataset, because the majority of public hospitals fell within this category (34 of 39 public hospitals). Public hospitals that did not have full data on hospital characteristics were excluded (n=3).
Of the 274 mid-sized general hospitals included in the database, only those that admitted more than one inpatient with heart failure were included. A total of 8406 inpatients were hospitalized in Korea for heart failure during the study period, and a total of 253 hospitals, including 31 public hospitals, were included in our analysis.
Statistical analysis
Continuous variables were analyzed in terms of means and standard deviations, and categorical variables were ana- lyzed in terms of frequencies and percentages. Univariate analyses of in-hospital mortality rates, LOSs, and inpatient charges were performed to determine the unadjusted effects of hospital characteristics on these measures. Analysis of variance and chi-square tests were performed to identify group differences (Table 1 and 2).
As the unit of analysis was each patient’s hospitalization, this study utilized multi-level generalized estimating equa- tion regression (GEE) models to avoid the potential prob- lems created by the nesting of patient observations within hospital-level data and the overestimation of significance.
The GEE regression models were used to investigate the performance and characteristics of public hospitals, includ- ing in-hospital mortality rates, LOSs, and inpatient charges, after adjusting for patient- and hospital-level confounders (Table 3). Since the distributions of dependent variables (LOSs and inpatient charges, all continuous variables) were skewed, we utilized log transformations. Additionally, we employed the GEE of binary outcome variables for in-hos- pital mortality rates within 30 days of admission. SAS 9.2 (SAS Institute, Cary, NC, USA) was used for all calcula- tions and analyses.
RESULTS
The sample, which consisted of 8406 patients, included more females, patients with higher CCL scores (CCL=2 and 3), and patients older than 65 years. A total of 7422 (88.3%) patients were admitted to private hospitals, and these patients had more comorbid conditions (CCL=2 and 3, 73.9%) than those admitted to public hospitals (CCL=2 and 3, 60.0%). Approximately 50.8% of patients were ad- who were admitted to mid-size general hospitals between
November 1, 2011 and May 31, 2012. Patients with heart failure were identified by International Classification of Dis- eases-10 codes of I110 (hypertensive heart disease with con- gestive heart failure), I130 (hypertensive heart and renal dis- ease with congestive heart failure), I132 (hypertensive heart and renal disease with both congestive heart failure and renal failure), I5000‒5002 (congestive heart failure), I501 (left ventricular failure), and I509 (unspecified heart failure).
This dataset contains details on inpatient claims, including patient identification, admission and discharge dates, sex, age, inpatient charges, complexity of illness, death within 30 days of admission, and identity of the hospital. Inpatient charges were the sums of the FFS claims for each patient’s hospitalization. The average foreign exchange rate in 2012 was 1 USD=1126.88 KRW, and “LOS” refers to the number days per hospitalization. For patients who died within 30 days of admission, the in-hospital mortality rate was calcu- lated as a binary variable. Complexity of illness was as- sessed by the provider and reported as claims data in terms of complication or comorbidity level (CCL) [CCL 0=pa- tient does not have a complication or comorbidity (CC), CCL 1=patient has a minor CC, CCL 2=patient has a mod- erate CC, CCL 3=patient has a complex CC] at the time of admission of each patient. CCL was calculated via arithme- tic operations performed during the grouping process and represents the cumulative effect of a patient’s complications and comorbidities.33 Two studies conducted in South Korea have used CCL as a proxy of the severity of disease.34,35
Our hospital-level data included the characteristics of the hospital, such as hospital type (public or private), number of beds, specialists, nurses per bed, hospital location (“met- ropolitan” if located in cities with a population of more than 1 million), teaching status (i.e., resident training hospitals), and bed occupancy rate. Hospital-level statistics were based on the first quarter of 2012, which was the only dataset available at the time of the study.
Korean hospitals are categorized as university research hospitals, mid-sized general hospitals, or small-sized gener- al hospitals based on the number of beds and medical de- partments. University research hospitals contain more than 1000 beds and almost all possible medical departments, and mid-sized general hospitals typically contain more than 300 beds and nine major medical departments or more than 100 beds and seven major medical departments. Hospitals with fewer than 100 beds or a shortage of medical depart- ments are classified as small general hospitals. We included
terms of number of beds, number of specialists, number of nurses per bed, and bed occupancy rates (Table 2).
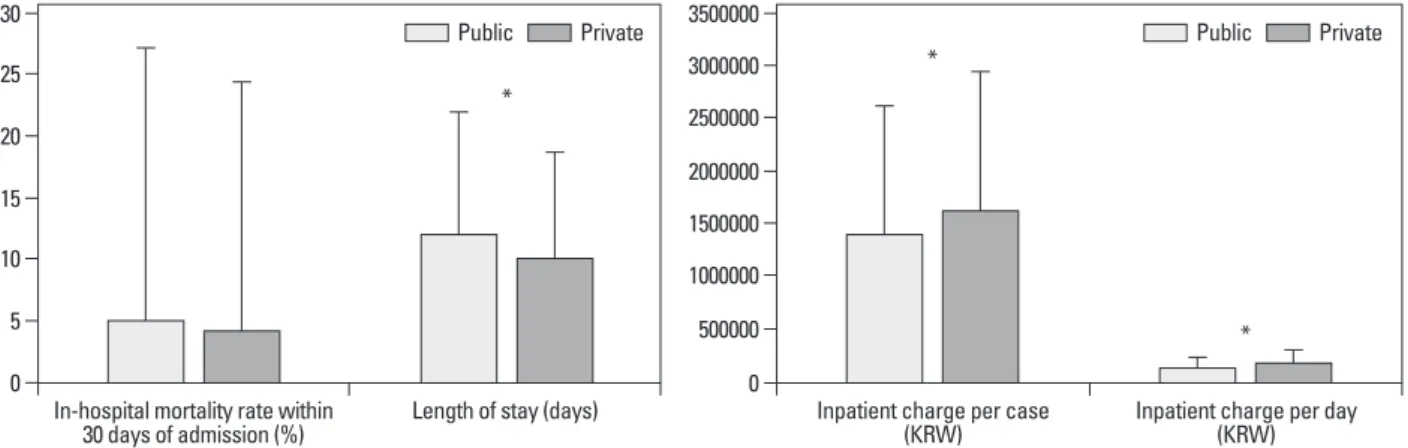
Fig. 1 presents the results of the univariate analyses. Both the in-hospital mortality rates within 30 days of admission and the LOSs were higher in public than in private hospitals (mortality rate: 5.18% and 4.26%, respectively; LOS: 12.08 and 10.14 days, respectively). The inpatient charge per case was 13% higher and the inpatient charge per day was 32.5%
higher in private hospitals than in public hospitals (per case:
KRW 1598129 and KRW 1415575, respectively; per day:
KRW 182554 and KRW 137787, respectively).
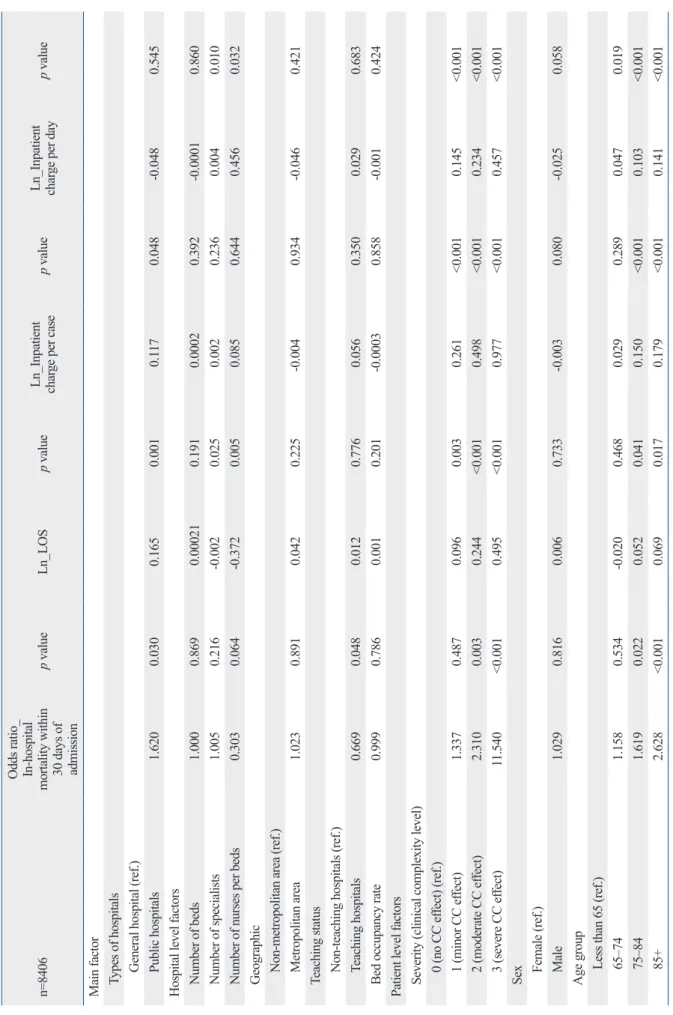
The results of our multi-level analysis are presented in Ta- ble 3. After adjusting for patient- and hospital-level con- founders, public hospitals had a 1.62-fold higher in-hospital mortality rate within 30 days of admission than private hos- mitted to private hospitals located in metropolitan areas,
and 63.5% of patients were admitted to private teaching hospitals. Additionally, 984 (11.7%) patients were admitted to public hospitals, while only 22.8% of patients were ad- mitted to public hospitals located in metropolitan areas. A total of 20.0% of patients were admitted to public teaching hospitals (Table 1).
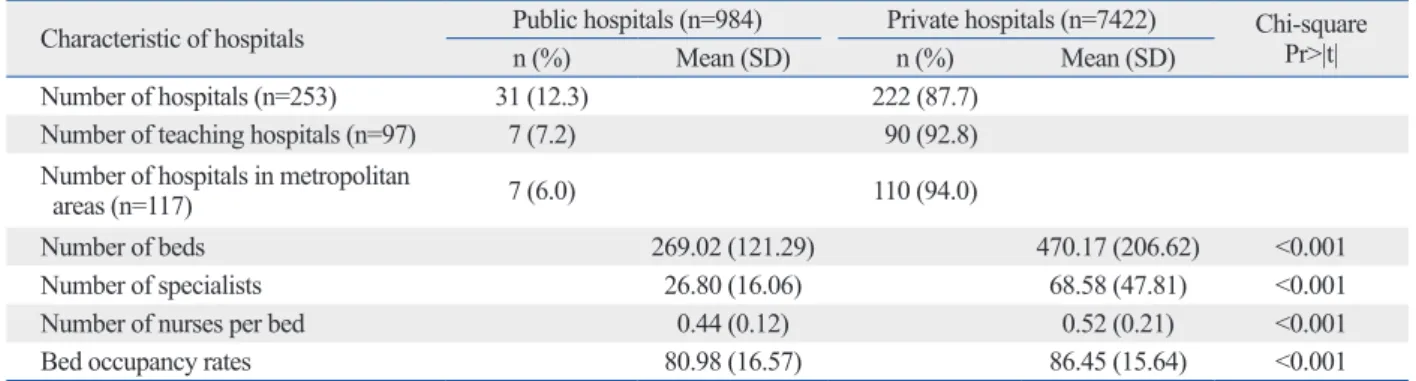
Table 2 presents the characteristics of the hospitals to which the patients included in this study were admitted. Of the 253 hospitals in our study, 31 (12.3%) were public hos- pitals. Of these public hospitals, seven were teaching hospi- tals and seven were located in metropolitan areas (22.5%).
Half of the private hospitals were located in metropolitan areas, and two-fifths had teaching status. In general, private hospitals were somewhat larger than public hospitals in Table 1. Characteristics of Heart-Failure Inpatients
Characteristics of inpatients Public hospitals (n=984) Private hospitals (n=7422) Chi-square Pr>|t|
n % n %
Sex 0.087
Male 339 34.50 2765 37.30
Female 645 65.50 4657 62.70
Age group <0.001
Less than 65 123 12.50 1181 15.90
65‒74 172 17.50 1663 22.40
75‒84 421 42.80 3110 41.90
85+ 268 27.20 1468 19.80
Severity (clinical complexity level) <0.001
0 (no CC effect) 189 19.20 726 9.80
1 (minor CC effect) 204 20.70 1213 16.30
2 (moderate CC effect) 337 34.20 2531 34.10
3 (severe CC effect) 254 25.80 2952 39.80
Number of patients by geographic area <0.001
Metropolitan area 224 22.80 3774 50.80
Non-metropolitan area 760 77.20 3648 49.20
Number of patients by teaching status <0.001
Teaching hospital 197 20.00 4710 63.50
Non-teaching hospital 787 80.00 2712 36.50
CC, complication and comorbidity.
Table 2. Characteristics of Hospitals Admitting Heart Failure Inpatients
Characteristic of hospitals Public hospitals (n=984) Private hospitals (n=7422) Chi-square Pr>|t|
n (%) Mean (SD) n (%) Mean (SD)
Number of hospitals (n=253) 31 (12.3) 222 (87.7)
Number of teaching hospitals (n=97) 7 (7.2) 90 (92.8)
Number of hospitals in metropolitan
areas (n=117) 7 (6.0) 110 (94.0)
Number of beds 269.02 (121.29) 470.17 (206.62) <0.001
Number of specialists 26.80 (16.06) 68.58 (47.81) <0.001
Number of nurses per bed 0.44 (0.12) 0.52 (0.21) <0.001
Bed occupancy rates 80.98 (16.57) 86.45 (15.64) <0.001
vate hospitals. After adjusting for patient- and hospital-level confounders, we found that the in-hospital mortality rates within 30 days after admission were 1.62-fold higher, along with a 16.5% longer LOS, at public hospitals than at private hospitals.
The results of this study provide empirical evidence in sup- port of the argument that public hospitals may have higher in-hospital mortality rates due to their organizational struc- ture. As noted, public hospitals in South Korea are totally controlled by district governments, and this may contribute to difficulties recruiting well-trained physicians, acquiring medical equipment, and the higher in-hospital mortality rates. Additionally, the relatively lower salaries for physi- cians and other healthcare professionals, the lack of incen- tives for improved performance due to employees’ status as government workers, and restrictions on the use of aggres- sive treatments that are not covered by NHI may lead to higher in-hospital mortality rates within the first 30 days af- ter admission to public hospitals.
The agency for Health Insurance Review and Assessment services is responsible for the overall quality assessment of South Korean hospitals. This agency’s goal should involve not only identifying and punishing those responsible for substandard care; it should also promote the enhancement of the quality of the healthcare services available in this coun- try, including those offered by public hospitals, using a sys- tematic approach that is able to detect quality-related prob- lems by monitoring reimbursement policies or delivery systems, as well as by conducting retrospective quality as- sessments.36 Additionally, public hospitals should implement their own strategic initiatives to improve quality of care.
The relationship between continuous quality improvement (CQI) and hospital management strategies has been limited in many hospitals in Korea.37 However, policy incentives that enhance CQI should be instituted within the framework of pitals (p=0.030). In terms of hospital-level factors, teaching
status [odds ratio (OR): 0.669, p=0.048] was associated with lower in-hospital mortality rates. More complex patients had a higher in-hospital mortality rate (CCL=2: OR=2.31 times higher mortality rate, CCL=3: OR=11.54-fold higher mor- tality rate). Being older than 75 years of age was also sig- nificantly associated with in-hospital mortality (age=75‒84:
OR=1.619, age=85+: OR=2.628). Also, LOSs were 16.5%
longer at public hospitals than private hospitals (p=0.001).
Having more specialists and nurses was associated with shorter LOSs; however, LOS was associated with degree of disease complexity, such that patients with more complex cases stayed in the hospital longer (9.6%, 24.4%, and 49.5%
longer for CCL=1, 2, and 3, respectively, than for CCL=0).
Although univariate analyses revealed higher charges among private hospitals, the inpatient charge per case was 11.7% higher in public hospitals (p=0.048) after adjusting for patient- and hospital-level confounders. The inpatient charge per day was somewhat lower in public hospitals (-4.3%), although this difference was not statistically signif- icant (p=0.545). Higher inpatient charges per case and per day were associated with more complex patients and those older than 75 years. Finally, those who were younger and male tended to accrue lower inpatient charges.
DISCUSSION
In this study, we determined in-hospital mortality rates with- in 30 days of admission, LOSs, and fees at both private and public hospitals using a South Korean NHI inpatient claims dataset comprising information about patients who had suf- fered from heart failure. The results of univariate analyses revealed higher in-hospital mortality rates, longer LOSs, and lower inpatient charges for public hospitals than for pri-
Fig. 1. The difference of outcome variables between public vs. private hospitals. Data is shown as mean±SD. *Significant (p<0.001).
Inpatient charge per case
(KRW) Inpatient charge per day (KRW) 500000
0 1000000 1500000 3500000
2500000 2000000 3000000
Public Private
*
In-hospital mortality rate within
30 days of admission (%) Length of stay (days) 5
10 15 30
0 20 25
Public Private
*
*
Table 3. Multi-Level Analysis of Outcome Variables: Mortality Rate, LOS, Inpatient Charges n=8406 Odds ratio_ In-hospital
mortality within 30 days of admission
p valueLn_LOSp value
Ln_Inpatient charp value ge per case
Ln_Inpatient charp value ge per day Main factor Types of hospitals General hospital (ref.) Public hospitals 1.6200.0300.1650.0010.1170.048-0.0480.545 Hospital level factors Number of beds 1.0000.869 0.000210.1910.00020.392 -0.00010.860 Number of specialists 1.0050.216-0.0020.0250.0020.2360.0040.010 Number of nurses per beds 0.3030.064-0.3720.0050.0850.6440.4560.032 Geographic Non-metropolitan area (ref.) Metropolitan area 1.0230.8910.0420.225-0.0040.934-0.0460.421 Teaching status Non-teaching hospitals (ref.) Teaching hospitals 0.6690.0480.0120.7760.0560.3500.0290.683 Bed occupancy rate 0.9990.7860.0010.201-0.00030.858-0.0010.424 Patient level factors Severity (clinical complexity level) 0 (no CC effect) (ref.) 1 (minor CC effect) 1.3370.4870.0960.0030.261<0.0010.145<0.001 2 (moderate CC effect) 2.3100.0030.244<0.0010.498<0.0010.234<0.001 3 (severe CC effect)11.540<0.0010.495<0.0010.977<0.0010.457<0.001 Sex Female (ref.) Male 1.0290.8160.0060.733-0.0030.080-0.0250.058 Age group Less than 65 (ref.) 65‒74 1.1580.534-0.0200.4680.0290.2890.0470.019 75‒84 1.6190.0220.0520.0410.150<0.0010.103<0.001 85+ 2.628<0.0010.0690.0170.179<0.0010.141<0.001 LOS, length of stay.
sum of the FFS claims from each patient’s hospitalization, but we were unable to identify components of these FFS claims. Inpatient claims are not the same as costs; however, claims represent costs from the perspective of the purchaser, which is the National Health Insurance Service of Korea.42 The unique organizational structure of public hospitals in Korea may also reduce the generalizability and weaken the arguments advanced in this study.
Second, this study investigated only 31 of 39 public hos- pitals and focused exclusively on patients with heart failure.
Furthermore, teaching hospitals were also unevenly distrib- uted between private and public institutions; therefore, the results of this study may generally over- or underestimate the true performance of public hospitals, which could com- promise the reliability of our findings. Another potential limitation of our study involves our study period, as the in- terval for which data were available was not sufficient for rigorous investigation of the effects of hospital type. Fur- ther research using ample datasets should be conducted to elucidate the long-term performance of public hospitals.
Third, this study was able to access the in-hospital mor- tality rates for only the first 30 days after admission due to the format of the claims data, which may have led to an un- derestimation of the true mortality rates at both public and private hospitals. Our study also lacked data regarding pa- tient socio-economic status (SES). Due to their financial constraints, economically vulnerable populations are more likely to be admitted to public hospitals; however, due to the limitations of our dataset, we were not able to examine the patients’ SES.
The final limitation of the study was its failure to include several important variables. As our dataset did not contain information about patients’ route of admission, we were un- able to determine whether patients with heart failure were admitted through emergency departments, transfers from other facilities, or the regular admission process. We as- sumed that the majority of patients were acute, as our claims data were related to inpatient admissions, but we were un- able to determine how the patients included in our sample were admitted. Furthermore, echocardiogram data, informa- tion about the reason for hospitalization, and the results of other laboratory measures related to the severity of heart failure (e.g., brain natriuretic peptides, kidney function, etc.) were not available, which also limits our ability to draw def- inite conclusions. We were also unable to assess other indi- cators of the quality of hospitals, which may have limited our ability to assess their overall quality of care.
the strategic management requirements.
Public hospitals had longer LOSs than private hospitals. In our study, the mean LOS in the former was roughly 16.5%
longer than that in the latter after adjusting for patient- and hospital-level confounders. One plausible explanation for this phenomenon may relate to the “No Financial Pressure”
environment, which provides no incentives for public hos- pitals that emphasize efficiency. Although many public hos- pitals have a negative net income according to their finan- cial statements, district governments have been responsible for these losses, as these institutions must continue provid- ing medical services to indigent patients in their area. Thus, public hospitals do not experience pressure related to finan- cial viability. The characteristics of the patients at public hospitals may also contribute to the longer LOSs.38,39 It is also possible that the relative efficiency of private and public institutions may be driven by different motives, given that private providers have a strong incentive to minimize costs and practice more efficiently.40 Additionally, it is possible that the profit motive encourages private hospitals to dis- charge patients early, leading to subsequent re-admission.
According to our multivariate analysis, including LOS, inpatient charges per case were 11.7% higher in public hos- pitals, while the results of univariate analyses showed the charges per case were higher in private hospitals (the inpa- tient charges per day did not differ significantly). Signifi- cant attention to LOSs and inpatient charge is required, as they are closely related to overall healthcare spending at the national level. Among Organization for Economic Co-oper- ation and Development (OECD) countries, the average in- patient LOS for all causes was highest in Japan, followed by Korea. The abundant supply of beds and the structure of hospital payments in Japan and Korea may provide hospi- tals in these countries with incentives to prolong hospital- ization durations.41
This study has several limitations that should be noted, and caution should be used in interpreting and generalizing our findings. First, although we analyzed nationwide health insurance inpatient claims data for the study period, which strengthens the generalizability of our results, South Ko- rea’s unique healthcare delivery and insurance system may mitigate against generalizing our findings to other countries.
Inpatient charges, in particular, are likely to depend on the type of health insurance system and the ability of healthcare providers to negotiate the fees for medical services. The hospital reimbursement system in South Korea is predomi- nantly FFS-based; inpatient charges were measured as a
2. Hirth RA. Consumer information and competition between non- profit and for-profit nursing homes. J Health Econ 1999;18:219-40.
3. Tiemann O, Schreyögg J, Busse R. Hospital ownership and effi- ciency: a review of studies with particular focus on Germany.
Health Policy 2012;104:163-71.
4. Eggleston K, Shen YC, Lau J, Schmid CH, Chan J. Hospital own- ership and quality of care: what explains the different results in the literature? Health Econ 2008;17:1345-62.
5. Fidler AH. The role of the private sector in health financing and service delivery. Eur J Public Health 2009;19:450-1.
6. Hasan MM. Let’s end the nonprofit charade. N Engl J Med 1996;
334:1055-7.
7. Travis P, Cassels A. Safe in their hands? Engaging private provid- ers in the quest for public health goals. Bull World Health Organ 2006;84:427.
8. Hanson K, Gilson L, Goodman C, Mills A, Smith R, Feachem R, et al. Is private health care the answer to the health problems of the world’s poor? PLoS Med 2008;5:e233.
9. Preker AS, Harding A, Travis P. “Make or buy” decisions in the production of health care goods and services: new insights from institutional economics and organizational theory. Bull World Health Organ 2000;78:779-90.
10. Herr A. Cost and technical efficiency of German hospitals: does ownership matter? Health Econ 2008;17:1057-71.
11. Hollingsworth B. The measurement of efficiency and productivity of health care delivery. Health Econ 2008;17:1107-28.
12. Farsi M, Filippini M. Effects of ownership, subsidization and teaching activities on hospital costs in Switzerland. Health Econ 2008;17:335-50.
13. Dubois RW, Rogers WH, Moxley JH 3rd, Draper D, Brook RH.
Hospital inpatient mortality. Is it a predictor of quality? N Engl J Med 1987;317:1674-80.
14. Hartz AJ, Krakauer H, Kuhn EM, Young M, Jacobsen SJ, Gay G, et al. Hospital characteristics and mortality rates. N Engl J Med 1989;321:1720-5.
15. Reinhardt UE. The economics of for-profit and not-for-profit hos- pitals. Health Aff (Millwood) 2000;19:178-86.
16. Woolhandler S, Himmelstein DU. Costs of care and administra- tion at for-profit and other hospitals in the United States. N Engl J Med 1997;336:769-74.
17. Arrow KJ. Uncertainty and the welfare economics of medical care. The Am Econ Rev 1963;53:941-73.
18. Rosenau PV, Linder SH. Two decades of research comparing for- profit and nonprofit health provider performance in the United States. Soc Sci Q 2003;84:219-41.
19. Devereaux PJ, Schünemann HJ, Ravindran N, Bhandari M, Garg AX, Choi PT, et al. Comparison of mortality between private for- profit and private not-for-profit hemodialysis centers: a systematic review and meta-analysis. JAMA 2002;288:2449-57.
20. Rosenau PV, Linder SH. A comparison of the performance of for- profit and nonprofit U.S. psychiatric inpatient care providers since 1980. Psychiatr Serv 2003;54:183-7.
21. Nawal Lutfiyya M, Bhat DK, Gandhi SR, Nguyen C, Weiden- bacher-Hoper VL, Lipsky MS. A comparison of quality of care in- dicators in urban acute care hospitals and rural critical access hos- pitals in the United States. Int J Qual Health Care 2007;19:141-9.
22. Browne J, Jamieson L, Lewsey J, van der Meulen J, Copley L, Black N. Case-mix & patients’ reports of outcome in Independent Sector Treatment Centres: comparison with NHS providers. BMC Health Serv Res 2008;8:78.
Although our study was based solely on patients with heart failure and an administrative health insurance inpa- tient claims dataset, to our knowledge, it represents the first attempt to evaluate in-hospital mortality rates, LOSs, and fees of public hospitals in South Korea. We believe that our findings will be useful to healthcare policy makers, particu- larly those in countries with national health insurance pro- grams based on FFS payments and a mixed public/private hospital system. Our findings contribute to the increasing evidence about the quality, efficiency, and characteristics of public hospitals, and may enhance the evidentiary basis for the design and implementation of public hospital systems.
Additional research covering a longer time frame and a wider variety of diseases is needed to increase the reliability and generalizability of our findings.
In conclusion, the results of our multi-level regression analysis showed that patients with heart failure admitted to public hospitals may have higher in-hospital mortality rates and longer LOSs and accrue higher inpatient charges, com- pared with those admitted to private hospitals. However, it should be remembered that public hospitals play a signifi- cant role in Korean healthcare systems by providing health- care services to indigent, financially vulnerable populations in South Korea. To improve healthcare outcomes and reduce spending, we recommend that the government and policy makers continue to monitor overall quality indicators, LOSs, and spending according to type of hospital ownership. Hos- pital managers and clinicians, especially those in public hos- pitals, are also required to improve their performance and quality through managerial efforts and CQI actions.
ACKNOWLEDGEMENTS
S.J.K. designed the study, collected data, performed statisti- cal analyses, and wrote the manuscript. E.C.P., T.H.K., J.W.Y., and S.G.L. contributed to the discussion and re- viewed and edited the manuscript. S.G.L. is the guarantor of this work, and, as such, had full access to all data in the study and accepts responsibility for the integrity of the data and the accuracy of the data analysis.
REFERENCES
1. Thomas EJ, Orav EJ, Brennan TA. Hospital ownership and pre- ventable adverse events. J Gen Intern Med 2000;15:211-9.
patient charge and length of stay for patients with joint diseases in Korea: specialty versus small general hospitals. Health Policy 2013;113:93-9.
35. Kim SJ, Park EC, Yoo KB, Kwon JA, Kim TH. The Association of Market Competition With Hospital Charges, Length of Stay, and Quality Outcomes for Patients With Joint Diseases: A Longi- tudinal Study in Korea. Asia Pac J Public Health 2014 Apr 14 [Epub]. http://dx.doi.org/10.1177/1010539514529812.
36. Cho W, Lee S, Kang HY, Kang M. Setting national priorities for quality assessment of health care services in Korea. Int J Qual Health Care 2005;17:157-65.
37. Lee S, Choi KS, Kang HY, Cho W, Chae YM. Assessing the fac- tors influencing continuous quality improvement implementation:
experience in Korean hospitals. Int J Qual Health Care 2002;14:
383-91.
38. Perelman J, Closon MC. Impact of socioeconomic factors on in- patient length of stay and their consequences in per case hospital payment systems. J Health Serv Res Policy 2011;16:197-202.
39. Epstein AM, Stern RS, Weissman JS. Do the poor cost more? A multihospital study of patients’ socioeconomic status and use of hospital resources. N Engl J Med 1990;322:1122-8.
40. Siciliani L, Sivey P, Street A. Differences in length of stay for hip replacement between public hospitals, specialised treatment cen- tres and private providers: selection or efficiency? Health Econ 2013;22:234-42.
41. OECD. OECD Health Data 2012 [accessed on 2015 March 6].
Available at: http://www.oecd.org/health/healthdata.
42. Song YJ. The South Korean Health Care System. JMAJ 2009;52:
206-9.
23. Street A, Sivey P, Mason A, Miraldo M, Siciliani L. Are English treatment centres treating less complex patients? Health Policy 2010;94:150-7.
24. Helmig B, Lapsley I. On the efficiency of public, welfare and pri- vate hospitals in Germany over time: a sectoral data envelopment analysis study. Health Serv Manage Res 2001;14:263-74.
25. Oh JH. Modernization of public district general hospitals. Seoul:
KDI School of Public Policy and Management; 2012.
26. Lee JC. Health Care Reform in South Korea: Success or Failure?
Am J Public Health 2003;93:48-51.
27. Korean Hospital Association. Hospital Management Statistics.
2012.
28. Yang BM. The role of health insurance in the growth of the pri- vate health sector in Korea. Int J Health Plann Manage 1996;11:
231-52.
29. Kwon S. Thirty years of national health insurance in South Korea:
lessons for achieving universal health care coverage. Health Poli- cy Plan 2009;24:63-71.
30. Jeong HS. Korea’s National Health Insurance--lessons from the past three decades. Health Aff (Millwood) 2011;30:136-44.
31. Park EC, Jang SI. The diagnosis of healthcare policy problems in Korea. J Korean Med Assoc 2012;55:932-9.
32. Cho WH, Chung KH, Kang IO. A study on the trend in the length of hospital stay in Korea. Korean J Prev Med 1996;29:51-66.
33. Hensen P, Beissert S, Bruckner-Tuderman L, Luger TA, Roeder N, Müller ML. Introduction of diagnosis-related groups in Germany:
evaluation of impact on in-patient care in a dermatological setting.
Eur J Public Health 2008;18:85-91.
34. Kim SJ, Park EC, Jang SI, Lee M, Kim TH. An analysis of the in-