Relative validities of 3-day food records and the food frequency questionnaire
Yoon Jung Yang
1, Mi Kyung Kim
1§, Se Hee Hwang
1, Younjhin Ahn
2, Jae Eun Shim
3and Dong Hyun Kim
41
Department of Preventive Medicine, College of Medicine, Hanyang University, 17 Haengdang-dong, Sungdong-gu, Seoul 133-791, Korea
2
Center for Genomic Science, National Institute of Health, Center for Disease Control and Prevention, Seoul 122-701 Korea
3
Department of Kinesiology and Community Health, University of Illinois, Urbana-Champaign, Urbana, IL 61801, USA
4
Department of Social and Preventive Medicine, Hallym University College of Medicine, Chuncheon 200-702, Korea
Abstract
The food frequency questionnaire (FFQ) has been used as an important dietary assessment tool in epidemiologic studies, but the usefulness of the FFQ has been debated in recent years. This study was performed to evaluate the relative validities of 3-day food records and the semi-quantitative FFQ. A total of 124 subjects finished 3-day food records (FRs) during each of the four seasons, as well as the FFQ from December 2002 to May 2004. The FFQ was a food based semi-quantitative FFQ including 103 items. Three-day FRs from each season and a randomly selected season were compared with the remaining 9-day FRs. The remaining 9-day FRs, as a reference measurement, were also compared with the FFQ. Pearson’s correlation coefficients between the 3-day FRs and the 9-day FRs were between 0.14 and 0.56. Pearson’s correlation coefficients between the FFQ and the 9-day FRs ranged between 0.07 and 0.41. Average proportions of classification into the same quartiles, adjacent quartiles, and distant quartiles between the 3-day FRs and the 9-day FRs were 35.8%, 40.5%, and 5.2%, respectively. On average, the proportions of classification into the same quartiles, adjacent quartiles, and distant quartiles between the FFQ and the 9-day FRs were 31.1%, 39.4%, and 6.9%, respectively. Three-day FRs showed higher correlations and higher agreement proportions of quartile classification with the 9-day FRs than did the FFQ, but both relative validities of 3-day FRs and the FFQ appear to be acceptable as dietary assessment tools. Further studies for validating food intake by reliable biomarkers are necessary.
Key Words: Relative validity, food records, food frequency questionnaire
Introduction
8)To investigate the relation between diet and chronic disease, several dietary assessment methods have been developed and evaluated. The food frequency questionnaire (FFQ) has been used most frequently in large-scale epidemiologic studies, because FFQ is less expensive to administer than are other dietary assessment methods, and the FFQ evaluates long-term diet rather than 24-h dietary recall or food records. In addition, dietary intakes estimated by FFQs have shown clear associations with coronary heart disease, type 2 diabetes, and blood lipids [1-3].
However, several studies [4-7] suggested that other types of dietary assessment need to be used in epidemiologic studies of diet and diseases to overcome the limitations of FFQs. These limitations include weak associations with dietary biomarkers and a lack of consistency across studies examining diet and cancer risk. The usefulness of FFQs in epidemiologic studies is inconclusive.
Food records ask participants to record all foods and beverages consumed over a specific period of time, usually 3 to 7 days
or during multiple periods within a year. Because food records do not rely on memory, food records have been used as a reference method to validate other dietary assessment methods.
However, due to day-to-day variations and seasonal variations in food records, multiple-day food records over four seasons have been used as a reference standard to evaluate other dietary assessment methods. Food records have revealed relationships not observed in the FFQ [8-9]. A significant relationship between dietary fat and the risk of breast cancer was found based on multiple-day food records, but was not seen in the FFQ [8-9].
However, multiple-day food records require highly motivated participants, and they are expensive to administer in large samples, thus 3-day food records have been commonly used in practical settings.
Given these aspects, it has been debated which dietary assessment method would be appropriate in large-scale epidemiologic studies. In the present study, we investigated the relative validities of 3-day food records and the FFQ, respectively, by comparing them with 9-day food records.
This study was supported by a grant from the Korean Centers for Disease Control and Prevention (2007-E71014-00).
§Corresponding Author: Mi Kyung Kim, Tel. 82-2-2220-0667, Fax. 82-2-2293-0660, Email. [email protected]
Received: January 29, 2010, Revised: April 13, 2010, Accepted: April 13, 2010
ⓒ2010 The Korean Nutrition Society and the Korean Society of Community Nutrition
This is an Open Access article distributed under the terms of the Creative Commons Attribution Non-Commercial License (http://creativecommons.org/licenses/by-nc/3.0/)
which permits unrestricted non-commercial use, distribution, and reproduction in any medium, provided the original work is properly cited.
Subjects and Methods
Subjects
Subjects were recruited from December 2002 to May 2004 in the Health Examination Center at Hallym University Sacred Heart Hospital located in Anyang, Korea. Full details of the methods used in the study are given elsewhere [10] and are summarized below. A total of 199 subjects between the ages of 40 to 70 years consented to join the study and completed the first food record (FR). Among them, 130 subjects completed the 3-day FRs over four seasons, as well as the FFQ. Six people who changed their diet for weight-loss purposes during the study period were excluded. Thus, 124 participants were included in the final analyses.
Food-frequency questionnaire
A 103-item food FFQ was administered by two trained dietitians. This food-based FFQ was developed with 24-h data from the Korea National Health and Nutrition Examination Survey in 1998. The procedures of development and evaluation of the FFQ are described in detail elsewhere [10-11]. Briefly, food items were selected based on the cumulative percent contribution of each food and the cumulative R
2of multiple regression of each nutrient. The consumption frequency was classified into nine categories: never or seldom, one a month, two to three times a month, one to two times a week, three to four times a week, five to six times a week, once a day, twice a day, or three or more times a day. For the food items with different seasonal availability, like fruits, participants were additionally asked to mark one of four categories with respect to how many months they ate each particular item: three, six, nine and 12 months. Portion size was classified into three categories: small, medium, or large. Several photos of serving sizes of certain foods were presented to help in the understanding of portion sizes.
Food record
Each participant was asked to keep 12-day FRs for one year.
To capture seasonal variations and weekly variations, participants were asked to keep non-consecutive 3-day FRs including one weekend day or holiday during each of the four seasons.
Eighty-five percent of the total participants adhered precisely to the recording days. The participants were asked to record the amounts of foods consumed with multiples of household tableware in order to increase the accuracy of portion size. A standardized protocol was developed by a research dietitian supervisor, which included the manual providing information for FR procedure in detail. Dietitians trained participants with the manual and reviewed unclear descriptions, errors, omissions, or doubtful entries in FRs and asked the participants to clarify them.
The research dietitian supervisor checked all completed records for accuracy.
Twelve-day FRs were collected to validate the FFQ. In the previous validation study between 12-day FRs and the FFQ [10], the Pearson’s correlation coefficients between 12-day FRs and the second FFQ were between 0.10 and 0.46 (median for all nutrients 0.33). Pearson’s correlation coefficients between the first FFQ and the second FFQ ranged between 0.24 (carbohydrate) and 0.58 (cholesterol) [10]. In the current study, 3-day FRs and the remaining 9-day FRs were used to evaluate the relative validities of 3-day FRs and the FFQ.
Statistical analysis
Nutrient intake in the FFQ was calculated using a weighted frequency per day and a portion size per unit of each food item.
The daily nutrient intakes of each participant were the sum of the nutrient intakes of each food item. The seventh edition of the Food Composition Table of Korea was used as the nutrient database [12].
Three-day FRs from each season and a randomly selected season were compared with the remaining 9-day FRs, respectively. The remaining 9-day FRs, as references, were also compared with the FFQ. The mean difference of each nutrient between the 12-day FRs and the FFQ was tested by paired t-test.
Correlations of nutrient intake were assessed by Pearson’s correlation coefficient after adjustment for sex. Most nutrient distributions were skewed, thus, all nutrients were natural log transformed prior to analysis. De-attenuated correlation coefficients were applied to correct the within-person error in the measurements of the FRs. The observed correlations were multiplied by the de-attenuation factor (1+γ/n)
1/2, where γ is the ratio of the within- and between-person variances and n is the number of repeats.
Using the SAS Varcomp procedure, within- and between-person variances were calculated. Nutrient intakes were also adjusted for total energy intake using the residual method [13].
The agreement of 3-day FRs with 9-day FRs and the agreement of 9-day FRs with the FFQ were compared by cross-classification analysis. Subjects were classified into quartiles based on nutrient intake, and the percentages of agreement and disagreement were calculated. All statistical analyses were performed using the SAS software (version 9.1 SAS Institute Inc., Cary, NC), and P values
< 0.05 were considered to be significant.
Results
General characteristics of the subjects are shown in Table 1.
Men made up 26.6% of the total number of subjects, and the
mean age of the subjects was 47.4 years. The mean body mass
index (BMI) of the subjects was 23.4 kg/m
2. The proportions
of current alcohol drinkers and current smokers were 41.1% and
12.9%, respectively.
Table 1. General characteristics of the study subjects
Total Men Women
n 124 33 91
Age (year) 47.4 ± 6.0 49.0 ± 6.7 46.8 ± 5.7
Height (cm) 161.2 ± 6.3 166.8 ± 6.2 159.2 ± 5.0 Weight (kg) 61.1 ± 10.1 67.4 ± 11.5 58.8 ± 8.5 BMI (kg/m2) 23.4 ± 3.0 24.1 ± 3.5 23.2 ± 2.7 Alcohol consumption (%)
Non-drinker 4.0 9.1 2.2
Current drinker 41.1 63.6 33.0
Smoking (%)
Non-smoker 14.5 36.4 6.6
Current smoker 12.9 36.3 5.5
Education level (%)
< 9 years 16.3 15.2 16.7
9-12 years 39.0 33.3 41.1
> 12 years 44.7 51.5 42.2
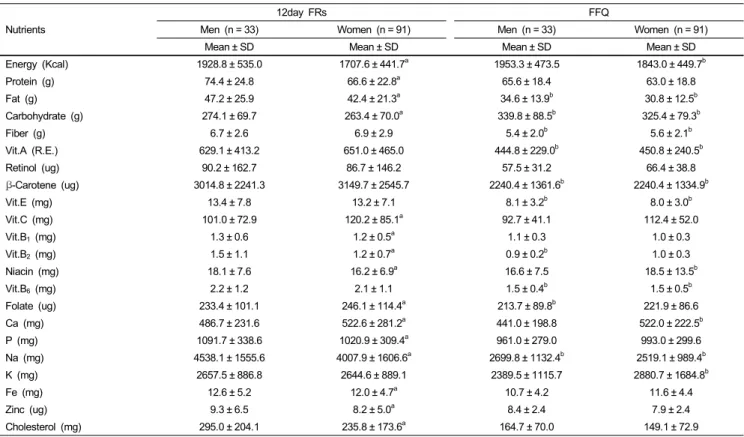
Table 2. Mean daily intakes of energy and nutrients estimated from four 3-day food records (FRs) and the food frequency questionnaire (FFQ) Nutrients
12day FRs FFQ
Men (n = 33) Women (n = 91) Men (n = 33) Women (n = 91)
Mean ± SD Mean ± SD Mean ± SD Mean ± SD
Energy (Kcal) 1928.8 ± 535.0 1707.6 ± 441.7a 1953.3 ± 473.5 1843.0 ± 449.7b
Protein (g) 74.4 ± 24.8 66.6 ± 22.8a 65.6 ± 18.4 63.0 ± 18.8
Fat (g) 47.2 ± 25.9 42.4 ± 21.3a 34.6 ± 13.9b 30.8 ± 12.5b
Carbohydrate (g) 274.1 ± 69.7 263.4 ± 70.0a 339.8 ± 88.5b 325.4 ± 79.3b
Fiber (g) 6.7 ± 2.6 6.9 ± 2.9 5.4 ± 2.0b 5.6 ± 2.1b
Vit.A (R.E.) 629.1 ± 413.2 651.0 ± 465.0 444.8 ± 229.0b 450.8 ± 240.5b
Retinol (ug) 90.2 ± 162.7 86.7 ± 146.2 57.5 ± 31.2 66.4 ± 38.8
β-Carotene (ug) 3014.8 ± 2241.3 3149.7 ± 2545.7 2240.4 ± 1361.6b 2240.4 ± 1334.9b
Vit.E (mg) 13.4 ± 7.8 13.2 ± 7.1 8.1 ± 3.2b 8.0 ± 3.0b
Vit.C (mg) 101.0 ± 72.9 120.2 ± 85.1a 92.7 ± 41.1 112.4 ± 52.0
Vit.B1 (mg) 1.3 ± 0.6 1.2 ± 0.5a 1.1 ± 0.3 1.0 ± 0.3
Vit.B2 (mg) 1.5 ± 1.1 1.2 ± 0.7a 0.9 ± 0.2b 1.0 ± 0.3
Niacin (mg) 18.1 ± 7.6 16.2 ± 6.9a 16.6 ± 7.5 18.5 ± 13.5b
Vit.B6 (mg) 2.2 ± 1.2 2.1 ± 1.1 1.5 ± 0.4b 1.5 ± 0.5b
Folate (ug) 233.4 ± 101.1 246.1 ± 114.4a 213.7 ± 89.8b 221.9 ± 86.6
Ca (mg) 486.7 ± 231.6 522.6 ± 281.2a 441.0 ± 198.8 522.0 ± 222.5b
P (mg) 1091.7 ± 338.6 1020.9 ± 309.4a 961.0 ± 279.0 993.0 ± 299.6
Na (mg) 4538.1 ± 1555.6 4007.9 ± 1606.6a 2699.8 ± 1132.4b 2519.1 ± 989.4b
K (mg) 2657.5 ± 886.8 2644.6 ± 889.1 2389.5 ± 1115.7 2880.7 ± 1684.8b
Fe (mg) 12.6 ± 5.2 12.0 ± 4.7a 10.7 ± 4.2 11.6 ± 4.4
Zinc (ug) 9.3 ± 6.5 8.2 ± 5.0a 8.4 ± 2.4 7.9 ± 2.4
Cholesterol (mg) 295.0 ± 204.1 235.8 ± 173.6a 164.7 ± 70.0 149.1 ± 72.9
aP< 0.05 for the differences by paired t-test between men and women in FRs and FFQ, respectively.
bP< 0.05 for the differences by paired t-test between FRs and FFQ in men and women, respectively.
Mean daily intakes of nutrients estimated by four 3-day FRs and the FFQ are given in Table 2. When four 3-day FRs were used to estimate energy and nutrient intakes, mean intakes of energy, protein, fat, carbohydrate, vitamin B
1and B
2, niacin, phosphorus, Na, Fe, zinc, and cholesterol in men were higher than those of women. Whereas, mean intakes of vitamin C, folate, and calcium in women were higher than those of men. When the FFQ was applied to estimate energy and nutrient intakes, there were no differences in nutrient intakes between men and
women. The intakes of fat, fiber, vitamins A, E, and B
6,β -carotene
,and Na in four 3-day FRs were higher than those of the FFQ.
The intake of carbohydrate in the FFQ was higher than that of the four 3-day FRs.
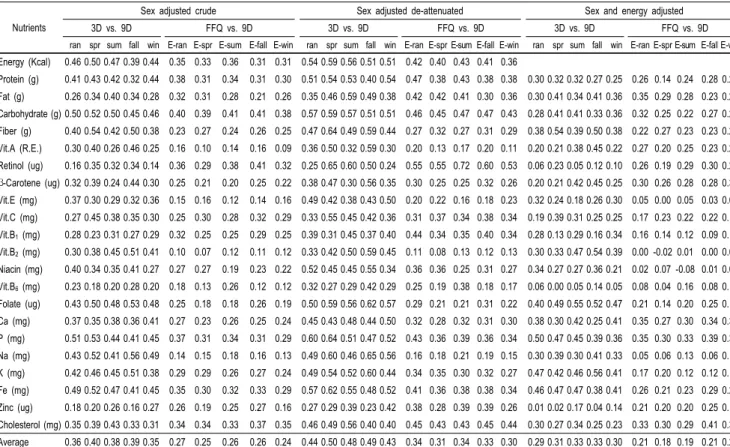
The crude Pearson’s correlation coefficients after adjustment
for sex between 3-day FRs and 9-day FRs for spring, summer,
fall, and winter were 0.18-0.54, 0.20-0.50, 0.16-0.56, and
0.14-0.49, respectively. The Pearson’s correlation coefficients
after adjustment for sex between the FFQ and the 9-day FRs
with exclusions of spring, summer, fall, and winter were
0.07-0.39, 0.12-0.41, 0.11-0.41, and 0.09-0.38, respectively. The
crude Pearson’s correlation coefficients between the 3-day FRs
and the 9-day FRs were higher than the crude Pearson’s
correlation coefficients between the FFQ and the 9-day FRs in
most nutrients (Table 3). Among the crude correlation coefficients
between the 3-day FRs and the 9-day FRs, energy, carbohydrate,
fiber, folate, phosphorus, sodium, and iron showed higher
correlations (≥ 0.4) than did the other nutrients. Vitamin A,
retinol, and β-carotene showed seasonal differences in the
correlations. Among the crude correlation coefficients between
the FFQ and the 9-day FRs, vitamin A, vitamin E, vitamin B
2,
and sodium showed lower correlations (≤ 0.2) than did the other
nutrients. De-attenuated correlation coefficients in most nutrients
were improved in the comparisons (3-day FRs vs. 9-day FRs
and FFQ vs. 9-day FRs). De-attenuated correlation coefficients
of vitamin A, retinol, and β-carotene between 3-day FRs and
Table 3. Comparisons of Pearson’s correlation coefficients; nutrients by 3-days FRs and nutrients by 9-days FRs vs. FFQ and nutrients by 9-days FRs Nutrients
Sex adjusted crude Sex adjusted de-attenuated Sex and energy adjusted
3D vs. 9D FFQ vs. 9D 3D vs. 9D FFQ vs. 9D 3D vs. 9D FFQ vs. 9D
ran spr sum fall win E-ran E-spr E-sum E-fall E-win ran spr sum fall win E-ran E-spr E-sum E-fall E-win ran spr sum fall win E-ran E-spr E-sum E-fall E-win Energy (Kcal) 0.46 0.50 0.47 0.39 0.44 0.35 0.33 0.36 0.31 0.31 0.54 0.59 0.56 0.51 0.51 0.42 0.40 0.43 0.41 0.36
Protein (g) 0.41 0.43 0.42 0.32 0.44 0.38 0.31 0.34 0.31 0.30 0.51 0.54 0.53 0.40 0.54 0.47 0.38 0.43 0.38 0.38 0.30 0.32 0.32 0.27 0.25 0.26 0.14 0.24 0.28 0.26 Fat (g) 0.26 0.34 0.40 0.34 0.28 0.32 0.31 0.28 0.21 0.26 0.35 0.46 0.59 0.49 0.38 0.42 0.42 0.41 0.30 0.36 0.30 0.41 0.34 0.41 0.36 0.35 0.29 0.28 0.23 0.28 Carbohydrate (g) 0.50 0.52 0.50 0.45 0.46 0.40 0.39 0.41 0.41 0.38 0.57 0.59 0.57 0.51 0.51 0.46 0.45 0.47 0.47 0.43 0.28 0.41 0.41 0.33 0.36 0.32 0.25 0.22 0.27 0.27 Fiber (g) 0.40 0.54 0.42 0.50 0.38 0.23 0.27 0.24 0.26 0.25 0.47 0.64 0.49 0.59 0.44 0.27 0.32 0.27 0.31 0.29 0.38 0.54 0.39 0.50 0.38 0.22 0.27 0.23 0.23 0.28 Vit.A (R.E.) 0.30 0.40 0.26 0.46 0.25 0.16 0.10 0.14 0.16 0.09 0.36 0.50 0.32 0.59 0.30 0.20 0.13 0.17 0.20 0.11 0.20 0.21 0.38 0.45 0.22 0.27 0.20 0.25 0.23 0.24 Retinol (ug) 0.16 0.35 0.32 0.34 0.14 0.36 0.29 0.38 0.41 0.32 0.25 0.65 0.60 0.50 0.24 0.55 0.55 0.72 0.60 0.53 0.06 0.23 0.05 0.12 0.10 0.26 0.19 0.29 0.30 0.21 β-Carotene (ug) 0.32 0.39 0.24 0.44 0.30 0.25 0.21 0.20 0.25 0.22 0.38 0.47 0.30 0.56 0.35 0.30 0.25 0.25 0.32 0.26 0.20 0.21 0.42 0.45 0.25 0.30 0.26 0.28 0.28 0.31 Vit.E (mg) 0.37 0.30 0.29 0.32 0.36 0.15 0.16 0.12 0.14 0.16 0.49 0.42 0.38 0.43 0.50 0.20 0.22 0.16 0.18 0.23 0.32 0.24 0.18 0.26 0.30 0.05 0.00 0.05 0.03 0.04 Vit.C (mg) 0.27 0.45 0.38 0.35 0.30 0.25 0.30 0.28 0.32 0.29 0.33 0.55 0.45 0.42 0.36 0.31 0.37 0.34 0.38 0.34 0.19 0.39 0.31 0.25 0.25 0.17 0.23 0.22 0.22 0.18 Vit.B1 (mg) 0.28 0.23 0.31 0.27 0.29 0.32 0.25 0.25 0.29 0.25 0.39 0.31 0.45 0.37 0.40 0.44 0.34 0.35 0.40 0.34 0.28 0.13 0.29 0.16 0.34 0.16 0.14 0.12 0.09 0.10 Vit.B2 (mg) 0.30 0.38 0.45 0.51 0.41 0.10 0.07 0.12 0.11 0.12 0.33 0.42 0.50 0.59 0.45 0.11 0.08 0.13 0.12 0.13 0.30 0.33 0.47 0.54 0.39 0.00 -0.02 0.01 0.00 0.03 Niacin (mg) 0.40 0.34 0.35 0.41 0.27 0.27 0.27 0.19 0.23 0.22 0.52 0.45 0.45 0.55 0.34 0.36 0.36 0.25 0.31 0.27 0.34 0.27 0.27 0.36 0.21 0.02 0.07 -0.08 0.01 0.05 Vit.B6 (mg) 0.23 0.18 0.20 0.28 0.20 0.18 0.13 0.26 0.12 0.12 0.32 0.27 0.29 0.42 0.29 0.25 0.19 0.38 0.18 0.17 0.06 0.00 0.05 0.14 0.05 0.08 0.04 0.16 0.08 0.14 Folate (ug) 0.43 0.50 0.48 0.53 0.48 0.25 0.18 0.18 0.26 0.19 0.50 0.59 0.56 0.62 0.57 0.29 0.21 0.21 0.31 0.22 0.40 0.49 0.55 0.52 0.47 0.21 0.14 0.20 0.25 0.19 Ca (mg) 0.37 0.35 0.38 0.36 0.41 0.27 0.23 0.26 0.25 0.24 0.45 0.43 0.48 0.44 0.50 0.32 0.28 0.32 0.31 0.30 0.38 0.30 0.42 0.25 0.41 0.35 0.27 0.30 0.34 0.37 P (mg) 0.51 0.53 0.44 0.41 0.45 0.37 0.31 0.34 0.31 0.29 0.60 0.64 0.51 0.47 0.52 0.43 0.36 0.39 0.36 0.34 0.50 0.47 0.45 0.39 0.36 0.35 0.30 0.33 0.39 0.37 Na (mg) 0.43 0.52 0.41 0.56 0.49 0.14 0.15 0.18 0.16 0.13 0.49 0.60 0.46 0.65 0.56 0.16 0.18 0.21 0.19 0.15 0.30 0.39 0.30 0.41 0.33 0.05 0.06 0.13 0.06 0.10 K (mg) 0.42 0.46 0.45 0.51 0.38 0.29 0.29 0.26 0.27 0.24 0.49 0.54 0.52 0.60 0.44 0.34 0.35 0.30 0.32 0.27 0.47 0.42 0.46 0.56 0.41 0.17 0.20 0.12 0.12 0.11 Fe (mg) 0.49 0.52 0.47 0.41 0.45 0.35 0.30 0.32 0.33 0.29 0.57 0.62 0.55 0.48 0.52 0.41 0.36 0.38 0.38 0.34 0.46 0.47 0.47 0.38 0.41 0.26 0.21 0.23 0.29 0.27 Zinc (ug) 0.18 0.20 0.26 0.16 0.27 0.26 0.19 0.25 0.27 0.16 0.27 0.29 0.39 0.23 0.42 0.38 0.28 0.39 0.39 0.26 0.01 0.02 0.17 0.04 0.14 0.21 0.20 0.20 0.25 0.13 Cholesterol (mg) 0.35 0.39 0.43 0.33 0.31 0.34 0.34 0.33 0.37 0.35 0.46 0.49 0.56 0.40 0.40 0.45 0.43 0.43 0.45 0.44 0.30 0.27 0.34 0.25 0.23 0.33 0.30 0.29 0.41 0.34 Average 0.36 0.40 0.38 0.39 0.35 0.27 0.25 0.26 0.26 0.24 0.44 0.50 0.48 0.49 0.43 0.34 0.31 0.34 0.33 0.30 0.29 0.31 0.33 0.33 0.30 0.21 0.18 0.19 0.21 0.20 Ran, randomly selected three days vs. remaining nine days; spr, three spring days vs. remaining nine days; sum, three summer days vs. remaining nine days; fall, three fall days vs. remaining nine days; win, three winter days vs. remaining nine days; E-ran, exclusion of randomly selected three days vs. FFQ; E-spr, exclusion of three spring days vs. FFQ; E-sum, exclusion of three summer days vs. FFQ; E-fall, exclusion of three fall days vs. FFQ; E-win, exclusion of three winter days vs. FFQ.
9-day FRs constantly showed seasonal differences. After adjusting for sex and energy intake, the correlation coefficients of most nutrients in the comparison were decreased. The crude, de-attenuated, and energy-adjusted correlation coefficients between the 3-day FRs and the 9-day FRs were constantly higher than those between the FFQ and the 9-day FRs.
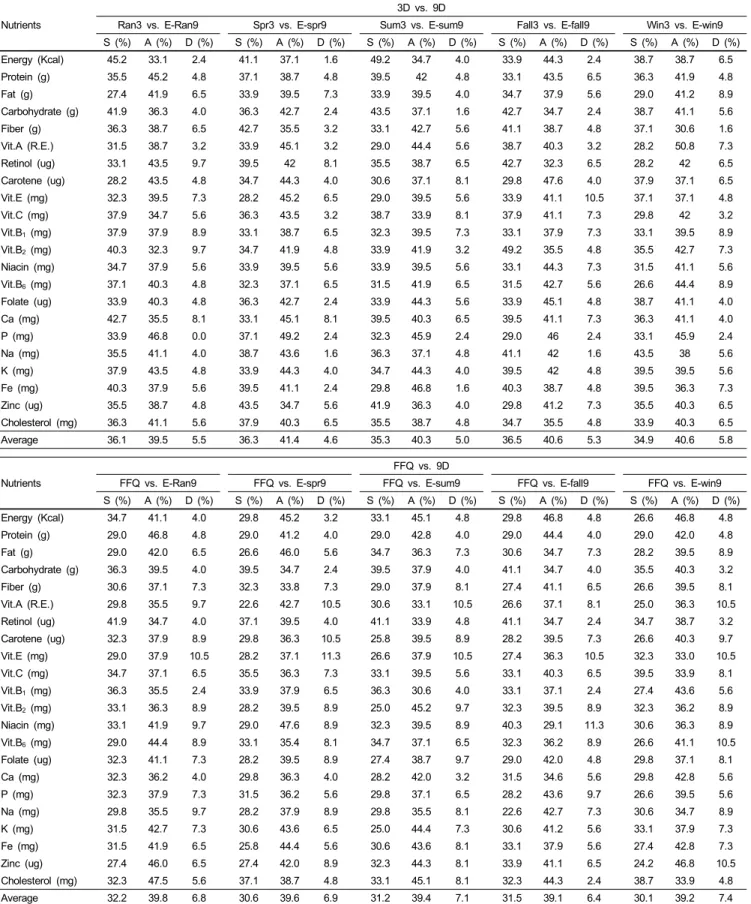
The results of the cross-classification analysis are presented in Table 4. The average proportions of classification into the same quartiles, adjacent quartiles, and distant quartiles between the 3-day FRs and the 9-day FRs were 35.8%, 40.5%, and 5.2%, respectively. The nutrients which showed ≥ 10% seasonal differences in the classification into the same quartiles or adjacent quartiles between the 3-day FRs and 9-day FRs were energy, fiber, vitamin A, retinol, vitamin B
2, phosphorus, iron, and zinc.
On average, the proportions of classification into the same quartiles, adjacent quartiles, and distant quartiles between the FFQ and 9-day FRs were 31.1%, 39.4%, and 6.9%, respectively.
Discussion
In this validation study, we evaluated the relative validities of 3-day food records (FRs) and the food frequency questionnaire
(FFQ) by comparing them with that of the 9-day FRs. Correlation coefficients between the 3-day FRs and the 9-day FRs were higher than those between the FFQ and the 9-day FRs. Vitamin A, retinol, and β-carotene showed seasonal differences in the correlation coefficients. Average proportions of classification into the same quartiles and adjacent quartiles between the 3-day FRs and the 9-day FRs were higher than those between the FFQ and the 9-day FRs, but cross-classifications of two methods (3-day FRs and FFQ) with 9-day FRs showed that both the 3-day FRs and the FFQ were able to reasonably categorize individuals by nutrient intake. Three-day FRs showed higher correlations and higher agreement proportions of quartile classification with the 9-day FRs than did the FFQ, but both of the relative validities of 3-day FRs and FFQ were acceptable for use as dietary assessment tools.
In the present study, correlations between 3-day FRs and 9-day
FRs were higher than correlations between 9-day FRs and the
FFQ. The FFQ used in our study was a food-based FFQ and,
thus, seasonings and cooking oils were omitted, which might
affect the estimations of some nutrients and correlations with
FRs. In the study by Yun et al. [14], excluding oils and seasonings
from a FFQ underestimated vegetable fat, vitamin E, and sodium
intake, and Shim et al. [15] reported that seasonings contributed
Table 4. The proportion of agreement in quartile distribution of nutrients from 3-day FRs and 9-day FRs vs. 9-day FRs and FFQ Nutrients
3D vs. 9D
Ran3 vs. E-Ran9 Spr3 vs. E-spr9 Sum3 vs. E-sum9 Fall3 vs. E-fall9 Win3 vs. E-win9
S (%) A (%) D (%) S (%) A (%) D (%) S (%) A (%) D (%) S (%) A (%) D (%) S (%) A (%) D (%)
Energy (Kcal) 45.2 33.1 2.4 41.1 37.1 1.6 49.2 34.7 4.0 33.9 44.3 2.4 38.7 38.7 6.5
Protein (g) 35.5 45.2 4.8 37.1 38.7 4.8 39.5 42 4.8 33.1 43.5 6.5 36.3 41.9 4.8
Fat (g) 27.4 41.9 6.5 33.9 39.5 7.3 33.9 39.5 4.0 34.7 37.9 5.6 29.0 41.2 8.9
Carbohydrate (g) 41.9 36.3 4.0 36.3 42.7 2.4 43.5 37.1 1.6 42.7 34.7 2.4 38.7 41.1 5.6
Fiber (g) 36.3 38.7 6.5 42.7 35.5 3.2 33.1 42.7 5.6 41.1 38.7 4.8 37.1 30.6 1.6
Vit.A (R.E.) 31.5 38.7 3.2 33.9 45.1 3.2 29.0 44.4 5.6 38.7 40.3 3.2 28.2 50.8 7.3
Retinol (ug) 33.1 43.5 9.7 39.5 42 8.1 35.5 38.7 6.5 42.7 32.3 6.5 28.2 42 6.5
Carotene (ug) 28.2 43.5 4.8 34.7 44.3 4.0 30.6 37.1 8.1 29.8 47.6 4.0 37.9 37.1 6.5
Vit.E (mg) 32.3 39.5 7.3 28.2 45.2 6.5 29.0 39.5 5.6 33.9 41.1 10.5 37.1 37.1 4.8
Vit.C (mg) 37.9 34.7 5.6 36.3 43.5 3.2 38.7 33.9 8.1 37.9 41.1 7.3 29.8 42 3.2
Vit.B1 (mg) 37.9 37.9 8.9 33.1 38.7 6.5 32.3 39.5 7.3 33.1 37.9 7.3 33.1 39.5 8.9
Vit.B2 (mg) 40.3 32.3 9.7 34.7 41.9 4.8 33.9 41.9 3.2 49.2 35.5 4.8 35.5 42.7 7.3
Niacin (mg) 34.7 37.9 5.6 33.9 39.5 5.6 33.9 39.5 5.6 33.1 44.3 7.3 31.5 41.1 5.6
Vit.B6 (mg) 37.1 40.3 4.8 32.3 37.1 6.5 31.5 41.9 6.5 31.5 42.7 5.6 26.6 44.4 8.9
Folate (ug) 33.9 40.3 4.8 36.3 42.7 2.4 33.9 44.3 5.6 33.9 45.1 4.8 38.7 41.1 4.0
Ca (mg) 42.7 35.5 8.1 33.1 45.1 8.1 39.5 40.3 6.5 39.5 41.1 7.3 36.3 41.1 4.0
P (mg) 33.9 46.8 0.0 37.1 49.2 2.4 32.3 45.9 2.4 29.0 46 2.4 33.1 45.9 2.4
Na (mg) 35.5 41.1 4.0 38.7 43.6 1.6 36.3 37.1 4.8 41.1 42 1.6 43.5 38 5.6
K (mg) 37.9 43.5 4.8 33.9 44.3 4.0 34.7 44.3 4.0 39.5 42 4.8 39.5 39.5 5.6
Fe (mg) 40.3 37.9 5.6 39.5 41.1 2.4 29.8 46.8 1.6 40.3 38.7 4.8 39.5 36.3 7.3
Zinc (ug) 35.5 38.7 4.8 43.5 34.7 5.6 41.9 36.3 4.0 29.8 41.2 7.3 35.5 40.3 6.5
Cholesterol (mg) 36.3 41.1 5.6 37.9 40.3 6.5 35.5 38.7 4.8 34.7 35.5 4.8 33.9 40.3 6.5
Average 36.1 39.5 5.5 36.3 41.4 4.6 35.3 40.3 5.0 36.5 40.6 5.3 34.9 40.6 5.8
Nutrients
FFQ vs. 9D
FFQ vs. E-Ran9 FFQ vs. E-spr9 FFQ vs. E-sum9 FFQ vs. E-fall9 FFQ vs. E-win9
S (%) A (%) D (%) S (%) A (%) D (%) S (%) A (%) D (%) S (%) A (%) D (%) S (%) A (%) D (%)
Energy (Kcal) 34.7 41.1 4.0 29.8 45.2 3.2 33.1 45.1 4.8 29.8 46.8 4.8 26.6 46.8 4.8
Protein (g) 29.0 46.8 4.8 29.0 41.2 4.0 29.0 42.8 4.0 29.0 44.4 4.0 29.0 42.0 4.8
Fat (g) 29.0 42.0 6.5 26.6 46.0 5.6 34.7 36.3 7.3 30.6 34.7 7.3 28.2 39.5 8.9
Carbohydrate (g) 36.3 39.5 4.0 39.5 34.7 2.4 39.5 37.9 4.0 41.1 34.7 4.0 35.5 40.3 3.2
Fiber (g) 30.6 37.1 7.3 32.3 33.8 7.3 29.0 37.9 8.1 27.4 41.1 6.5 26.6 39.5 8.1
Vit.A (R.E.) 29.8 35.5 9.7 22.6 42.7 10.5 30.6 33.1 10.5 26.6 37.1 8.1 25.0 36.3 10.5
Retinol (ug) 41.9 34.7 4.0 37.1 39.5 4.0 41.1 33.9 4.8 41.1 34.7 2.4 34.7 38.7 3.2
Carotene (ug) 32.3 37.9 8.9 29.8 36.3 10.5 25.8 39.5 8.9 28.2 39.5 7.3 26.6 40.3 9.7
Vit.E (mg) 29.0 37.9 10.5 28.2 37.1 11.3 26.6 37.9 10.5 27.4 36.3 10.5 32.3 33.0 10.5
Vit.C (mg) 34.7 37.1 6.5 35.5 36.3 7.3 33.1 39.5 5.6 33.1 40.3 6.5 39.5 33.9 8.1
Vit.B1 (mg) 36.3 35.5 2.4 33.9 37.9 6.5 36.3 30.6 4.0 33.1 37.1 2.4 27.4 43.6 5.6
Vit.B2 (mg) 33.1 36.3 8.9 28.2 39.5 8.9 25.0 45.2 9.7 32.3 39.5 8.9 32.3 36.2 8.9
Niacin (mg) 33.1 41.9 9.7 29.0 47.6 8.9 32.3 39.5 8.9 40.3 29.1 11.3 30.6 36.3 8.9
Vit.B6 (mg) 29.0 44.4 8.9 33.1 35.4 8.1 34.7 37.1 6.5 32.3 36.2 8.9 26.6 41.1 10.5
Folate (ug) 32.3 41.1 7.3 28.2 39.5 8.9 27.4 38.7 9.7 29.0 42.0 4.8 29.8 37.1 8.1
Ca (mg) 32.3 36.2 4.0 29.8 36.3 4.0 28.2 42.0 3.2 31.5 34.6 5.6 29.8 42.8 5.6
P (mg) 32.3 37.9 7.3 31.5 36.2 5.6 29.8 37.1 6.5 28.2 43.6 9.7 26.6 39.5 5.6
Na (mg) 29.8 35.5 9.7 28.2 37.9 8.9 29.8 35.5 8.1 22.6 42.7 7.3 30.6 34.7 8.9
K (mg) 31.5 42.7 7.3 30.6 43.6 6.5 25.0 44.4 7.3 30.6 41.2 5.6 33.1 37.9 7.3
Fe (mg) 31.5 41.9 6.5 25.8 44.4 5.6 30.6 43.6 8.1 33.1 37.9 5.6 27.4 42.8 7.3
Zinc (ug) 27.4 46.0 6.5 27.4 42.0 8.9 32.3 44.3 8.1 33.9 41.1 6.5 24.2 46.8 10.5
Cholesterol (mg) 32.3 47.5 5.6 37.1 38.7 4.8 33.1 45.1 8.1 32.3 44.3 2.4 38.7 33.9 4.8
Average 32.2 39.8 6.8 30.6 39.6 6.9 31.2 39.4 7.1 31.5 39.1 6.4 30.1 39.2 7.4
E-ran9, exclusion of randomly selected three days; E-spr9, exclusion of three spring days; E-sum9, exclusion of three summer days; E-fall9, exclusion of three fall days;
E-win9, exclusion of three winter days; S, same quartile; A, adjacent quartile; D, distant quartile.