I. 서 론
지구온난화에 따른 기후 변화로 인하여 대기 중 CO2농도가 매우 중요한 기후학적 요소로 대두되었 다. 해양은 지표면에서 CO2의 가장 큰 저장고로 매 년 인위적으로 대기 중으로 방출하는 잉여 CO2의
30% 이상이 해양에 흡수되어 전 지구적 탄소 순환에 매우 중요한 역할을 하고 있다(Falkowski and Wilson, 1992; Park et al., 1998).
해양에서 대기 중 CO2를 제거하는 과정은 식물에 의한 탄소 과정(광합성 작용) 인 생물펌프와 대기중 이산화탄소가 해수에 용해되고 또 곳에 따라서는 해
동중국해 북부 해역의 엽록소 고농도 덩어리 분석
정 종 철 남서울대학교 GIS공학과
The Analysis of High Chlorophyll-a Concentration Patch in the North Marine Areas of East China Sea
Jong-chul Jeong Namseoul Univ. Dep. of GIS
Abstract
This study investigated temporal-spatial and variations in Geostationary Ocean Color Imager (GOCI) products of parameters total suspended solids (TSS) and chlorophyll-a in the North Marine Areas of East China Sea. GOCI data were collected daily from February 2012 to December 2012. The higher chlorophyll-a values were observed during the investigation period. The relatively large increase in TSS and chlorophyll-a at the sampling stations coupled with typhoon events during the summer rainy period. The abnormal chlorophyll-a concentration was mainly driven by meteorological factors such as typhoon and rainfall in the coastal areas of Jeju and the North Marine Areas of East China Sea. The abnormal high chlorophyll-a concentration at the majority of the coastal stations indicate eutrophication of coastal waters, especially Red tide. The events such as eutrophication and abnormal high chlorophyll-a concentration may potentially influence outbreak of Red Tide, detected with GOCI parameters.
Keywords : East China Sea, GOCI parameters, high chlorophyll-a concentration 연구노트
Corresponding Author: Jongchul-Jeong, Dept. GIS, Namseoul University, Korea Tel: +82-41-560-2375 Phone: +82-10-9044-4850 E-mail: [email protected]
Received : 7 March, 2014. Revised : 28 March, 2014. Accepted : 15 April, 2014.
표면의 해수가 심층으로 하강(downwelling)하는 물 리적 펌프를 통해 이루어진다. 생물펌프는 해양 식물 플랑크톤에 의한 광합성 작용으로 무기탄소를 유기 물로 합성하는 것으로 해양의 일차생산력을 평가하 는 중요한 인자이며, 지구환경 규모에서 기후변화와 해양식물플랑크톤의 정량적, 공간적 분포 분석은 해 양 생태계 변동성 연구 외에 기후학적으로도 중요하 다(Falkowski and Wilson, 1992; Doerffer and Schiller, 2007; Darecki and Stramski, 2004).
미국 NASA에서는 지구의 광범위한 공간영역에서 해양기후변화인자를 해석하기 위해 CZCS, SeaWiFs, MODIS 등의 해색센서에 의한 해양관측을 해 왔고 (Gordon and Clark, 1981; Meroni et al., 2009;
Morel and Maritorena, 2001; Doron et al., 2011), 우리나라에서는 정지궤도에 천리안 위성을 발사하 여, 세계 최초로 정지궤도에서 하루 8회 해색관측을 수행하는 Geostationary Ocean Color Imager(GOCI) 센서를 성공적으로 운영하고 있다(Hu et al., 2012;
Kevin et al., 2012). 해색센서에 의한 엽록소 함량 의 공간 분포를 정량적으로 해석하는 알고리즘의 개 발과 식물플랑크톤 종들의 공간 분포 특성에 대한 연 구를 통해 조사 선박에 의해 평가하기 어려운 다양한 해양환경변화에 대한 관측이 이루어졌다(Morel, Antoine and Gentili, 2002; Carder et al., 2004;
Pradhan et al., 2005). 특히 연근해에서의 적조 발 생을 위성으로 관측하는 연구와 엽록소, 부유사, 용 존 유기물 농도를 정량적으로 해석하는 결과가 발표 되었고, 빛의 소광계수(K490)을 전 지구적인 공간범 위에서 해석하여 왔다(Corsini. Grasso and Cipollini, 2002; Schalles, 2006; Morel et al., 2007; Huot.
Brown and Cullen, 2005).
우리나라에서도 해색센서에 의한 한반도 해양 관 측이 이루어져 왔고, 연근해역의 해양환경수질모니 터링과 적조, 해양투기, 녹조의 이상발생과 이동관측 등 다양한 연구가 이루어졌다(Ahn et al., 2006), 그 러나 최근 해색센서 관측에 의해 동중국해역을 비롯 한 제주도 인근해역에서 비정상적으로 엽록소 농도 가 상승하는 것을 발견하게 되었고(Zhang et al., 2010), 이에 대한 원인 분석과 평가에 대한 연구가 필
요한 실정이나 제시된 연구성과가 부족하다.
따라서 본 연구에서는 GOCI 자료를 이용하여 제 주도 주변 해역에서 발생하는 고농도 엽록소 덩어리 (patch)의 위치를 분석하는데 있어서 GOCI 해색자 료를 적용하는데 연구의 목적이 있다. Fig. 1은 본 연 구대상지역의 공간적 범위를 GOCI 해색센서에 의해 나타낸 것이다.
II. 연구방법
해양에서 엽록소 농도의 변이를 분석하기 위해서 는 엽록소 농도를 정량적으로 평가하기 위한 방법이 요구되었는데, 본 연구에서는 한국해양과학기술원 해양위성센터에서 제공하는 GOCI 자료를 ENVI Tool과 GOCI Data Processing Syestem(GDPS)를 이용하여 엽록소 농도를 산출하고 시공간적으로 분 석하였다(Tyu et al. 2012). 특히 GOCI 자료는 엽록 소 , colored dissolved organic matter(CDOM), total suspende sediment(TSS), diffuse attenuation coefficient(K490)의 정량적인 농도를 산출하는 알 고리즘을 적용하여(Nicolas et al., 2012) 같은 날 11 시, 12시, 13시에 관측된 자료를 분석하였다.
Fig. 2는 본 연구의 공간적 범위와 동일 시간대 일 별, 월별 관측 자료를 비교하기 위한 자료의 x- Profile 지점을 나타낸 것이다. GOCI로부터 추출한 동중국해의 엽록소, CDOM, TSS, K490의 정량적인 농도를 이러한 지점을 중심으로 높은 지역과 농도의 변화가 큰 지역을 공간 분석하였다.
본 연구의 시간적 범위는 2012년 1년 동안의 엽록 Fig. 1. Satellite image of study area using GOCI
소, CDOM, TSS, K490의 정량적인 농도를 비교하 였고, 특히 태풍이 없었던 5월과 태풍이 발생했었던 6월, 7월, 8월의 변화를 중심으로 해석하기 위해 2012년 5월부터 8월까지 제주도 주변에서 관측이 가 능한 모든 자료를 IDL과 ENVI 파일로 변환하여 통 계분석하였다.
III. 결과 및 고찰
본 연구에서는 Fig. 3과 같이 2012년 5월부터 8월 까지의 동중국 해역에서 나타나는 월별, 일별, 시간 별 엽록소 농도를 분석하였고, 이중 일별 해당시간의 최대 농도 값을 나타내어 엽록소 농도가 높은 양자강 하구 또는 중국해안에서 고농도의 엽록소 덩어리가 나타나는 동중국해 북부 지역으로부터 제주도 해역 에 이르는 높은 농도 엽록소 패취 지역이 관측되는 것을 GOCI 산출물에 의해 파악하였다. 중국연안에 서 기인하는 높은 부유사, 엽록소 농도현상은 시기적 으로 다양한 경로를 통해 제주도 연안해역에 영향을 미치는 것으로 보인다. 양자강 하구와 중국연안에서 는 TSS와 엽록소를 추출하는 위성 관측 시그널이 분 리되지 않아서 실제로는 TSS의 반사도에 의해 엽록 소 농도가 크게 나타나는 지역이지만, 이들지역으로 부터 제주도 연안해역으로 이동하는 고농도의 엽록 소 덩어리 분포와 부유사의 이동을 시기적으로 파악 하였다.
Fig. 3에서 x축은 양자강 하구와 중국연안에서부 터 제주해역까지의 거리를 나타낸 것으로 숫자는 픽 셀 500m의 거리를 나타내고 있으며, y축은 분석항 목의 농도자료로 일별 엽록소와 부유사 최대값이 시 간에 관계없이 비정상적으로 상승을 한다는 것을 알 수 있다. 5월부터 7월까지 10mg/m3이상으로 상승
을 하는 날은 많지 않았지만 8월은 10mg/m3이상의 보편적인 연안에서 관측되는 농도보다 비정상적으로 상승을 하는 날이 다른 월보다는 많았다. 비정상적 으로 높은 엽록소 농도 값이 공간적으로 비연속적으 로 나타날 뿐 아니라 시간적으로도 연계성이 없다는 것은 실제 자연현상에서 일어나는 값이라고 보기 어 렵다.
Fig. 3부터 Fig. 8은 5월부터 7월까지의 시간별 엽록소 농도의 분포 패턴과 상승과 하락을 보여준다.
Fig. 3에서 5월의 엽록소 농도는 어느 한 지점에서 비정상적으로 상승을 하는 것이 아니라 산발적으로 상승을 하고 있다. 또한 제주도 해역에서는 약 3mg/m3로 상승하는 것이 제주도 해역에서 멀어질수 록 최소 2배에서 최대 55배 정도 상승을 하고 있다.
Fig. 6에서 7월의 엽록소 농도 또한 어느 한 지점 에서 비정상적으로 상승을 하는 것이 아니라 산발적 으로 상승을 하고 있다.
7월 11시의 엽록소 농도는 비정상적으로 상승하는 지점이 12시, 13시 보다는 적었다. 12시에는 제주도 우측 해역에서 평균 2mg/m3상승을 하였고, 좌측해 역에서는 평균 3mg/m3이상 상승하였다. 13시에는 제주도의 우측으로 약 3mg/m3이상과 약 6mg/m3 이상으로 상승하는 지점이 산발적으로 상승을 하였 고, 좌측지점으로는 약 3~5mg/m3이상으로 상승을 하였다. 5월과 6월에 비해서는 비정상적인 상승의 크 기가 낮은 것을 알 수 있다.
5월과 7월의 엽록소 농도 변화를 비교하면 11시 상 승이 중국 연안 지점에서 약 350mg/m3이상으로 가 장 높게 나타났다. 제주도 우측으로도 약 100mg/m3에 가까운 농도를 나타냈다. 12시에는 제주도의 좌측지 점으로 약 180mg/m3이하의 상승을 하였고, 작게는 약 40mg/m3이하로 산발적인 상승을 보였다. 우측 으로는 약 20mg/m3이하의 상승을 하였다. 13시에 는 제주도 좌측지점으로 약 10~50mg/m3정도 비정 상적인 상승을 보였고, 우측지점은 약 10~28mg/m3 정도 상승된 것을 알 수 있다. 7월과 8월에는 엽록소 농도의 비정상적으로 상승하는 지점이 많았으며, 상 승폭도 약 350mg/m3이상으로 가장 높았다. 또한 산발적으로 상승하는 지점도 다른 월에 비해 많이 분 Fig. 2. GOCI chlorophyll-a with x-profile spectrum of study
area(red line is extracted location of chlorophyll-a from GOCI data).
포해 있었다.
7월과 8월에는 3개의 태풍에 영향을 받았으며, 태 풍이 지나가고 난 후 엽록소 농도의 상승이 커진 것 으로 판단된다. 이러한 지역에서 태풍 후 엽록소 농 도가 높아지는 것은 지극히 정상적인 현상이다(Ye et
al, 2013). 따라서 Fig. 3부터 Fig. 8의 농도분포 경 향처럼 태풍의 영향에 의한 농도 상승과 태풍이 통과 하지 않는 시기에 이상적인 농도 상승을 비교하는 것 은 의미있는 것으로 파악되었다.
Zhang et al.(2010)은 여름에 나타나는 구름은 주
Fig. 3. The x-profile of chlorophyll-a that is extracted from the North Marine Areas of East China Sea coast line to Jeju island at 11hr May, 2012.
Fig. 4. The x-profile of chlorophyll-a that is extracted from the North Marine Areas of East China Sea coast line to Jeju island at 12hr May, 2012.
Fig. 5. The x-profile of chlorophyll-a that is extracted from the North Marine Areas of East China Sea coast line to Jeju island at 13hr May, 2012.
Fig. 6. The x-profile of chlorophyll-a that is extracted from the North Marine Areas of East China Sea coast line to Jeju island at 11hr July, 2012.
Fig. 7. The x-profile of chlorophyll-a that is extracted from the North Marine Areas of East China Sea coast line to Jeju island at 12hr July, 2012.
Fig. 8. The x-profile of chlorophyll-a that is extracted from the North Marine Areas of East China Sea coast line to Jeju island at 13hr July, 2012.
로 많은 강수를 동반하는 구름이고 태풍이 지나가면 서 구름탐지가 제대로 이루어지지 않으면 화소는 구 름에 의해 오염되고 결과적으로 비정상적인 관측 값 으로 엽록소 농도를 산출하게 되므로 이때 오차를 유 발할 수 있다는 판단을 밝힌바 있다. 이처럼 5월을 제 외한 7월~8월에는 태풍의 영향을 받게 되었고, 7월 에는 태풍의 영향이 적었지만 구름의 양이 다른 시기 보다 많이 발생하여 엽록소 농도의 비정상적으로 상 승한 값이 관측이 되었다.
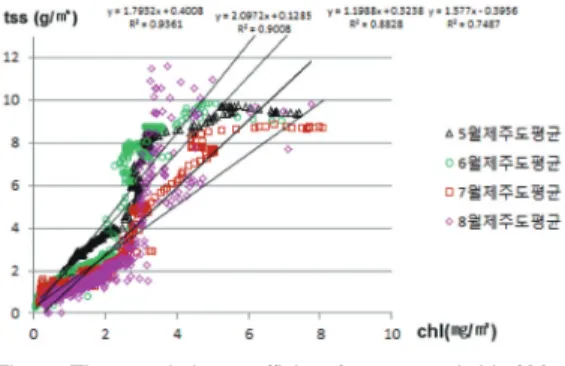
Fig. 9는 제주도지점의 엽록소 농도와 부유물질의 상관관계를 분석하기 위하여 분산형 그래프로 나타 내었으며, 엽록소 농도와 부유물질 농도 수치 간의 높은 상관관계를 보여준다. RSQ 함수는 데이터 요 소에 대해 피어슨의 곱 모멘트 상관계수의 제곱 값을 반환하고, 이때 r의 제곱값은 x 분산에 영향을 주는 y 분산의 비율로 해석될 수 있다. 분석하고자 하는 시 기에는 4개의 태풍이 영향을 주었으며, 7월은 카눈, 8월은 담레이, 덴빈, 볼라벤에 의해 직 간접적인 영 향을 받았다.
제주도 지점에서 각 농도간의 나타난 상관관계 Fig. 9에서 7월의 chl과 tss의 상관관계는 약0.8828
을 나타냈으며, 8월은 chl과 tss는 약0.7487로 7월 과 8월의 태풍의 영향을 받기 전인 5월과 6월에 비해 수치가 낮은 것을 알 수 있다.
Table 1은 연구지역의 부유사, 용존유기물, 엽록 소의 월 평균자료에 의한 정점별 관측치를 상관 분석 한 결과이다. 용존유기물과 엽록소는 0.9이상의 높 은 상관성을 나타내고 있으나, 부유사와 용존유기물 의 경우 태풍시기에 0.65의 낮은 상관성을 나타내고 있어서 이들 항목에 의한 이상 상승지역 분석이 의미 있는 결과를 제시하고 있다. 이러한 경향은 부유사와 엽록소의 상관계수에서 잘 나타나고 있는데 제주도 주변해역의 부유사는 중국으로부터 유입되는 경로를 의미하고 이에 의한 엽록소의 이상 증가가 원인이 될 수 있다. 상관분석의 결과에서 5월부터 8월의 결과 는 시기별로 엽록소 이상 증가의 원인이라고 판단되 는 태풍의 영향과 일치하는 경향을 나타내고 있다.
IV. 결 론
본 연구에서는 GOCI 자료를 이용하여 동중국해 북부 해역에서 발생하는 높은 부유사, 용존유기물, 엽록소 농도를 일별, 월별자료에 의해 분석하였다.
지구온난화에 따른 기후변화로 인하여 대기 중 CO2 농도가 매우 중요한 기후학적 요소로 대두되었기 때 문에 GOCI 자료의 엽록소 농도는 해양의 CO2저감 에 대한 기여하는 정도를 평가하는 중요한 인자이다.
본 연구의 성과를 다음과 같이 요약할 수 있다.
첫째, GOCI 엽록소 농도는 시간별 월별 일정한 공 간적 범위에 불규칙적으로 상승하는 비정상적인 값 들을 나타낸다. 제주도 해역에서 외해로 갈수록 비정 상적 상승의 엽록소 농도 값이 동중국해북부 해역에 Fig. 9. The correlation coefficient from tss and chl of May,
June, July, Aug. 2012.
Table 1. Comparison CDOM, TSS and chlorophyll-a correlation value of Jeju area
May June July Aug
cdom-chl y = 7.25x-0.29
R2= 0.98 y = 6.29x-0.24
R2= 0.91 y = 7.1x-0.08
R2= 0.96 y = 11.8x-0.52 R2= 0.98 cdom-TSS y = 13.2x-0.1771
R2= 0.96 y = 14.1x-0.5157
R2= 0.93 y = 8.8x + 0.17
R2= 0.90 y = 18.8x - 1.22 R2= 0.65 chl-TSS y = 1.79x+0.40
R2= 0.93 y = 2.09x + 0.12
R2= 0.90 y = 1.19x + 0.33
R2= 0.88 y = 1.57x - 0.39 R2= 0.74
서 보다 많이 관측 되었다.
둘째, GOCI 엽록소 농도의 비정상적인 상승이 많 이 관측이 된 시기는 7월과 8월로 GOCI 자료에서 다 른 시기보다 높게 상승하는 농도 값이 관측이 되었 다. 2012년 8월은 다른 시기보다 태풍의 영향을 많이 받은 시기로 태풍이 제주도 해역에 직접적인 영향을 주었으며, 태풍이 지나간 후 엽록소 농도가 상승 정 도가 다른 시기보다 약 30~350배 이상의 상승을 나 타냈다. GOCI 자료를 통한 해양환경 연구는 현재 많 은 응용분야에서 이루어지고 있으며, 비정상적으로 상승한 오차를 고려하여 관측 결과를 분석해야 적조 와 같은 해양환경탐지에 해색연구의 결과가 적용되 어질 것으로 판단된다.
사 사
본 연구는 남서울대학교 2014년 교내연구과제의 지원에 의해 이루어졌으며, 이에 감사를 드립니다.
참고문헌
Ahn, Y.H., P. Shanmugam, J.H. Ryu and J.C.
Jeong, 2006. Satellite detection of harmful algal bloom occurrence in Korean waters. Harmful Algae, 5(2), 213- 231.
Carder, K.L., F.R. Chen, J.P. Cannizzaro, J.W.
Campbell and B.G. Mitchell, 2004.
Performance of the MODIS semi- analytical ocean color algorithm for chlorophyll-a. Advances in Space Research, 33(7), 1152-1159.
Corsini, G., R. Grasso and P. Cipollini, 2002.
Regional bio-optical algorithms for the Alboran Sea from a reflectance model and in situ data. Geophysical Research Letters, 29(15), 1739, 10.1029/2001GL 013861.
Darecki, M., and D. Stramski, 2004. An
evaluation of MODIS and SeaWiFS bio- optical algorithms in the Baltic Sea.
Remote Sensing of Environment, 89(3), 326-350.
Doerffer, R. and H. Schiller, 2007. The MERIS Case 2 water algorithm. International Journal of Remote Sensing, 28(3-4), 517- 535.
Doron, M., M. Babin, O. Hembise, A. Mangin, and P. Garnesson. 2011. Ocean transparency from space: 17 validation of algorithm estimating Secchi depth using MERIS, MODIS and SeaWiFS data. Remote Sensing of Environment, 115, 2986-3001.
Falkowski, P. G. and C. Wilson, 1992. Phytoplankton productivity in the North Pacific ocean since 1900 and 20 implications for absorption of anthropogenic CO2, Nature, 358, 741-743.
Gordon, H. and D.K. Clark, 1981. Clear water radiances for atmospheric correction of coastal zone color scanner imagery. Appl.
Opt., 20(24), 4175-4180.
Huot, Y., C.A. Brown and J.J. Cullen, 2005.
New algorithms for MODIS sun-induced chlorophyll fluorescence and a comparison with present data products.
Limnology and Oceanography: Methods, 3, 108-130.
Hu, C., L. Feng and Z, P. Lee. 2012. Evaluation of GOCI sensitivity for at sensor radiance and GDPS retrived chlorophyll-a products. Ocean Sci. J. 47(3), 279-285.
Kevin, R et al., 2012. Variability of suspended particulate matter in the Bohai sea from the GOCI. Ocean Sci. J. 47(3), 331-345.
Meroni, M., M. Rossini, L. Guanter, L. Alonso, U. Rascher, R. Colombo and J. Moreno, 2009. Remote sensing of solar-induced
chlorophyll fluorescence: Review of methods and applications. Remote Sensing of Environment, 113(10), 2037-2051.
Morel, A. and S. Maritorena, 2001. Bio-optical properties of oceanic waters: A reappraisal.
J.Geophys. Res., 106(C4), 7163-7180.
Morel, A., Y. Huot, B. Gentili,P.J. Werdell, S. B.
Hooker, and B. A. Franz, 2007.
Examining the consistency of 4 products derived from various ocean color sensors in open ocean(Case 1) waters in the perspective of a 5 multi-sensor approach.
Remote Sensing of Environment, 111, 69-88.
Morel, A., D. Antoine, and B. Gentili, 2002.
Bidirectional reflectance of oceanic waters :accounting for Raman emission and varying particle scattering phase function. Appl. Opt.,41(30), 6289-6306.
Nicolas, L. et al., 2012. Assessment of GOCI radiometric products using MERIS, MODIS and field measurements. Ocean Sci. J. 47(3), 287-311.
Park. J.K., J.H. Shim and J.B. Lee, 1998. Long- term variation phytoplankton biomass and implication in the East and South sea of
Korea. The journal of phycology, 13(1), 123-133.
Pradhan, Y., A.V. Thomaskutty, A.S. Rajawat and S. Nayak, 2005. Improved regional algorithm to retrieve total suspended particulate matter using IRS-P4 ocean colour monitor data. Journal of Optics A:
Pure and Applied Optics, 7(7), 343-349.
Schalles, J.F., 2006. Optical remote sensing techniques to estimate phytoplankton chlorophyll a concentration in coastal waters with varying suspended matter and CDOM concentrations. In: Remote Sensing of Aquatic Coastal Ecosystem Processes, edited by Richardson, L.L.
and E.F. LeDrew, Springer, pp.27-79.
Ye et al, 2013 A subsurface chlorophyll a bloom induced by typhoon in the South China sea. Joumal of Marine Systems 128, 138- 145.
Zhang, M., J. Tang, Q. Dong, Q.T. Song and J.
Ding, 2010. Retrieval of total suspended matter concentration in the Yellow and East China Seas from MODIS imagery.
Remote Sensing of Environment, 114(2), 392-403.