ORIGINAL ARTICLE
Kinetics and Thermodynamic Properties Related to the Adsorption of Copper and Zinc onto Zeolite Synthesized from Coal Fly Ash
Chang-Han Lee, Matthew Stanley Ambrosia*
College of Applied Sciences, Catholic University, Pusan, Busan 609-757, Korea
Abstract
Na-A zeolite (Z-Cl) was synthesized from coal fly ash, which is a byproduct of coal combustion for the generation of electricity. The adsorption of Cu2+ and Zn2+ions onto Z-C1 was investigated via batch tests over a range of temperatures (303.15 to 323.15 K). The resultant experimental equilibrium data were compared to theoretical values calculated using model equations. With these results, the kinetics and equilibrium parameters of adsorption were calculated using Lagergren and Langmuir-Freundlich models. The adsorption kinetics revealed that the pseudo second-order kinetic mechanism is predominant. The maximum adsorption capacity (qmax) values were 139.0-197.9 mg Zn2+/g and 75.0-105.1 mg Cu2+/g.
Calculation of the thermodynamic properties revealed that the absorption reactions for both Cu2+and Zn2+ were spontaneous and endothermic. Collectively, these results suggest that the synthesized zeolite, Z-C1, can potentially be used as an adsorbent for metal ion recovery during the treatment of industrial wastewater at high temperatures.
Key words : Coal fly ash, Zeolite, Copper, Zinc, Lagergren, Langmuir, Freundlich, Thermodynamics
1. Introduction1)
Heat generated from coal combustion is used to convert water into steam, which drives electricity generators in power plants. However, this process also creates ash, which is a non-combustible byproduct that comprises approximately 10% of the total mass of the coal and is mostly composed of fine fly ash (74%). In 2013, Korea alone is expected to produce up to 8.3 million tons of coal fly ash (CFA) (Kim and Lee, 2009). There are currently many uses for CFA as raw materials in cement and concrete, structural fill and cover material, and roadway and pavement material and in construction materials as a light- weight aggregate, infiltration barrier, and underground
void filler (Wang and Wu, 2006). However, not all the CFA that is generated is used; the excess is buried in landfills, and requires large quantities of land, water, and energy for its disposal. Furthermore, because of its fine particulate structure and toxic components, CFA is also an increasing environ- mental hazard with respect to air, water, and soil pollution. The development of creative methods to recycle and reuse CFA is necessary to reduce these environmental impacts and benefit other fields.
The increasing demand for nonferrous metal and electroplating processes has led to a concomitant increase in the quantity of wastewater containing toxic heavy metals. These toxins pose serious risks not only to humans but also to the environment.
Received 3 September, 2013; Revised 11 October, 2013;
Accepted 21 October, 2013
*Corresponding author : Matthew Stanley Ambrosia, College of Applied Sciences, Catholic University, Pusan, Busan 609-757, Korea Phone: +82-10-7740-0076
E-mail: [email protected]
ⓒ The Korean Environmental Sciences Society. All rights reserved.
This is an Open-Access article distributed under the terms of the Creative Commons Attribution Non-Commercial License (http://
creativecommons.org/licenses/by-nc/3.0) which permits unrestricted non-commercial use, distribution, and reproduction in any medium, provided the original work is properly cited.
Several processes have been developed to successfully remove heavy metals from metal-laden wastewater, including activated carbon adsorption, chemical flocculation and precipitation, ion-exchange, and flotation (Tchobanoglous et al., 2004). However, most of these methods are ineffective, expensive, and generate secondary pollutants. Therefore, a method that is not only cost-effective but can also be easily applied would be significantly beneficial to society.
Natural zeolites have a high selectivity for many heavy metals and thus have been used for the treatment of mining wastewater under acidic conditions (Wingenfelder et al., 2005). Lee et al. (2000) obtained a variety of zeolites through syntheses under different temperatures and different concentrations of NaOH; these zeolites had better adsorption abilities than both original fly ash and natural zeolites. Later, Lee et al. (2003) conducted experiments using zeolite synthesized from fly ash and analyzed their specific adsorption characteristics towards lead and copper.
Similarly, Hui et al. (2005) used zeolites synthesized from CFA and determined the adsorption efficiencies of Co2+, Cr3+, Cu2+, Ni2+, and Zn2+ ions. Their results show that these zeolites could be used to adsorb and separate metal ions. Apiratikul and Pavasant (2008) calculated the maximum adsorption capacity (qmax) values of Pb2+, Cu2+, and Cd2+ onto the zeolites to be 420.6, 154.4, and 97.8 mg/g, respectively, using Langmuir and Dubinin-Radushkevich isotherms.
Furthermore, a recent study reported that CFA is mainly composed of amorphous aluminosilicate containing α-quartz (SiO2), mullite (2SiO2·3Al2O3), and hematite (α-Fe2O3) and can be reused for the synthesis of zeolites (Tanaka and Fujii, 2009). The adsorption capacity of CFA-based zeolites is significantly dependent on the types of metals being adsorbed, pore structure of the zeolites, and surface charge of the CFA.
In this study, zeolites (Z-C1) were synthesized from CFA, their kinetic mechanisms and adsorption capacities towards Cu2+ and Zn2+ ions were investigated
at different temperatures, and their thermodynamic properties were determined. The adsorption mechanisms were analyzed using Lagergren first- and second- order reaction kinetics and Langmuir and Freundlich equilibrium isotherms and thermodynamic parameters.
2. Materials and methods
2.1. Adsorbents
CFA was obtained from an electrostatic precipitator at the Hanju power plant in Ulsan, South Korea.
Several steps were required to synthesize zeolite from CFA: after fusing a mixture of Na2CO3 (18 g) and CFA (10 g) in a muffle furnace at 800 °C for 1 h, NaAlO2 (5.3 g; Junsei Chemical Reagents, Japan) and deionized water (150 mL) were added, and the mixture was stirred for 0.5 h to form a gel. The gel was then transferred to a polyethylene vessel and stirred at 80 °C for 8 h to produce the final product of Na-A zeolite (Z-Cl). The Z-C1 product was isolated via filtration, washed repeatedly with deionized water, and dried at 105 °C for 2 h.
2.2. Heavy metals
Cu and Zn solutions (~3 mmol/L) were prepared by diluting either reagent-grade Cu(NO3)2·3H2O or Zn(NO3)2·6H2O in deionized water; these solutions were used to investigate dissolution and precipitation as a function of temperature. The pH of the stock solution was maintained at ~3.5 by adding 1 mol/L HNO3 and 1 mol/L NaOH. The Cu and Zn concentrations of a 10 mL aliquot of supernatant were determined via atomic absorption spectrophotometry (Perkin Elmer, AA300) to be 1000 mg/L. The effect of temperature on absorption was investigated at a range of temperatures from 303.15 to 323.15 K.
Solutions for testing the adsorption of Cu and Zn solutions were prepared by diluting the stock solutions with deionized water to 2-20 times their original volume.
2.3. Characterization
X-Ray diffraction (XRD) patterns of CFA and Z-C1 were recorded using a powder diffractometer (XRD:D8 Advance, Bruker AXS) with Cu Kα radiation (λ = 1.54 Å). The accelerating voltage and current used were 40 kV and 40 mA, respectively.
The diffractograms were recorded in the 2θ range of 5-50° in 0.02° steps (3 s per step) with a count time of 15 s at each measurement point for Z-C1.
The chemical compositions of the adsorbents were determined using an X-ray reflective fluorescence spectrometer (XRF, PHILIPS PW2400) equipped with an X-ray generator (3 kW) and fitted with a Rh X-ray tube target. The sample was dried at 105 °C for 28 h, mixed using a blender, and heated to 1000 °C for 5 h to initiate melting. The sample was then heated over a flame to complete the melting process, poured onto a flat disc, and pressed to produce a specimen for analysis.
The surface morphologies of CFA and Z-C1 were analyzed using scanning electron microscopy (SEM, Hitachi S-4200). The samples were coated with a thin layer of platinum and mounted on a copper slab using double-sided tape for the SEM measurements. All metal concentrations were determined using inductively coupled-plasma atomic-emission spectrometry (ICP-AES, Perkin-Elmer 3000 XL).
2.4. Adsorption experiments
Batch experiments were performed in 250 mL Erlenmeyer flasks at 303.15-323.15 K for 120 min with continuous stirring at 130 rpm. A 0.1 g sample of Z-C1 was submerged in 100 mL of the mixed Cu and Zn ion solutions and adjusted to a pH value of 3.5. A 5 mL aliquot of the 100 mL solution was removed at each specified time interval to measure the adsorption equilibrium. The solution was centrifuged for 10 min at 2000 rpm, and the supernatant was removed. The adsorption kinetics and isotherms were studied by preparing samples via the same process
used for the adsorption equilibrium batch experiment;
however, in the kinetics experiment, a sample was removed from the solution at after 5 to 120 min, and in the isotherm experiment, 0.1 g of Z-C1 was submerged in 100 mL of solutions with concentrations ranging from 20.3 to 349.6 mg Cu/L and 21.2 to 383.0 mg Zn/L. The adsorption capacities of Z-Cl for Cu and Zn ions were calculated using the following equation:
( i f)
q V C= −C /M, (1)
where q is the mass of metal ions per gram of adsorbent (mg/g), Ci is the initial metal ion concentration, Ci is the equilibrium metal ion concentration (mmol/L), V is the volume of the aqueous phase (L), and M is the mass (g) of adsorbent.
3. Results and discussion
3.1. Characterization of adsorbents
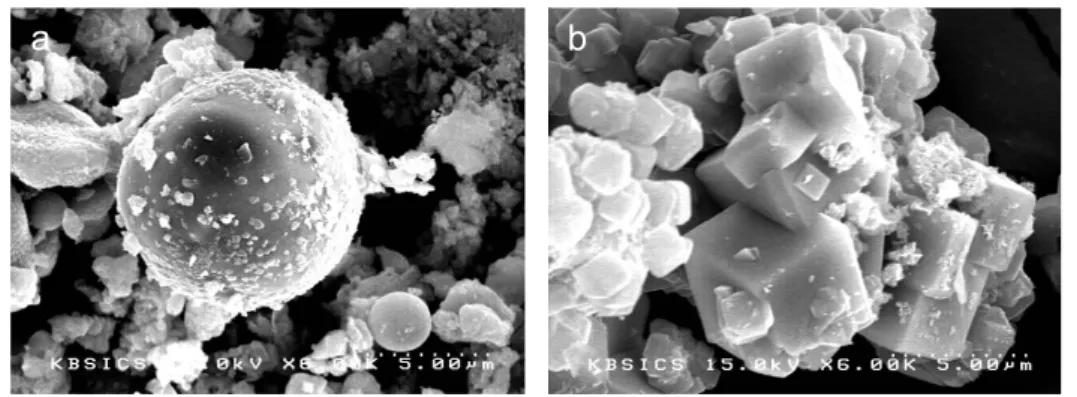
The morphologies of CFA and the synthetic zeolite (Z-C1) were measured by SEM, as shown in Fig. 1.
CFA comprised spherical and amorphous particles, whereas Z-Cl exhibited cube-like particles. To elucidate the crystalline structures of CFA and Z-Cl, XRD patterns of both compounds were analyzed (Fig. 2). CFA was mainly composed of α-quartz (SiO2), mullite (2SiO2·3H2O), and amorphous materials. In contrast, the α-quartz and mullite peaks were not present in the Z-Cl X-ray diffractogram while new peaks appeared at 2θ = 7.18, 10.17, 12.46, 16.11, 20.41, 21.67, 23.99, 26.11, 27.11, 29.94, 30.83, and 32.54°; thus, the synthesized Z-C1 was identified as a Na-A zeolite (i.e., Na12Al12Si12O4827 H2O), as reported by Treacy and Higgins (2001).
a
b
Fig. 1. SEM images of (a) CFA and (b) Z-C1.
Fig. 2. XRD patterns of CFA and Z-C1 (A: Na-A zeolite; C:
Calcite; M: Mullite; Q: Quartz).
3.2. Adsorption kinetics
To investigate the adsorption rates, adsorption kinetic models using pseudo first- and pseudo second- order rate constants were used. Lagergren (1898) applied a pseudo first-order equation to analyze the adsorption of a liquid/solid system based on the capacity of the solid, while Ho and McKay (1999) reported a pseudo second-order equation based on the amount of sorbate adsorbed onto a sorbent. Aksu (2001) investigated the kinetics for dye adsorption using pseudo first- and pseudo second-order rates.
The pseudo first- and pseudo second-order models are shown in equations 2 and 3, respectively.
1,ad( e )
dq k q q
dt = − (2)
2 2,ad( e )
dq k q q
dt = − (3)
In equations 2 and 3, q is the metal-ion adsorption capacity (mg/g), qe is the metal-ion adsorption capacity at equilibrium (mg/g), t is the contact time (min), k is the first-order rate constant (min1,ad −1), and k2,ad is the second-order rate constant (g/mg/min).
The adsorption rate of Cu2+ and Zn2+ ions onto Z-C1 was determined as a function of temperature.
The uptakes of Cu2+ and Zn2+ ions over time at pH 3.5 (~3.0-3.87) at different temperatures are shown in Figs. 3 and 4, respectively. The plots show that the adsorption kinetics of Cu2+ and Zn2+ ions comprises two phases: A rapid phase where adsorption occurred quickly and contributed significantly to the equilibrium uptake and a slow phase whose contribution to the total metal adsorption was relatively small. From the plots, it is evident that the Cu2+ and Zn2+ adsorption equilibriums were reached within 60 and 90 min, respectively. The kinetic parameters for the two kinetic models and correlation coefficients (r2) for Cu2+ and Zn2+ ions were calculated from the linear plots of log(q qe− )versus t and t q/ versus t and are listed in Tables 1 and 2. For Cu2+, the r2 values
Temp
K Ci(mg/L) qe,exp k1,ad qe cal,
r2 k2,ad×103 qe cal,
r2
(mg/g) (1/min) (mg/g) (g/mg/min) (mg/g)
303.15 230.6 41.8 0.0263 34.3 0.9644 0.787 49.7 0.9923
313.15 205.8 56.0 0.0256 33.6 0.9941 1.060 62.2 0.9971
323.15 205.8 70.6 0.540 84.1 0.9054 1.613 84.9 0.9970
Table 1. Kinetic constants for Cu2+ adsorbed onto Z-C1
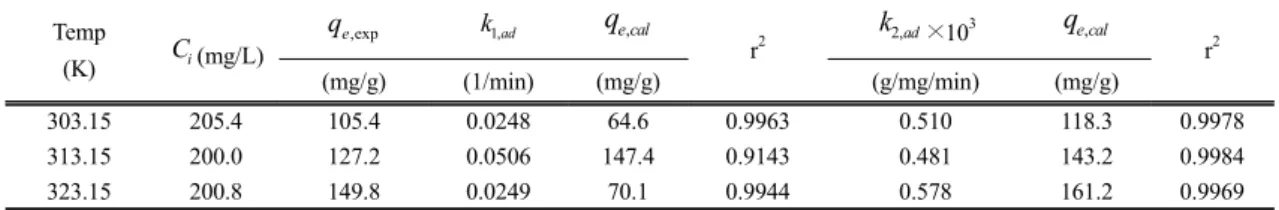
Temp
(K) Ci(mg/L) qe,exp k1,ad qe cal,
r2 k2,ad×103 qe cal,
r2
(mg/g) (1/min) (mg/g) (g/mg/min) (mg/g)
303.15 205.4 105.4 0.0248 64.6 0.9963 0.510 118.3 0.9978
313.15 200.0 127.2 0.0506 147.4 0.9143 0.481 143.2 0.9984
323.15 200.8 149.8 0.0249 70.1 0.9944 0.578 161.2 0.9969
Table 2. Kinetic constants for Zn2+ adsorbed onto Z-C1 (0.9923-0.9971) of the pseudo second-order model were higher for most temperature ranges than those of the pseudo first-order model (0.9054-0.9941). In the case of Zn2+, the r2 values (0.9969-0.9984) of the pseudo second-order model were also higher than those of the pseudo first-order model (0.9963- 0.9143). These values show that the pseudo second- order model best describes the adsorption of both Cu2+ and Zn2+. According to the results of the experiments, the contact time was fixed at 120 min for the remainder of the batch experiments to ensure that equilibrium was reached. The pseudo second- order kinetic model produced a closely fitted curve for Cu2+ and Zn2+. The theoretical values (qcal) were
similar to the experimental data (q ) used in this exp study and were even more consistent after the first 30 min. Hui et al. (2005) suggested that the adsorption rate of heavy metals onto a zeolite, 4A, synthesized from fly ash could be estimated using the pseudo second-order kinetic model, which was more accurate than the pseudo first-order kinetic model. In the Zn2+
adsorption experiment, Na-A zeolite required more time to reach equilibrium than Na-X zeolite, and the adsorption capacities reached equilibrium for all concentrations of solutions within approximately 120 min (Nibou et al., 2010).
t (min)
0 30 60 90 120 150
q (mg/g)
0 50 100 150 200
303.15 K 313.15 K 323.15 K
Fig. 3. Effect of contact time of Cu2+ with Z-C1 at different temperatures. The fitted curves represent the results of the pseudo second-order equation model.
t (min)
0 30 60 90 120 150
q (mg/g)
0 50 100 150 200
303.15 K 313.15 K 323.15 K
Fig. 4. Effect of contact time of Zn2+ with Z-C1 at different temperatures. The fitted curves represent the results of the pseudo second-order equation model.
3.3. Adsorption isotherms
The adsorption isotherm of metal ions at equilibrium is a significant parameter to consider for the design and optimization of adsorption processes.
A study by Motsi et al. (2009) showed that adsorption equilibrium studies provide important information regarding the capacity and affinity of an adsorbent and adsorbate towards different metal ions. Adsorption isotherms are fundamental requirements for the design of processes for the recovery of precious metal ions. To investigate the adsorption capacity of Z-C1 for Cu2+and Zn2+ ions, the experimental data was fit to Langmuir and Freundlich models.
The Langmuir equation is used to model monolayer adsorption onto a surface with a finite number of identical sites and is expressed in the following equation:
max
1
L e e
L e
q K C q = K C
+
, (4)where Ce is the concentration of Cu2+ and Zn2+ at equilibrium (mg/g), q is the maximum amount of max Cu2+ and Zn2+ ions per unit weight of Z-C1 necessary to form a complete monolayer on the surface at high Ce (mg/g), and KL is the Langmuir constant, which is related to the adsorption affinity of binding sites. The values of q and Kmax L can be determined from the linear plot of C qe/ versus Ce.
The Freundlich equation is based on multilayer adsorption on a heterogeneous surface and is expressed in the following equation:
1/ n
e F e
q = K C
, (5)where KF and 1/ n are the Freundlich constants related to the quantity of sorbent and affinity of the binding sites, respectively. The values of KF and 1/ n can be determined from the plot of lnq versus lne C . e
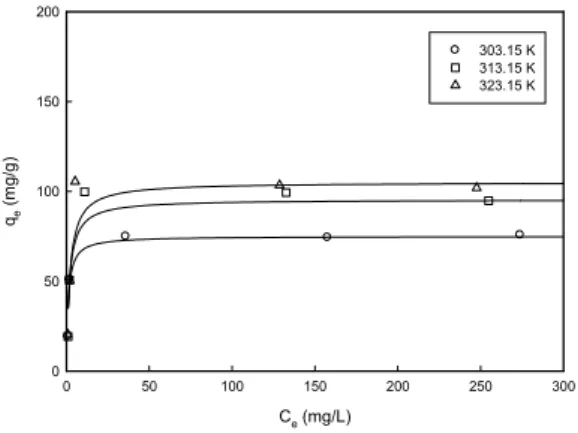
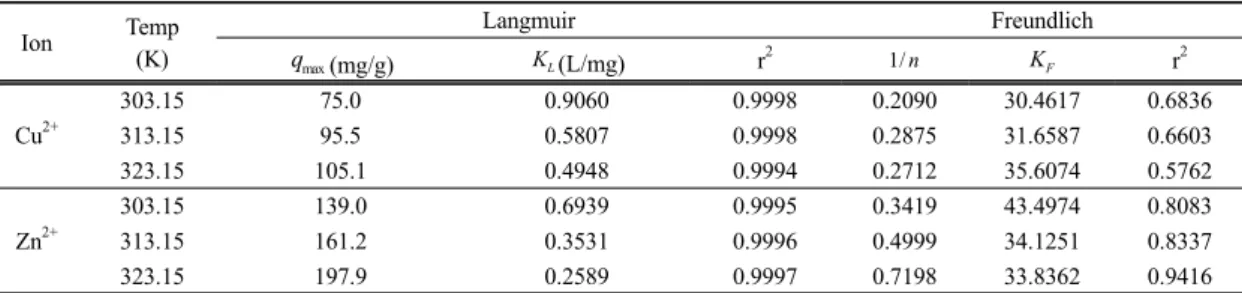
The adsorption isotherms of Cu2+ and Zn2+ ions onto Z-C1 at three different temperatures are shown in Figs. 5 and 6. The model parameters of q , max KL, K , F 1/ n, and r2 obtained from all the isotherms are given in Table 3. The equilibrium models were chosen based on the correlation coefficient (r2) from linear regressions between Ce and qe. For all cases, the Langmuir model is a more accurate representation of the experimental data than the Freundlich model:
The adsorption data was well represented by the Langmuir model with correlation coefficients of 0.9993-0.9998, while the Freundlich model resulted
Ce (mg/L)
0 50 100 150 200 250 300
qe (mg/g)
0 50 100 150 200
303.15 K 313.15 K 323.15 K
Fig. 5. Adsorption isotherms of Cu2+ onto Z-C1 at different temperatures. The fitted curves represent the results of the Langmuir model.
Ce (mg/L)
0 50 100 150 200 250 300
qe (mg/g)
0 50 100 150 200
303.15 K 313.15 K 323.15 K
Fig. 6. Adsorption isotherms of Zn2+ onto Z-C1 at different temperatures. The fitted curves represent the results of the Langmuir model.
Ion Temp (K)
Langmuir Freundlich
qmax(mg/g) K (L/mg)L r2 1/ n KF r2
Cu2+
303.15 75.0 0.9060 0.9998 0.2090 30.4617 0.6836
313.15 95.5 0.5807 0.9998 0.2875 31.6587 0.6603
323.15 105.1 0.4948 0.9994 0.2712 35.6074 0.5762
Zn2+
303.15 139.0 0.6939 0.9995 0.3419 43.4974 0.8083
313.15 161.2 0.3531 0.9996 0.4999 34.1251 0.8337
323.15 197.9 0.2589 0.9997 0.7198 33.8362 0.9416
Table 3. Equilibrium constants for the adsorption of Cu2+ and Zn2+ by Z-C1
in significantly lower correlation coefficients of 0.5762-0.9416. The consistency of the Langmuir model with the experimental data shows that adsorption proceeded with monolayer coverage and/or ion exchange of Cu2+ and Zn2+ in the zeolite pores. The maximum equilibrium adsorption capacities (qmax) of Z-C1 were 139.0-197.9 mg Zn2+/g and 75.0-105.1 mg Cu2+/g: The adsorption affinity of Z-Cl for Zn2+ was greater than that for Cu2+. Qiu and Zheng (2009) also reported that the adsorption isotherm of heavy metal ions with zeolite synthesized from CFA was better represented by the Langmuir model than the Freundlich model; they explained that the adsorption of heavy metal ions occurs via various mechanisms, including physical adsorption and ion-exchange on the SiO− sites of the zeolite. Nascimento et al.
(2009) also reported that heavy metal ions, such as Cu2+, Zn2+, Pb2+, and Mn2+, were well represented by the Langmuir adsorption model, as it represents monolayer coverage onto absorbents, and estimated the adsorption capacity using the Dubinin-Kaganer- Radushkevich (DKR) model, which represents ion- exchange phenomena.
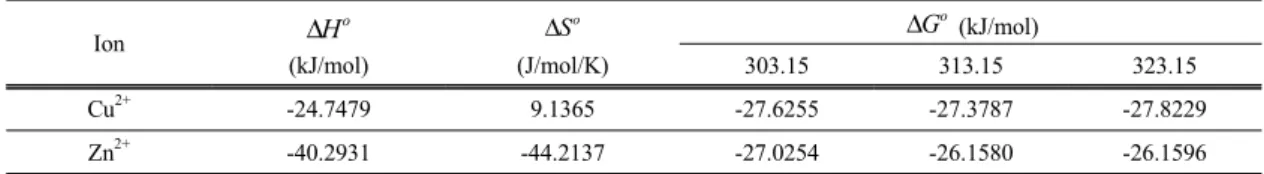
3.4. Thermodynamic parameters
In any adsorption procedure, both energy and entropy should be considered to determine which process will occur spontaneously. The values that depend on temperature are the actual operation parameters for the practical application of a metal recycling process. The amounts of Cu2+ and Zn2+
adsorbed at equilibrium at different temperatures, i.e., 30, 40, and 50 °C, were examined to obtain the thermodynamic parameters of the adsorption system.
KL is the Langmuir constant and its variation with temperature can be used to predict thermodynamic parameters. Accordingly, the enthalpy of adsorption (ΔHo), entropy change (ΔSo), and Gibbs free energy (ΔGo) for the adsorption of Cu2+ and Zn2+ onto Z-C1 were calculated using the following equations:
o ln
G RT KL
Δ = − (6)
ln 1
o o
L
H S
K R T R
Δ Δ
= − + (7)
The values of ΔHoand ΔSo were obtained from the slope and intercept of each plot ( lnK against L
1/T for the two metal ions), which were estimated using
1/T (K-1)
0.0030 0.0031 0.0032 0.0033 0.0034
ln KL
9.0 9.5 10.0 10.5 11.0
Cu2+ ion Zn2+ ion
Fig. 5. Plot of ln KL versus 1/T for the prediction of the thermodynamic parameters of the adsorption of Cu2+ and Zn2+ onto Z-C1.
Ion ΔHo (kJ/mol)
So
Δ (J/mol/K)
Go
Δ (kJ/mol)
303.15 313.15 323.15
Cu2+ -24.7479 9.1365 -27.6255 -27.3787 -27.8229
Zn2+ -40.2931 -44.2137 -27.0254 -26.1580 -26.1596
Table 4. Thermodynamic parameters for the adsorption of Cu2+ and Zn2+ onto Z-C1 as a function of temperature
the least squares method. The values of the thermo- dynamic parameters for the adsorption of Cu2+ and Zn2+ onto Z-C1 are given in Table 4.
The overall Gibbs free energies (ΔGabso ) during adsorption ranged from −27.82 to −27.38 kJ/mol for Cu2+ and −27.03 to −26.16 kJ/mol for Zn2+. All these values are negative, which indicates spontaneous and endothermic Cu2+ and Zn2+ adsorption processes.
4. Conclusions
The Cu2+ and Zn2+ recovery efficiencies using a zeolite (Z-C1) synthesized from CFA were evaluated by adsorption. The adsorption kinetics and equilibrium mechanisms were described to analyze parameters and correlation factors using Lagergren first- and second-order models and Langmuir and Freundlich models. From the experimental data, it was determined that the pseudo second-order kinetic model precisely estimates the adsorption capacity of both Cu2+ and Zn2+ onto Z-C1. The maximum adsorption capacities (qmax) were 139.0-197.9 mg Zn2+/g and 75.0-105.1 mg Cu2+/g. The Langmuir model better fit the experimental data than the Freundlich model. The good agreement of the Langmuir model with the experiment shows that adsorption proceeded with monolayer coverage and/or ion exchange of Cu2+ and Zn2+ in the pores of the zeolite. The thermodynamic properties of the absorption reaction for both Cu2+and Zn2+ were calculated and it was found that the processes were spontaneous and endothermic. These results suggest that CFA, which is an industrial solid waste, can be reused for the synthesis of high-
performance zeolite that is applicable to the recovery of precious metal ions during refining.
References
Aksu, Z., 2001, Equilibrium and kinetic modeling of cadmum(II) biosorption by C. volgaris in a batch system: effect of temperature, Sep. Purif. Tech., 21(3), 285-294.
Apiratikul, R., Pavasant, P., 2008, Sorption of Cu2+, Cd2+, and Pb2+ using modified zeolite from coal fly ash, Chem. Eng. J., 144(2), 245-258.
Ho, Y. S., McKay, G., 1999, Pseudo-second order model for sorption processes, Process Biochem., 34(5), 451-465.
Hui, K. S., Chao, C. Y. H., Kot, S. C., 2005, Removal of mixed heavy metal ions in wastewater by zeolite 4A and residual products from recycled coal fly ash, J.
Hazard. Mat., 127(1-3), 89-101.
Kim, J. K., Lee, H. D., 2009, Effects of step change of heating source on synthesis of zeolite 4A from coal fly ash, J. Indus. & Eng. Chem., 15(5), 736-742.
Langergern, S., 1898, About the theory of so-called adsorption of soluble substances, Kung. Sven.Veten.
Hand., 24, 1-39.
Lee, M. G., Cheon J. K., Kam S. K., Heavy Metal Adsorption Characteristics of Zeolite Synthesized from Fly Ash, J. Ind. Eng. Chem., 2003, 9(2) 174-180.
Lee, M. G., Yi, G., Ahn, B. J., Roddick, F., Conversion of Coal Fly Ash into Zeolite and Heavy Metal Removal Characteristics of the Products, Korean J.
Chem. Eng., 2000, 17(3), 325-331.
Motsi, T., Rowson, N. A., Simmons, M. J. H., 2009, Adsorption of heavy metals from acid mine drainage by natural zeolite, Int. J. Mine. Pro., 92(1-2), 42-48.
Nascimeto, M., Soares, P. S. M., Souza, V. P., 2009,
Adsorption of heavy metal cations using coal fly ash modified by hydrothermal method, Fuel, 88(9), 1714-1719.
Nibou, D., Mekatel, H., Amokrane, S., Barkat, M., Trari, M., 2010, Adsorption of Zn2+ ions onto NaA and NaX zeolites: Kinetic, equilibrium and thermodynamic studies, J. Hazard. Mat., 173(1-3), 637-646.
Qiu, W., Zheng, Y., 2009, Removal of lead, copper, nickel, cobalt, and zinc from water by a cancrinite- type zeolite synthesized from fly ash, Chem. Eng.
J.145(3), 483-488.
Tanaka, H., Fujii, A., 2009, Effect of stirring on the dissolution of coal fly ash and synthesis of pure-form Na-A and -X zeolites by two-step process,
Adv. Powd. Tech., 20(5), 473-479.
Treacy, M. M. J., Higgins J. B., 2001, Collection of Simulated XRD Powder Patterns for Zeolites, Elsevier, Amsterdam.
Wang, S., Wu, H., 2006, Environmental-benign utilisation of fly ash as low-cost adsorbents, J. of Hazar. Mat., 136(3), 482-501.
Tchobanoglous, F., Burton, F. L., Stensel, H. D., 2004, Wastewater Engineering : Treatment and Reuse;
McGraw-Hill, New York, USA.
Wingenfelder, U., Hansen, C., Furrer, G., Schulin, R., 2005, Removal of heavy metals from mine waters by natural zeolites, Environ. Sci. Technol., 39(12), 4606-4613.