• 검색 결과가 없습니다.

Factors Defining Store Atmospherics in Convenience Stores: An Analytical Study of Delhi Malls in India

N/A
N/A
Protected

Academic year: 2021

Share "Factors Defining Store Atmospherics in Convenience Stores: An Analytical Study of Delhi Malls in India"

Copied!
11
0
0

로드 중.... (전체 텍스트 보기)

전체 글

(1)

Abstract

This research paper has been attempted to inventory the at- mospheric factors, contributing to better sales. Exploratory study was undertaken to identify various signs of store atmospherics variables that influence the buying behaviour of buyers.

Thirty-four variables identified from this study were used to cre- ate a structured questionnaire. This questionnaire was then ad- ministered among shoppers in NCR Delhi using non-probability convenience sampling. To determine the atmospheric factors, Principal Component Analysis (PCA) along with Varimax Rotation was attempted. Using principal component factor analy- sis on the data collected, nine factors were identified to have impact on the store atmospheric. These were Querulous, Music, Sensitive, Budget Seeker, Sensuous, Light, Idler, Space seeker and Comfort Seeker. Contrary to the various earlier studies where music, space seeker and comfort seeker were considered to be most significant factors, light and querulous have emerged out to be the major factor that influences the store atmospheric.

This study shows that customers are sensitive, space seekers and sensuous. Constituents of these factors reveal distinct patterns. This research may be used as guidelines for develop- ment and management of shopping malls in emerging countries.

Retail marketers in India can take this cue in designing their strategies to attract consumers.

Keywords: Retail, Shopping malls, Store atmospherics, Factor analysis, Consumer behavior, India.

JEL Classification Codes: M30, M31, M39

* First author, Professor of Marketing, Indian Institute of Management (IIM) [Old Dhamtari Road, Sejbahar, Raipur-492015, Chhattisgarh, India. E-mail: dr.sanjeev.prashar@gmail.com]

** Consultant, FDDI. [A - 10 / A, Sector 24, Gautam Budh Nagar, Noida, Uttar Pradesh 201301, India. E-mail: pran.verma@gmail.com]

*** Corresponding author, FPM Scholar. Indian Institute of Management (IIM) [Old Dhamtari Road, Sejbahar, Raipur-492015, Chhattisgarh, India. E-mail: chandanparsad@gmail.com]

**** FPM Scholar, Indian Institute of Management (IIM) [Old Dhamtari Road, Sejbahar,Raipur-492015, Chhattisgarh, India. E-mail: tsaivijay@gmail.com]

1. Introduction

Retail atmospherics is the combination of all the tangible and intangible elements of a retail a-outlet, controlled and managed by the owner-managers for enriched shopping behaviour of the con- sumer that is favorable to the seller (Eroglu & Machleit, 1989). As defined by Kotler (1973), the concept of atmospherics is defined as "The effort invested to create a desirable buying environment in order to induce specific emotional responses in consumers and ultimately, increase their purchase probability."Store Atmospherics is in what manner the shoppers perceive the store ambiance, which comprises of lighting, store aroma, layout, packaging of product, and music etc. The importance of store atmospherics changes with merchandise category. Generally it is presumed that for fruit, vegetable and food categories, atmospherics doesn’t affect the consumer whereas for consumer durables, apparels, and life- style it does play a vital role (Gandhi et al., 2010). There seems to be some inherent trustworthiness to the stores (Sinha &

Banerjee, 2004). Tangible backed by intangible of the product is important in these categories. In addition to that lighting, store layout, merchandise assortment, background music, class of traf- fic and odor/ store aroma also has an impact on consumer buy- ing behaviour (Chebat & Dube, 2000).

The stores are perceived by consumers in multi-dimensional ways and these aspects vary significantly across the various kinds of store (Sinha & Banerjee, 2004). In light of the fact that so many similar retail stores are coming up in the country, am- bience has become the mainstay of newly opened stores.

Where ambiance shall essentially include lighting, music, store scaping, props and others. An exciting store environment facili- tated the motivational factor(s) for purchase. Motivational factors shall be directed and focused when the buying is compulsory then the ambiance has no meaning. If the buying is undirected and focused it shall be recreational and ambiance has a pos- itive effect (Kaltcheva & Weitz, 2006).

Store atmospherics is central to any retail outlet. A lot of ex- perimental studies have been conducted on individual parame- ters like light, sound, odor and colour etc to study their impact on consumer shopping behaviour. The focus of this paper was to explore the effect of various atmospheric parameters as a whole on the buying behaviour of customers towards a luxury or economy store. A review of literature pertinent to this study Print ISSN: 2288-4637 / Online ISSN 2288-4645

doi: 10.13106/jafeb.2015.vol2.no3.5.

Factors Defining Store Atmospherics in Convenience Stores: An Analytical Study of Delhi Malls in India

1)
Sanjeev Prashar*, Pranay Verma**, Chandan Parsad***, T. Sai Vijay****

[Received: July 17, 2015 Revised: August 4, 2015 Accepted: August 10, 2015]

(2)

was conducted on the various parameters comprising atmospherics. Within a retail environment, atmospherics enhance the retail space. The environment is the whole of individual parts and the atmospherics are individual parts. Display colour is a stimulus for the customer who may in turn respond through their behaviour. A review of the literature reveals that colours confused customers emotionally (Babin, 2003). Displays can make use of colour to create emotions within the customer.

India’s current retail market size is 500 billion USD and it is expected to cross 1.3 trillion USD by 2020 (PWC, 2012).

However, modern retail contributed only 5% of the total retail market size, and it is expected to grow about six times from the 27 billion USD to 220 billion USD, across all categories and segments (PWC, 2012). Arrival of festival and marriage season in the later half of the calendar year make it more active. As a strategy, retail stores continue to focus on improving the am- biance of the store, shifting to economic channels, endorsing more private labels, focus on increasing customer base, dis- counts and offers and sale during non peak hours are some of them.

In India, north and south India lead in terms of mall space, and number of malls (Asipac, 2011). In the north, Delhi-NCR has seen high growth in malls. In south, Chennai and Bangalore lead the race. In the west, Mumbai, Thane and Pune dominate the retail scenario. In east, highest development is seen in Kolkata. Delhi NCR Region has the largest number of – operational malls in the country as per 2010 figures. By 2012, the Delhi-NCR market is going to be the largest supplier of re- tail space, comprising 33% of the national supply.

A study done by the Delhi Government suggests that number of households in Delhi was estimated to be about 36.64 lakh, and out of which 1.12 lakh were in rural and 35.52 lakh in ur- ban areas. The average household size in Delhi worked out to 4.46 persons per household (DES, 2012). Average monthly per capita expenditure of Delhi worked out to Rs. 2811.05. Malls in Delhi-NCR are swarm with shoppers who are residents of the national capital region for shopping. The city has more than 100 shopping malls including the seventh largest in India, Great India Place located in Noida (Asipac, 2011). Regarded as the shopping hub of north India there definitely existed a need to understand and study the shopping behaviour of mall shoppers in Delhi. Since all major brands of the world are present in the various malls of Delhi, it is difficult for consumers to distinguish between two malls on the basis of merchandise, range and brands. In such cases store atmospherics turns out to be the more appropriate and distinguishing factor for shoppers to choose a mall. Store atmospherics is more significant for malls in Delhi as these attract shoppers from higher socio-economic strata who expect higher standards of service and experience as compared to shoppers who visit malls in other cities of India.

2. Literature Review

Several retail outlets offer similar products and services to the

consumers. The competition is not only from outside but also from within as different retail formats. Consumers have multiple criteria for selecting a store. Distance from the store, breadth of merchandise and availability are primary stirring factors in choosing the retail outlet. As per research by Sinha and Banerjee (2004), nearly three-fourth of the participating pop- ulation signified these elements as critical reasons for the se- lection of the store. The next reasons identified were ambience and patronized store both at 8 per cent. Indian consumers are looking forward to the organized retail. With the passage of time, as organized retail evolves, consumers will have exposure to newer formats; new terms will come into play and atmos- pherics emerged as the key differentiator.

Retail environment of the store creates atmospheres that af- fect buying behavior of the shoppers (Kotler, 1973; Donovan &

Rossiter, 1982). Mehrabian and Russells (1974), used Pleasure-Arousal-Dominance (PAD) framework to analysis the impact of store environments on productivity. This frame-work was later used to analyse retail shopping behavior. A significant relationship was found between antecedent factors like the time spent in the store and emotional states, besides the propensity to make a purchase, and satisfaction with the experience (Kellaris & Kent, 1992; Yalch & Spangenberg, 1990).

Individuals judging their emotional states with their behaviour has been proven through a large number of psychological research. However, the contributory role of emotional reactions to atmospheric factors in determining buying behavior remained undefined (Schachter & Singer, 1962).Various scholars have ex- amined the impact of atmospheric factors like crowding, back- ground music, lighting colour and olfactory cues on shopping behaviors (Hui & Bateson, 1991; Yalch & Spangenberg, 1988).

However, Donovan and Rossiter (1982) hypothesized the effect of pleasure, excitement and dominance as factors of retail envi- ronments that influence purchasing behavior.

Environmental factors such as; aroma, lights, music, colors, crowds, safety and sales employees will affect shoppers shop- ping habits, these factors are termed as atmospherics.

Manipulation in the atmospherics factor is significantly impacting the mood of the customer (Cheng, 2009). A prospective custom- er stays in a positive store environment longer, the more spends time in a store, more they are likely to purchase. Loyal customers are created due to positive store environment whose repeat shopping purchasing behaviour is accelerated (Bagdare, 2013). The influence of retail store atmospherics has received modest attention although it is acknowledged as an important element in determining the store image (Lindquist,1974).

Shoppers evaluate information presented to them when ex-

posed to a stimuli in the retail environment, which may affects

their attitude toward the obtain information. Lunardo (2012) study

suggests that ambient scent or retail aroma may be perceived

by consumers as a trick used by shoppers to influence them to

purchase more which helps the retailers achieve their corporate

goals. Other than aroma elements like weather, employee uni-

form and merchandise display create a positive feeling amongst

customers. A luxery store must have stylish fixtures and furnish-

ings along with well dress knowledgeable sales representative

(3)

that persuade a consumer for purchase (Kiran, 2012). Milliman (1982) and Yalch and Spangenberg (1988) observed through in depth studies that music is an important atmospheric factor. The effect of music is varies with its dimensions like as tempo or speed at which beat progresses, volume and texture of the mu- sic on cognitive and emotional processes of the individual (Bruner, 1990).

A loud music speed up the movement of the shoppers in around a store hence, consumer spent less time in a super- market (Milliman, 1982). Milliman (1986), study reveals that fast music in a restaurant encourage the individual to spent less time at their tables as compare to dining under the slow tempo condition. Consumers will spend more time when they are lis- tening to unfamiliar music where as individuals reported shop- ping longer when listening to familiar music (Yalch &

Spangenberg, 1990).

Areni and Kim (1994) study reveals that customers examining and handling time increased under bright lighting as compare to soft lighting. Increased levels of lighting result in arousal and pleasure and the approach behaviour of customers is positive (Mehrabian, 1976). Aroma or Fragrance used by the retailers to influence buying behaviour of the shoppers that leads the con- sumers to develop a holistic view of the store. Daucé (2000) study shows the aroma or scents have positive effect on he- donic behavioral of consumer. Soft light with warm colour are helps to attract the customers for luxury goods on the other side bright light are more work for discount store (Baker &

Grewal,1992; Schlosser, 1998). Valdez and Mehrabian (1994) show consumer feel more positive in the blue colour environ- ments than warm-colored.

Good interior designs of a store enhance the customer inter- est and lower their psychological barrier for purchasing (Davies

&Ward, 2002; Omar, 1999; Walters &White, 1987). Globally, consumers select the retail store on the base of store design and its merchandising display (Kerfoot et al., 2003). Many con- sumer feels shopping is a leisure activity and they select a store on the bases of its entertainment value (Woodside et al.,1992).

3. Research Objectives

A pleasant store atmospherics can be created in malls if mall manager philosophy and practices are perfectly aligned with the purchaser expectations. For doing so, it is necessary to under- stand the meaning and composition of store atmospherics.

Present research aims at finding the factors defining store at- mospherics for mall shoppers in Delhi. This research has follow- ing objectives:

1. To determine the composition of atmospherics for the malls in Delhi

2. Understanding relationship between various factors

3. Suggest strategies to better the store atmospherics in Delhi malls

4. Research Methodology

This study was divided into two parts like as cross-sectional research design. In the first part secondary data was used for identify the various dimensions of store atmospherics. This ex- ploratory research phase give structured questionnaire, which used for data collection in the conclusive research phase. The study pertained to the most growing hubs of retail i.e. Delhi -NCR which include the fastest growing town Gurgaon, Faridabad, Noida and Ghaziabad besides Delhi. A sampling ele- ment was an individual shopper who visits the mall for shopping while the sampling unit for the study would be shopping malls from where the elements are to be drawn. The extent to which people included in the sample can be expressed as persons carrying a minimum of one shopping bag in their hands while coming out of a store in the mall. Non-probabilistic quota sam- pling method was used in this study. The malls selected for this research were similar in terms of size, age and tenant-mix.

4.1. Data Analysis and Interpretation

Profile of consumers was developed by demographic in- formation obtain from questionnaire. Data relating to mall attrib- utes was subjected to data reduction with the help of Factor Analysis using SPSS 16. The factor analysis reduced a large number of elements into factors.

4.2. Profile of Respondents

Sample depicted the composition of working population in Delhi as it comprised predominantly of males. 88% of re- spondents were in the economically productive age group 20 years 50 years with majority (59.5%) of them being in the – prime of their youth i.e. 20 years 35 years. More than half the – population was married (but not necessarily accompanied by the spouse during data collection). Half the respondents were graduates. 29% of respondents were either postgraduates or having a higher qualification. Respondents with an only school education or professional education constituted a minor fraction of the total sample with 7.5% and 13.5%respectively.

Understandably more than half the sample (54.5) was employed with the private sector, while the remaining proportion of the sample was divided between four occupations. Sample was evenly spread in terms of income distribution with all income categories contributing to a significant proportion to the sample (Appendix A).

4.3. Factor Output

Data was checked for suitability for factor analysis with the help of correlation analysis, KMO test of sampling adequacy and Bartlett’s test of sphericity (Boyd et al., 2002; Malhotra, 2004). Most variables had significant correlation between them.

Both KMO test of sampling adequacy value and Bartlett’s test

(4)

of sphericity value were found adequate (Appendix B).

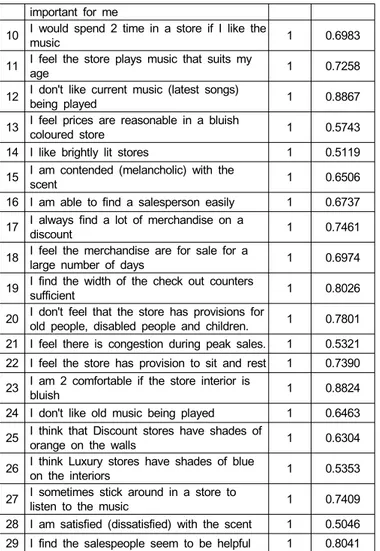
However, when data was subjected to principal component analysis (PCA), the communality value of some of the variables was less than 0.5 (Appendix C). Those variables also had an insignificant factor loadings. For refining result variables with lesser communality values were deleted following an iterative procedure. After six iterations resulting in a deletion of five vari- ables optimum output was obtained. This data set was checked for suitability for factor analysis (Appendix D). The next step was to find the total variances. Nine factors would contribute 73.37 % of the total variance (Table 1). Relevant factor loadings for each variable indicated that all the variables were adequately explained by derived factors. The component matrix was rotated and in eleven iterations, it was confirmed that nine factors were responsible for the twenty nine variables. Varimax rotation was the employed method (Appendix E).

<Table 1> Total Variance Explained for Twenty-Nine Variable Problem Component

Initial Eigenvalues Rotation Sums of Squared Loadings Total % of

Variance Cumulative

% Total % of

Variance Cumulative

%

1 4.64 15.99 15.99 3.02 10.41 10.41

2 3.61 12.46 28.45 2.95 10.17 20.58

3 2.75 9.48 37.93 2.72 9.38 29.96

4 2.4 8.26 46.19 2.71 9.36 39.32

5 2.05 7.06 53.24 2.61 8.98 48.31

6 1.87 6.43 59.68 2.28 7.86 56.16

7 1.47 5.06 64.73 1.82 6.29 62.45

8 1.37 4.72 69.45 1.59 5.48 67.93

9 1.14 3.92 73.37 1.58 5.44 73.37

Factor output comprised of nine factors representing specific forces shaping store atmospherics in Delhi malls. These are presented in the Table 2. These given statements were con- densed to a set of nine factors. These factors represented spe- cific forces that influence store atmospherics. These are pre- sented in the table given below.

<Table 2> Consolidated Factor Output

Factors Items Factor

Loading

Average Score/

Factor Rank

Querulous (10.41%)

I linger for a longer duration in a brightly illuminated store (3.82)

I dont feel that the store has provisions for old people, disabled people and children (4.07)

I don't like old music being

0.8727 0.7801

0.6463

3.44 II

played (2.58)

The scent makes me happy

(unhappy) (3.27) 0.8727

Music (10.17%)

I feel at ease when the music being played is of my choice (3.53)

I leave the store when music being played is not of my choice (1.73)

Because of the scent, I buy things that I don't require (1.82)

I am drawn to a store that plays music of my choice (2.46)

I am satisfied (dissatisfied) with the scent (2.64)

I feel the store plays music that suits my age (2.43)

0.7801 0.9034 0.8912 0.8952

0.5046 0.7258

2.44 IX

Sensitive (9.38%)

I don't like current music (latest songs) being played (2.00) I find the salespeople seem to be helpful (3.58)

I believe that music reinforces the image of the store (3.93)

0.8867 0.8041 0.9292

3.17 IV

Budget Seeker (9.36%)

I always find a lot of

merchandise on discount (3.25) I feel the merchandise are for sale for a large number of days (3.38)

I find the width of check out counters sufficient (2.99)

0.7461 0.6974 0.8026

3.21 III

Sensuous (8.98%)

I am comfortable if the store interior is bluish (1.82) I sometimes stick around in a store to listen to the music.

(3.18)

Right kind of music being played is important for me (2.74)

I think that Discount stores have shades of orange on the walls (2.89)

0.8824 0.7409 0.6433 0.8824

2.66 VII

Light (7.86%)

I shop less in a store when the area is dark (3.59) I like brightly lit stores (3.8)

0.7927

0.5119 3.7 I

Idler (6.29%)

I am able to find a salesperson easily (2.85) I am contended (melancholic) with the scent (2.55) I would spend time in a store if I like the music (2.77)

0.6737 0.6506 0.6983

2.72 VI

Space seeker (5.48%)

I feel there is congestion during peak sales. (4.29) I feel prices are reasonable in a bluish coloured store (1.9)

0.5321

0.5743 3.1 V

Comfort Seeker (5.44%)

I feel the store has provision to sit and rest (2.46) I think luxury stores have shades of blue on the interiors (2.82)

0.7390

0.5353 2.64 VIII

(5)

Ranking of Factors

Relative significance of factors is judged by ranking of factors which in turn is assessed calculating average score per factor.

The results presented in the above table indicate that light was the most desirable factor (average score 3.7). Another factor very relevant to shoppers was being querulous (average score 3.44) Budget Seeker and sensitive were ranked third and fourth.

Music was the least significant factor with score of just 2.44.

4.4. Validity and Reliability of Factor Output

Validity and reliability of factor output was checked statistically. Reliability was established by estimating Cronbach’s Alpha for each factor. Alpha value for all the factors was great- er than 0.6indicating the output to be reliable. Convergent val- idity for a factor indicates that all variables constituting a single factor actually converge into it i.e. they share a high proportion of variance in common. With the aid of ‘Variance Extracted (VE)’ convergent validity was checked. VE is calculated by add- ing squared factor loadings of all variables constituting a factor and then dividing it by number of variables (Appendix F).

Discriminant validity establishes that the factors extracted are truly distinct from each other. It is established by observing fac- tor loading for each variable under all factors. Final factor output showed that there was a complete absence of cross loading.

5. Discussion

Outcomes of this study validate the notion that store atmos- pherics is an interplay of a number of factors. For providing su- perior store atmospherics, one should take an integrated view of the situations and work on multi pronged strategies. These strat- egies may be designed in light of following observations made in this research:

This study revealed that store atmospherics comprise of nine factors: sensitive, budget seeker, space seeker, music, queru- lous, idler, sensuous, pleasure seeker and relaxer. Store atmos- pherics in a mall is a cumulative impact of service(s) offered under each factor. It means that shopping malls can offer unique and differentiated store atmospherics to their shoppers by carefully selecting facilities and services under each factor.

This selection would depend upon customer preferences and competitive environment.

Though store atmospherics comprises of nine factors, all of them do not contribute equally to it. Average score per factor is a good indicator of significance attached by shoppers to each of these factors. In this study, average score per factor ranged from 3.7 to 2.44. It means mall developers and managers need not emphasize all the factors simultaneously. It is important to know this as each decision aimed at improving atmospherics re- lated to a factor would require commitment of resources. Since resources carry cost it is important to identify activities/ deci- sions related to the most relevant factor so that resources can be optimally allocated.

Present study reflected that light is the most significant factor for shoppers in terms of store atmospherics. It was followed by querulous, budget seeker and sensitive. It is not a big surprise that budget seeker emerged as the number two factor since Delhi has an actively set of people who are very choosy and perceive that there is a lot of merchandise on sale and for a lengthy period of time. Since these mall shoppers have time they are idlers and seek pleasure and relaxation when they visit a mall.

When compared with similar studies conducted in different parts of the world, number and labelling of factors was ex- pected to be more or less similar as core human needs are common across geographies and cultures. However, similarity ends here only. Different cultures, economies and geographies might select different means or solutions to gratify the same need. In this context it is very important to look into the compo- sition of individual factors (in terms of its constituent variables) and also weight age assigned to these factors and/or variables.

Since the target population comprises of mid to high income, most of them are high on education, awareness and con- nectivity with the world, they are expected to have a higher lev- el of expectations from shopping malls. It is because they have global benchmarks to compare with.

Light is the foremost factor defining store atmospherics for shoppers in Delhi. People who visit these malls look for illumi- nated stores. It is important for mall developers and managers to ensure their selection of atmospheric factors is such that shoppers feel excited about visiting malls. A significant aspect of it is that Delhi malls need to communicate to the audience spread over a much wider geography as compared to malls elsewhere in the world as the catchment area of Delhi malls is not confined to the city of Delhi.

6. Managerial Implication

The results of this study are quite similar to the conclusions of many other similar researches that have posited that store at- mospheric will influence consumers’perception about their experi- ence, trust, assurance, etc. in retail outlet (Schlosser, 1998).

This paper provides a new insight to the retail shops managers for formulating strategies to improve the mall atmospheric. This study provides solution to various important questions such as why the shoppers prefer one specific shop for shopping. An amalgamation of the atmospheric factors can enhance shop- pers’choice behavior and helps the retailers for making a im- plementing an appropriate marketing strategy. Budget seeker and space seeker approach are use by the retailers to attract the shoppers (Tai & Fung, 1997). This study provides catego- rization of store atmospherics for a retail store, citing factors that retailers should be aware of while designing a store. It can help a retailer in creating a competitive strategy.

Past studies have posited that lighting, scent, music, colour,

layouts are the vital elements for store atmospherics, and thus

managerial inferences have highlighted the need to create

(6)

pleasing store atmospherics. The findings of this research study, indicate that beside light, scent, music, colour, etc., consumers also look for the economical price of the product, space, relaxa- tion, idling space to purchase at the convenience store. Creating such an ambience that match the consumer’s desired expect- ations are suggested to enhance customer satisfaction.

While designing a store for customers, it is necessary to keep in mind the hedonic factors that attract customers. In Delhi region, a convenience store is perceived as a budget store. It is much more so in the context of inflatory rises. However, it is paradoxical that while it appeals as a budget store, it should have space for the customer. These are opposites and therefore a trade off would come. In addition to space, the customer would also look for pleasure which would add to the costs. So the implication of store atmospherics is manifold and with in- corporation of each additional factor, both the design and costs may be prohibitive. There are certain implementations which needs to be done in short term and other implementations which have long term effect.

Changes which can be implemented easily are short term implications. Music can be changed easily as it does not impact the existing infrastructure. Aroma can be also changed easily though changing it is relatively difficult compared to changing the music. Right combination of fragrance /aroma and music en- hance purchase shopping experience and also leads to custom- ers to spend more time in the store. Appropriate scent and mu- sic may inspire shoppers to engage in impulse buying.

However, music can also be associated with the promotional events for attracting the shoppers (Alpert & Mark, 1990; Areni &

Kim, 1993). Specific scent or aroma and music style perceived as harmonious for the retail outlets as a whole. Retailers can use artificial sensory cues such as lighting, music and aroma as tools to enhance the store environment to influence the shop- pers’product quality perceive. An artificial fragrance of fresh food in a supermarket is influence the consumer choice behaviour similarly; smells of leather in leather shop make consumers be- lieve leather is actually authentic leather. This could lead to positive, attitudinal and relational responses of buying. This can help retailers differentiate themselves from competitors

Changes which have far reaching outcomes and affect the in- frastructure can be said to be long term. Lighting is one such thing. The intensity of light creates an expected perception of spaciousness in the store. Lowering the intensity of light bellow the threshold level, could result in consistent perceptions of spa- ciousness in the physical space while increasing the intensity of light above the threshold level, could result in perceptions that store is not spacious. Working on the intensity would mean changing the existing infrastructure which cannot be done with- out disturbing the store. Hence it has to be thought of carefully before going any further. Low intensity lighting on window dis- play can give a sense of space to the store.

Changing the colour would impact the company's image.

Colours affect customers emotionally supports the finding of Crowley (1993). Red, Orange and Yellow are colours of long wavelength and considered to be warm. Green and blue are of short wavelength and considered to be cool. Colour stimuli are

characterized in terms of hue (wavelength), brightness (black to white), and saturation/ vividness (Bellizzi & Robert, 1992). Red and orange have been classified as exciting, blue for calmness and green for tranquility. Layout changes also have long term implications. The choice of proper color and lighting in a retail store is a difficult question and it is better it always consider it with other factors. Another important managerial implication would be to the visual merchandising team. Visual Merchandising is an integral part of a retail organization. If these reports are given to them, they can definitely use it for their displays and store scaping.

Any change made in the store atmospherics must enhance the coherence of the store environment. Store atmospherics has several dimensions: light, colour, music, scent, colour, layout, etc. They are related to the five senses. The most easily changeable elements are the music and scent. Because they can easily be modified, retailers must ensure that they are con- stantly in accordance with each other. They must also be chosen in accordance with their other strategies.

7. Limitations of the Study

This research is transversal in nature and results are prone to the impact of time. The longitudinal research with a series of data sets collected after a regular interval would insulate the im- pact of time. Size of the sample is sufficient to overcome the statistical objections, but is still very small as compared to the total population. Another limitation of this study is that results are based on the assumption that the sample is a monolith whereas different segments within it may exhibit different preferences. It was not done, the division of this sample into subsamples (age-wise, gender-wise, income-wise) would have further reduced number of observations (respondents) under each sub-segment. However, it is possible to address this issue with a larger sample and/or adopting the quota sampling. It would be interesting to identify similarities/dissimilarities between genders, age-groups and income segments.

Looking beyond composition of the store atmospherics for a single geographic or cultural market, it would be useful to col- lect a sample cutting across geographic or cultural boundaries.

Such a study would help in highlighting differences between two markets and also point at possible sources/reasons for such differences. For single market studies, deeper insight can be ob- tained by studying differences along demographic parameters of respondents like age, gender, income, occupation, etc. Such a study would help practitioners in devising segment specific strategies.

8. Conclusion

Results of study reveal interesting patterns in terms of com-

position of store atmospherics. Results can be used by mall de-

velopers and mall managers to make sure that they are able to

(7)

provide superior store atmospherics to their shoppers. It is all the more important for Delhi as it attracts shoppers from all across the capital region. However, as time progresses, more and more towns shall have world class malls. In that scenario, some of the shoppers may satisfy their urge by visiting the newly constructed world class malls in their own towns or they may prefer some other shopping destination. So Delhi malls need to reinvent themselves in terms of elements of store at- mospherics so as to keep themselves relevant in the eyes of their target group.

References

Alpert, J. I., & Alpert, M. I. (1990). Music influences on mood and purchase intentions. Psychology & Marketing, 7(2), 109-133.

Areni, C. S., & Kim, D. (1993). The influence of background music on shopping behavior: classical versus top-forty music in a wine store. Advances in Consumer Research, 20(1), 336-340.

Areni, C., & Kim, D. (1994). The Influence of In-store Lighting on Consumers’ Examination of Merchandise in a Wine Store. International Journal of Research in Marketing, 11 (2), 117-125.

ASIPAC. (2011, September). Mumbai Metropolitan Region:

Demand and Supply of Mall Space in India. India:

Bangalore.

Babin, B. J., Hardesty, D. M., & Suter, T. A. (2003). Color and shopping intentions: the intervening effect of price fair- ness and perceived affect. Journal of Business Research, 56(7), 541-551.

Bagdare, S., & Jain, R. (2013). Measuring retail customer experience. International Journal of Retail & Distribution Management, 41(10), 790-804.

Baker, J., & Grewal, D. (1992). An experimental approach to making retail store environmental decisions. Journal of Retailing, 68(4), 445-460.

Bellizzi, J. A., & Hite, R. E. (1992). Environmental color, con- sumer feelings, and purchase likelihood. Psychology and Marketing, 9(5), 347-363

Boyd, H. W., Westfall, R., & Stasch, S. F. (2002). Marketing Research-Text and Cases (7th Ed). New Delhi: AITBS.

Bruner, G. C. (1990). Music, mood, and marketing. Journal of Marketing, 94-104.

Cheng, F. F., Chin, S. W., & Yen, D. C. (2009). The effect of online store atmosphere on consumer’s emotional re- sponses: an experimental study of music and colour.

Behaviour and Information Technology, 28(4), 323-334 Crowley, A. E. (1993). The two-dimensional impact of color on

shopping. Marketing Letter, 4(1), 59 69. –

Daucé B. (2000). La diffusion de senteurs d’ambiance au sein d’un lieu commercial: les premiers résultats d’une étude menée au sein d’un magasin de prêt-à-porter, XVIème congrès international de l’Association Française du

Marketing. Montréal, Tome, 2, 747-756.

Davies, B. J., & Ward, P. (2002). Managing retail consumption.

New York, NY: Wiley.

Directorate of Economic & Statistics (2012, August). Level and Pattern of Household consumer expenditure in Delhi.

Retrieved July 29, 2014 from,

http://www.delhi.gov.in/wps/wcm/connect/28710300455ad3ed98c 9fb2986e51434/final+68th+round+consumer+expenditure+report +pdf.pdf?MOD=AJPERES&lmod=1122612245&CACHEID=2871 0300455ad3ed98c9fb2986e51434

Donovan, R. J., & Rossiter, J. R. (1982). Store Atmosphere: An Environmental Psychology Approach. Journal of Retailing, 58(1), 34-57.

Eroglu, S. A., & Machleit, K. A. (1989). Atmospheric factors in retail environment. Advances in Consumer Research, 20 (1), 34-56.

Gandhi, R. K., Gobiraj, V., & Balasundaram, N. (2010).

Determinants of customer loyalty in leading retail super markets in United Kingdom: An exploratory study. SRM Management Digest, 8, 95- 106.

Hui, M. K., & Bateson, J. E. G. (1991). Perceived Control and the Effects of Crowding and Consumer Choice on the Service Experience. Journal of Consumer Research, 18(1), 174-184.

Chebat, J. C., & Dubé, L. (2000). Evolution and Challenges Facing Retail Atmospherics: The Apprentice Sorcerer Is Dying. Journal of Business Research, 49(2), 89-90.

Kaltcheva, V. D., & Weitz, B. A. (2006). When should a retailer create an exciting store environment?. Journal of Marketing, 70(1), 107-118.

Kellaris, J. J., & Kent, R. J. (1992). The Influence of Music on Consumers’ Temporal Perceptions: Does Time Fly When You’re Having Fun?. Journal of Consumer Psychology, 1(4), 365-376.

Kerfoot, S., Davies, B., & Ward, P. (2003). Visual merchandising and the creation of discernible retail brands. International Journal of Retail & Distribution Management, 31(3), 143-152.

Kiran, V., Majumdar, M., & Kishore, K. (2012). Innovation in in- store promotions: effects on consumer purchase decision.

European Journal of Business and Management, 4(9), 36- 44.

Kotler, P (1973). Atmosphere as a Marketing Tool. Journal of Retailing, 49(4), 48-64.

Lindquist, J. D. (1974). Meaning of Image. Journal of Retailing, 50(1), 8 – 38.

Malhotra, N. (2004). Marketing Research - An Applied Orientation (4th Ed). New Delhi: Pearson Education India.

Mehrabian, A. (1976). Public places and private spaces: the psychology of work, play, and living environments. New York: Basic Books.

Mehrabian, A., & Russell, J. A. (1974). An approach to environ- mental psychology. Cambridge, MA: the MIT Press.

Milliman, R. E. (1982). Using Background Music to Affect the

Behavior of Supermarket Shoppers. Journal of Marketing,

46, 86-91.

(8)

Milliman, R. E. (1986). The Influence of Background Music on the Behavior of Restaurant Patrons. Journal of Consumer Research, 13, 286-289.

Omar, O. (1999). Retail Marketing. Pitman Publishing: London Pearson Education.

Sinha, P. K., & Banerjee, A. (2004). Store choice behaviour in an evolving market. International Journal of Retail &

Distribution Management, 32(10), 482-494.

Pricewater House Report (2012, September), The Indian Kaleidoscope: Emerging trends in retail. Retrieved July 29, 2014, from https://www.pwc.in/en_IN/in/assets/pdfs/in- dustries/retail-and-consumer/retail-report-300812.pdf Lunardo, R. (2012). Negative effects of ambient scents on con-

sumers’ skepticism about retailer’s motives. Journal of Retailing and Consumer Services, 19(2), 179-185.

Schlosser, A. E. (1998). Applying the functional theory of atti- tudes to understanding the influence of store atmosphere on store inferences. Journal Consumer Psychology, 7, 345 369. –

Schachter, S., & Singer, J. E. (1962). Cognitive, Social and Physiological determinants of emotional state. Psychology Review, 69, 379-399.

Tai, S. H., & Fung, A. M. (1997). Application of an environ- mental psychology model to in-store buying behaviour.

The International Review of Retail, Distribution and Consumer Research, 7(4), 311-337.

Valdez, P., & Mehrabian, A. (1994). Effects of color on emotion.

Journal Psychology, 123(4), 394 409. –

Walters, D., & White, D. (1987). Retail Marketing Management.

Basingstock: Macmillan Press.

Woodside, A. G., Trappery, R. J., & Randolph, J. (1992).

Finding out why customers shop your store and buy your brand: automatic cognitive processing models of primary choice. Journal of Advertising Research, 1(1), 59-78.

Yalch, R., & Spangenberg, E. (1990). Effects of Store Music on Shopping Behavior. Journal of Consumer Marketing, 7,55-63.

Yalch, R. F., & Spangenberg, E. (1988). An environmental psy-

chological study of foreground and background music as

retail atmospheric factors. In AMA educators’ conference

proceedings (Vol. 54, pp. 106-110). Chicago: American

Marketing Association.

(9)

Appendix A

Table: The Profile of the Respondents

Profile of the Respondents

Marital Status Qualification Married Unmarried Schooling Graduate Post

Graduate

Gender Male 90 150 60 150 30

Female 30 60 30 60 0

Total 120 210 90 210 30

Appendix B

Table: KMO and Bartlett’s Test of Sphericity

KMO and Bartlett's Test

Kaiser-Meyer-Olkin Measure of Sampling Adequacy. 0.4848 Bartlett's Test of Sphericity Approx. Chi-Square 6396.44

df 406

Sig. 0.0000

Appendix C

Table: Initial Communality Values

Appendix D

Table: Final Communality Values Communalities

Initial Extraction 1 Because of the scent, I buy things that I don't require 1 0.9366 2 I believe that music reinforces the image of the store 1 0.8699 3 The scent makes me happy. (unhappy) 1 0.8818 4 I linger for a longer duration in a brightly illuminated store 1 0.8769 5 I leave the store when music being played is not of my choice 1 0.9239 6 I find the product 2 attractive than it is, because of the scent 1 0.3272 7 I feel at ease when the music being played is of my choice 1 0.7313 8 I am drawn to a store that plays music of my choice 1 0.8836 9 I shop less in a store when the area is dark 1 0.7600 10 Right kind of music being played is important for me. 1 0.6271 11 I would spend 2 time in a store if I like the music. 1 0.6856

12 I sometimes stick around in a store to listen to the music 1 0.6842 13 I find the salespeople seem to be helpful. 1 0.7462 14 I am satisfied (dissatisfied) with the scent 1 0.4041 15 I feel the store plays music that suits my age 1 0.7218 16 I don't like current music (the latest songs) being played. 1 0.8969 17 I feel prices are reasonable in a bluish coloured store 1 0.6343

18 I like brightly lit stores. 1 0.4226

19 I would like to listen to music that is popular in my generation. 1 0.5088 20 I am contended (melancholic) with the scent 1 0.6477 21 Well lighted stores uplift my mood 1 0.4030 22 I am able to find a salesperson easily 1 0.5871 23 I find the sales people seem to be friendly. 1 0.5270 24 I always find a lot of merchandise on a discount 1 0.7764 25 I feel the merchandise are for sale for a large number of days 1 0.6989 26 I find the width of check out counters sufficient 1 0.7997 27 I dont feel that the store has provisions for old people, disabled people and children 1 0.8051 28 I feel there is congestion during peak sales 1 0.4934 29 I feel the store has provision to sit and rest 1 0.7131 30 I am 2 comfortable if the store interior is bluish 1 0.8589 31 I don't like old music being played 1 0.6265 32 I think that Discount stores have shades of orange on the walls 1 0.6819 33 I think Luxury stores have shades of blue on the interiors 1 0.5246 34 I am annoyed (pleased) with the scent 1 0.4486

Final Communalities

Initial Extraction 1 Because of the scent, I buy things that I don't require 1 0.8912

2 I believe that music reinforces the image of the store 1 0.9292

3 The scent makes me happy (unhappy) 1 0.8727

4 I linger for a longer duration in a brightly illuminated store 1 0.8787

5 I leave the store when music being played is not of my choice 1 0.9034

6 I feel at ease when the music being played is of my choice 1 0.7081

7 I am drawn to a store that plays music of my choice 1 0.8952

8 I shop less in a store when the area is dark 1 0.7927

9 Right kind of music being played is 1 0.6433

(10)

Appendix E

Table : Rotated Component Matrix important for me

10 I would spend 2 time in a store if I like the music 1 0.6983 11 I feel the store plays music that suits my age 1 0.7258 12 I don't like current music (latest songs) being played 1 0.8867

13 I feel prices are reasonable in a bluish coloured store 1 0.5743

14 I like brightly lit stores 1 0.5119

15 I am contended (melancholic) with the scent 1 0.6506 16 I am able to find a salesperson easily 1 0.6737 17 I always find a lot of merchandise on a discount 1 0.7461 18 I feel the merchandise are for sale for a large number of days 1 0.6974 19 I find the width of the check out counters sufficient 1 0.8026

20 I don't feel that the store has provisions for old people, disabled people and children. 1 0.7801 21 I feel there is congestion during peak sales. 1 0.5321 22 I feel the store has provision to sit and rest 1 0.7390 23 I am 2 comfortable if the store interior is bluish 1 0.8824 24 I don't like old music being played 1 0.6463 25 I think that Discount stores have shades of orange on the walls 1 0.6304 26 I think Luxury stores have shades of blue on the interiors 1 0.5353 27 I sometimes stick around in a store to listen to the music 1 0.7409 28 I am satisfied (dissatisfied) with the scent 1 0.5046 29 I find the salespeople seem to be helpful 1 0.8041

Rotated Component Matrix

a

Component

1 2 3 4 5 6 7 8 9

I linger for a longer duration in a brightly illuminated store .770 .018 .198 -.233 -.128 .294 .026 .256 .150 I don't feel that the store has provisions for old people, disabled

people and children .741 .093 .153 -.094 .015 .321 .091 -.240 -.145

I don't like old music being played .734 -.048 .032 .068 -.018 -.295 -.016 .073 .078

The scent makes me happy. (unhappy) .641 .200 -.087 -.336 .069 .108 .463 -.043 .261

I feel at ease when the music being played is of my choice -.566 .291 -.400 .014 .237 .238 .045 .102 -.133

I leave the store when music being played is not of my choice -.280 .840 .122 -.103 .023 .274 .046 .118 .045

Because of the scent, I buy things that I don't require .150 .840 .091 -.171 .175 -.273 .112 -.051 .072

I am drawn to a store that plays music of my choice .094 .586 .057 .032 .475 -.446 -.126 .155 -.273

I am satisfied (dissatisfied) with the scent .231 .468 -.033 .443 .055 -.020 .034 .024 .174

I feel the store plays music that suits my age -.036 .461 -.107 .375 -.286 .069 -.245 .393 .244

I don't like current music ( the latest songs) being played. .075 .208 .847 -.192 -.069 .158 .109 .031 .202

I find the salespeople seem to be helpful. -.218 -.188 -.772 .201 .074 .237 -.134 .002 .073

(11)

Appendix F

Table: Variance Extracted By Each Factor

S No Factor No and Label Variance Extracted (VE)

1 Querulous 0.637

2 Music 0.634

3 Sensitive 0.765

4 Budget Seeker 0.562

5 Sensuous 0.630

6 Light 0.445

7 Idler 0.455

8 Space Seeker 0.306

9 Relaxer 0.416

Rotated Component Matrix

a

Component

I believe that music reinforces the image of the store -.165 .411 -.733 -.251 .255 -.174 .142 -.082 -.105 I always find a lot of merchandise on a discount -.068 -.117 -.126 .798 .029 .072 .151 -.213 .037 I feel the merchandise are for sale for a large number of days -.108 -.041 -.147 .756 -.153 .204 .104 -.015 -.126 I find the width of the check out counters sufficient -.206 .016 .124 .721 .182 -.379 -.096 .170 .104 I am too comfortable, if the store interior is bluish -.004 -.233 .206 -.098 -.853 -.042 .049 .095 .189 I sometimes stick around in a store to listen to the music. -.019 -.105 -.312 -.044 .732 -.065 -.280 -.028 -.103 Right kind of music being played is important for me. -.181 .112 .146 -.019 .618 .173 .083 .341 .203 I think that Discount stores have shades of orange on the walls .239 .344 .169 .248 -.368 .142 -.289 .207 -.288 I shop less in a store when the area is dark. .000 .012 .228 -.016 .049 .848 -.109 -.018 .080

I like brightly lit stores .109 -.052 -.313 .141 .055 .567 .046 .209 -.093

I am able to find a salesperson easily -.004 .032 .084 .110 -.094 .068 .799 -.014 .036

I am contended (melancholic) with the scent .324 .143 .221 .017 -.034 -.378 .554 .153 -.038

I would spend 2 time in a store if I like the music -.050 .162 .233 -.355 .430 .172 -.519 .005 -.077

I feel there is congestion during peak sales .159 -.058 .169 -.055 -.056 .030 .030 .669 .140

I feel prices are reasonable in a bluish coloured store .165 -.183 .175 .051 -.143 -.011 -.010 -.655 .175

I feel the store has provision to sit and rest -.200 .099 -.198 -.193 -.033 .029 .025 -.193 -.757

I think Luxury stores have shades of blue on the interiors .015 .264 .018 -.122 -.218 .052 .112 -.139 .607

수치

Table : Rotated Component Matriximportant for me

참조

관련 문서

Colonial Policy and Practice: A Comparative Study of Burma and Netherlands India (1948) was listed in the 14 most influential books of Southeast Asian Studies (Hui 2009).

Process data in registers using a number of data processing instructions which are not slowed down by memory access. Store results from registers

In this study, the different codes were compared and analyzed for the research on decontamination and decommissioning waste generation by using the codes

The application of this concept to Dalit writings to study the position of women shows that most discourse by the high caste writers hardly focuses on the plight

The study conducted a study of literature and research, and in literature, the study of cosmetic behavior, nail behavior, self esteem, and

In this study, platelet-derived growth factors-BB (PDGF-BB), vascular endothelial growth factor (VEGF), and insulin-like growth factor-1 (IGF-1) were quantified in the PRF

In geo-location database oriented spectrum sharing system, the entire geographic area is divided into meshes to classify, store and delivery the cognitive information..

Pant and Tom Milford, “The UK Shifts to the Indo-Pacific: An Opportunity for India-UK Ties” Issue Brief, Delhi: Observer Research Foundation, (2021.2.15.)... 33)