한국 전기철도 시스템의 RC-Bank의 최적 위치 및 설계
이한민* 김길동* 오세찬* 박성혁*
--- ---
This paper presents the RC-Bank installation by its optimal location and design to reduce harmonics on the Korean high-speed railway system. The system model of the Korean high-speed railway system is based on 8-port representation, which is an extension of 2-port network theory. A new proposed model is for harmonic analysis in 2×27.5kV traction power supply system including feeders, contact lines, rails and autotransformers. The proposed model is developed by combining fundamental element models of the Korean high-speed railway system, and it is verified by comparing simulation results with measurement data regarding the amplification rate of harmonic currents.
--- 1. INTRODUCTION
Korea finally ran the high-speed train (HSR-350x) at its target speed of 350km/h slightly touching off 352.4km/h. It was a historic moment that put Korea on the fourth notch in the world boasting the development technology of high-speed train followed by France, Germany and Japan. HSR-350x boasts its construction with 92 percent of local technology ranging from its unique design to core devices such as propulsion and control systems. KRRI is envisaging to put commercial HSR-350x trains on the Honam line timed with completion of the rail in 2007.
Harmonic currents in the electric train are one of the most important aspects of power quality. An inherent characteristic of rectifier load is harmonic current generation. A load current model to represent electric trains was proposed [1]. Harmonic currents cause increased heating in rotating machinery, can cause overcurrent and may produce overvoltage if areas of the power system are resonant near the harmonic frequency. They also increase loss in transformers and other power system elements. Therefore, an exact assessment of the harmonic current flow must be undertaken during the designing and planning stage for the electric railway system [2, 3]. Since the harmonic current flows through the catenary system, it needs to be accurately modeled to analyze and assess the harmonic effect on the power feeding system. The electric railway system as well as the electric train should be modeled. The electric railway system was expressed by 2-port or 4-port network model[4, 5]. Also, filters to reduce harmonics are needed on the electric railway system[6, 7].
Korean high-speed railway system is composed by the common grounding system, which means rails on up/down track, protection wires on up/down track and grounding conductors are connected commonly. Therefore, Korean high-speed railway system should be modeled by 8-port representation for the harmonic analysis. 8-port representation means that the system has 4 input ports, 4 output ports and a basic port. Namely, input/output ports of feeders on up/down track and input/output ports of contact wire groups on up/down track.
And input/output ports of rail group on up/down track become basic port.
---
한국철도기술연구원 주임연구원 차세대전동차연구팀
* , ,
한국철도기술연구원 책임연구원 차세대전동차연구팀
* , ,
한국철도기술연구원 연구원 차세대전동차연구팀
* , ,
한국철도기술연구원 선임연구원 차세대전동차연구팀
* , ,
Finally, the proposed model is based on 8-port representation that is an extension of 2-port network theory. After the amplification rate of harmonic current is analyzed, the preventive equipment against harmonic of this system is installed to reduce harmonics. We design the optimal location and parameters of the RC-Bank from the verified model. The effects of R and C parameters to reduce harmonics are reviewed. A sensitivity analysis was performed with the maximum harmonics amplification rate. The proposed RC-Bank is installed, then the THD is analyzed. This paper presents the proposed optimal location and design of the RC-Bank and 8-port representation model.
2. KOREAN HIGH-SPEED RAILWAY SYSTEM
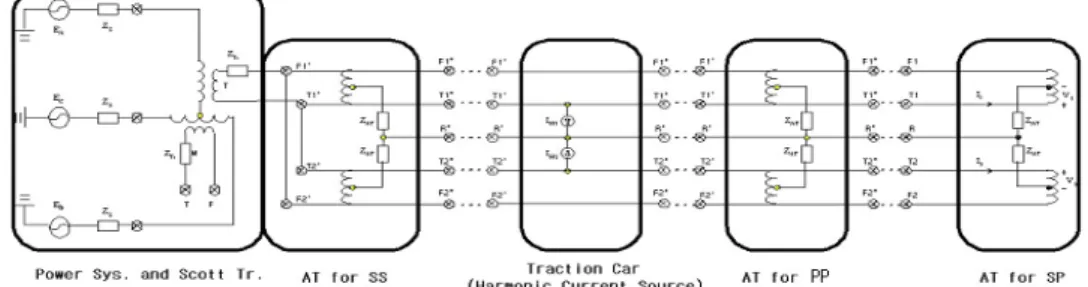
The AC electric railway systems in Korea are based on single-phase 55kV/27.5kV. AC feeding circuits supply electric trains with necessary power by a 3-phase to a 2-phase Scott-transformer through feeders, contact wires and rails. Autotransformers are installed at approximately every ten kilometers with circuit breakers, which connect adjacent up and down tracks at the parallel post (PP). Substations (SS) are located at about every fifty kilometers, and there is a sectioning post (SP) midway between two substations. The SP has circuit breakers, which enable one feeding circuit to electrically separate from the other. They may be closed in case the adjacent SS is out of service. Figure 1 shows a typical Korean high-speed railway system.
Figure 1 Korean high-speed railway system
In a general way, desirable harmonic analysis should be performed on 2-port representation for the sake of calculation convenience. Harmonic current source is, however, connected to contact line and rail conductor on secondary sides of two autotransformers whichof primary terminals are connected between contact line and feeder in the circuit model as shown in Figure 1 What is more, there are capacitive admittances among three conductors(contact line, feeder and rail conductor). They make it impossible to realistically model the power feeding system upon 2-port representation. For that reason, this paper proposes a new model for harmonic analysis in the power supply system including feeders, contact lines, rails and autotransformers. The system model is based on 8-port representation that is an extension of 2-port network theory. 8-port representation for each element in the Korean high-speed railway system can be derived as follows:
3. CASE STUDIES 3.1 Comparison of total harmonic distortion(THD)
The THD is used as a standard for harmonics regulation of the Korean high-speed railway system. The limitation of the THD in Korea is 1.5%. Since there is the need to get the tendency of the THD, which varies depending on where it is calculated, it is calculated with 1 high-speed electric train set in operation on the section that is Shinchungju-Yongjung. The outcome is shown in Figure. 2, which compares the varied results from different assessing points where are Shinchungju railway substation(KORAIL S/S) 55kV feeder busand 154kV incoming bus, and the power utility's Chungwon substation(KEPCO S/S) 154kV outgoing bus.
Phase T Phase A Phase B Phase C Phase A Phase B Phase C 0
5 10 15 20 25
Total Harmonic Distortion(THD) [%]
55kV <---154kV---><---154kV--->
<---KORAIL S/S---><---KEPCO S/S--->
Figure 2 Comparison of THD on calculating points
According to Figure 2, the THD atrailway substation is biggerthe power utility's Chungwon substation 154kV outgoing bus. It is because harmonics impedance and each harmonics' voltage, which are calculated from each points to electric trains(harmonics sources), are higherat Shinchungju railway substation. As proven, since the THD varies depending on the point of common coupling(PCC), the PCC of the THD should be defined. In general,the electric power outgoing line(point) is defined as the PCC. For problem of harmonics occurrence on the Korean high-speed railway system to be assessed, the THD depending on high-speed electric train operation conditions is calculated at the power utility's electric power outgoing line(point).
Phase A Phase B Phase C 0.0
0.5 1.0 1.5 2.0 2.5 3.0 3.5 4.0
Limitation of THD
Total Harmonic Distortion(THD) [%]
Calculation Point (Power utility's substation)
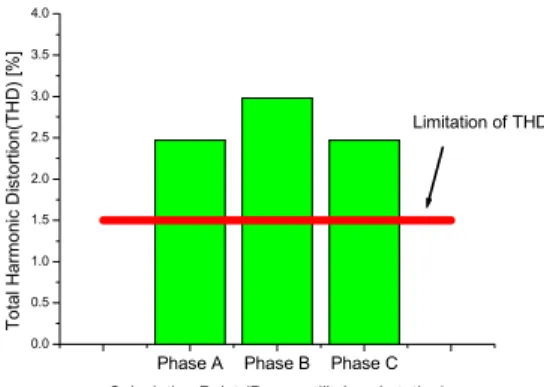
Figure 3. THD depending on operation condition of 2 high-speed electric trains set (Simulation)
In this case of Figure 3, the THD calculated at electric power outgoing line(point) of Chungwon substation bus, exceeds 1.5%, the upper limit of the THD regulation. The preventive equipment against harmonic of this system was installed in order to reduce harmonics.
3.2 Optimal location and design for RC-Bank installation
Paragraph 3.1 suggests that a RC-bank should be installed as a preventive equipment against harmonics. Now Paragraph 3.2 explains the optimal location and design for the RC-bank installation. The flow chart to get the optimal location and design for the RC-bank installation is shown in Figure 4.
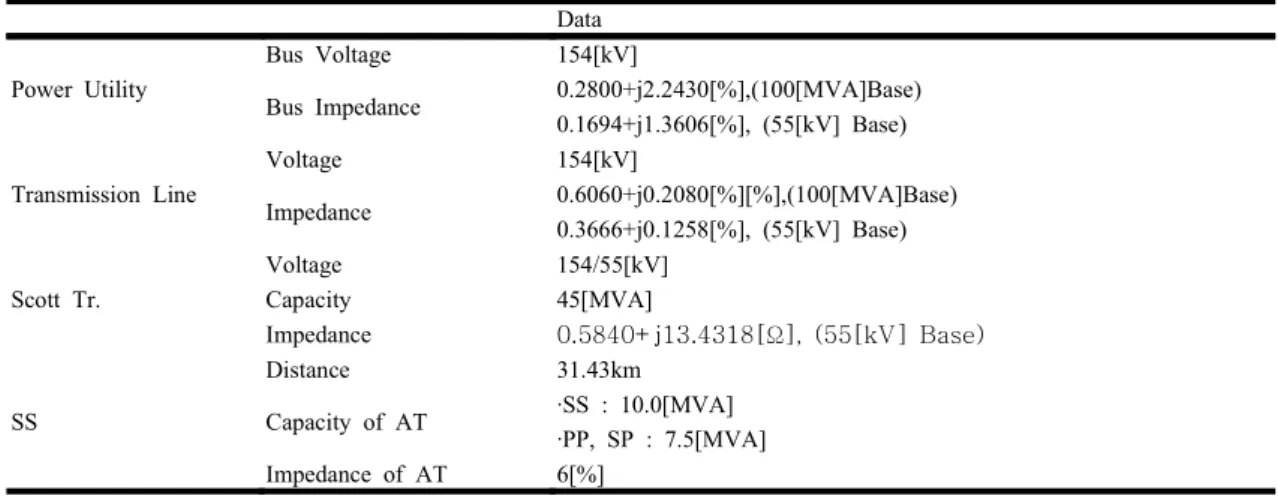
Figure 4 The flow chart to get the optimal location and design for RC-bank Table 1 Source data of this railway system
Data
Power Utility
Bus Voltage 154[kV]
Bus Impedance 0.2800+j2.2430[%],(100[MVA]Base) 0.1694+j1.3606[%], (55[kV] Base)
Transmission Line
Voltage 154[kV]
Impedance 0.6060+j0.2080[%][%],(100[MVA]Base) 0.3666+j0.1258[%], (55[kV] Base)
Scott Tr.
Voltage 154/55[kV]
Capacity 45[MVA]
Impedance 0.5840+j13.4318[ ], (55[kV] Base)Ω
SS
Distance 31.43km
Capacity of AT ·SS : 10.0[MVA]
·PP, SP : 7.5[MVA]
Impedance of AT 6[%]
We analyzed harmonics at different locations of the RC-bank. With the RC-bank parameter confined to 750Ω, 0.18㎌ that are used in the Korean National Railroad's AT feeding system, the amplification rate of harmonic current on the Korean high-speed railway system were analyzed. 4 locations(SS, PP1, PP2, and SP) are considered to install the RC-Bank.
This railway system is shown in Figure 5.
Figure 5 The railway system
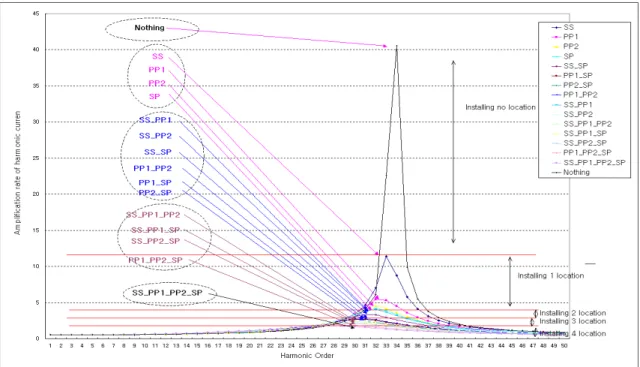
According to Figure 5, harmonics reducing effects depending on the RC-bank's location are calculated in following order.
1) case of installing RC-Bank at 1 location 2) case of installing RC-Bank at 2 locations 3) case of installing RC-Bank at 3 locations 4) case of installing RC-Bank at all locations
We simulate all cases to analysis the effects depending on the RC-Bank’s location. The results are shown in Figure 6.
Figure 6 Effects depending on the RC-Bank’s location
The optimal location of the RC-bank installation for 1) ~ 4) cases is as follows.
In case of installing the RC-Bank at 1 location, the optimal location installs the RC-bank at SP.
1) case of installing the RC-Bank at 2 locations, the optimal location installs the RC-bank at SP and PP(#2).
2) case of installing the RC-Bank at 3 locations, the optimal location installs the RC-bank at SP, PP(#2) and PP(#1).
3) case of installing the RC-Bank at all locations, the optimal location surely installs the RC-bank at SP, PP(#2), PP(#1) and SS.
As results, the RC-Bank installation at SP becomes the optimal location to reduce harmonics. The results are shown in Figure 7.
Figure 7 The optimal location for RC-Bank installation
As a preliminary step to choose the optimal parameter for the RC-bank installation at SP, the effects of design parameters R and C values to reduce harmonics are explained. The Figure 8 is simple railway system with the power utility to analysis the resonance phenomenon.
L C1 I
Figure 8 The railway system for the resonance phenomenon The relations of current and voltage are represented by the next equation(1).
1
1 jwL jwC
V Z
I V
+
=
=
(1) When this system becomes a resonance, Impedance, Z, is expressed by the following equation(2).
=0
Z , 1
2 1
=LC
ω (2)
If the RC-Bank is installed, the system is represented as the next Figure 9.
L
C1 I
R C2
Figure 9 The railway system with installed RC-Bank
When this system becomes a resonance, Impedance, Z, is expressed by the following equation(3).
] [
1
2 1 2
1 2
2 1 3 2 2
2 1 2
C C j C RC
C RLC j RC j LC Z LC
+ +
−
− +
−
= −
ω ω
ω ω
ω ω
(3) From the equation(3), in case the equation is a resonance, Impedance, Z, is expressed by the next equation(4).
1 2 1 2
1 2
LC C jC L RC
C C
Z − + +
−
=
(4) Therefore, the smaller R value is, the lower harmonics amplification rate is, but R has a tendency which suddenly phases out at around specific value. The smaller C value is, the lower harmonics amplification rate is also.
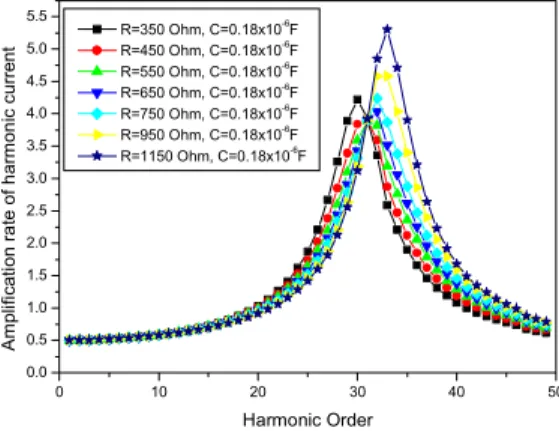
First, with C value confined to the basic parameter 0.18㎌ while changing R value from 350Ω through 1150Ω, we calculate harmonics amplification rates's reducing effects to find out the effect of R value. The outcome is illustrated in Figure 10.
0 10 20 30 40 50
0.0 0.5 1.0 1.5 2.0 2.5 3.0 3.5 4.0 4.5 5.0 5.5
Amplification rate of harmonic current
Harmonic Order R=350 Ohm, C=0.18x10⁻⁶F R=450 Ohm, C=0.18x10⁻⁶F R=550 Ohm, C=0.18x10⁻⁶F R=650 Ohm, C=0.18x10⁻⁶F R=750 Ohm, C=0.18x10⁻⁶F R=950 Ohm, C=0.18x10⁻⁶F R=1150 Ohm, C=0.18x10⁻⁶F
Figure 10. Harmonic amplification rate reducing effects on changing R value of RC-Bank
According to Figure 10. R value affects resonance frequency and the amplification rate of harmonic current. As we mentioned above, in other words, the smaller R value is, the lower the amplification rate ofharmonic current, a tendency which suddenly phases out at around 550Ω.Therefore, in this case, the range of optimal R value is 550Ω and below.
In the meantime, with R value confined to the basic parameter 750Ω while changing C value from 0.12㎌ through 0.36㎌, we calculate harmonics amplification rate's reducing effects to find out the effect of C value effect. The outcome is illustrated in Figure 11.
0 10 20 30 40 50
0 1 2 3 4 5
Amplification rate of harmonic current
Harmonic Order R=750 Ohm, C=0.12x10⁻⁶F R=750 Ohm, C=0.15x10⁻⁶F R=750 Ohm, C=0.18x10⁻⁶F R=750 Ohm, C=0.21x10⁻⁶F R=750 Ohm, C=0.24x10⁻⁶F R=750 Ohm, C=0.27x10⁻⁶F R=750 Ohm, C=0.30x10⁻⁶F R=750 Ohm, C=0.33x10⁻⁶F R=750 Ohm, C=0.36x10⁻⁶F
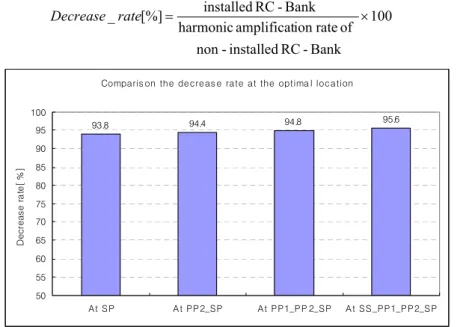
Figure 11. Harmonic amplification rate reducing effects on changing C value of RC-Bank The calculations of the optimal RC-Bank parameters are repeated at each optimal location. We deal with effects of R and C parameters of the RC-Bank. A sensitivity analysis was performed with the maximum amplification rate of harmonic current. While changing R value from 250Ω through 2000Ω and C value from 0.1㎌ through 0.5㎌ at the same time in order to find out the optimal parameter. The decrease rate is expressed by the following equation (5) and shown in Figure 12.
100 Bank
- RC installed -
non
of rate ion amplificat harmonic
Bank - RC installed
of rate ion amplificat harmonic
[%]
_rate = ×
Decrease
(5)
Comparis on the decreas e rate at the optima l location
93.8 94.4 94.8 95.6
50 55 60 65 70 75 80 85 90 95 100
At SP At PP2_SP At PP1_PP 2_SP At SS_PP1_PP2_SP
Decrease rate[%]
Figure 12 Comparison of the decrease rate at the optimal locations
When RC-Banks are installed at all locations, the decrease rate is max. Aspect to the decrease rate, installing RC-Banks at all locations is optimal. However, cost - effectiveness as well as effectiveness in reducing harmonics for the optimal location is
important. The investment is not simply increased as many as the number of the RC-Bank.
Namely, not only RC-Bank butalso space and additional equipments should be invested. It is installed as outdoor type at SP, PP and SS on the Korean high-speed railway system.
Therefore, there is more cost for additional space. Comparison for Cost –effectiveness is shown in Figure 13
Comparis on for Cos t – effectivenes s including a dditional cos t
1.00
2.45
3.91
5.36
0.0 1.0 2.0 3.0 4.0 5.0 6.0
At SP At PP2_SP At PP1_PP 2_SP At SS_PP1_PP2_SP
Raletive cost rate on Installation base at SP
Figure 13 Comparison for Cost – effectiveness
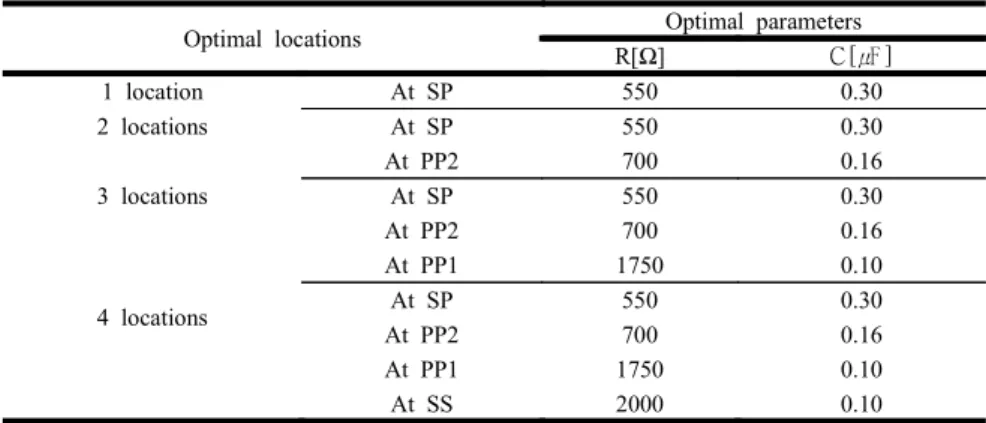
The optimal parameters depended on the optimal locations are shown in Table 2.
Table 2 The optimal parameters at the optimal locations
Optimal locations Optimal parameters
R[ ]Ω C[ ]㎌
1 location At SP 550 0.30
2 locations At SP
At PP2
550 700
0.30 0.16
3 locations At SP
At PP2 At PP1
550 700 1750
0.30 0.16 0.10
4 locations At SP
At PP2 At PP1 At SS
550 700 1750 2000
0.30 0.16 0.10 0.10
After all, if cost - effectiveness and effectiveness in reducing harmonics are considered, the optimal location of the RC-Bank is determined as SP. At the same time, the optimal RC-Bank parameters are determined as R value 550Ω and C value 0.30㎌. The outcome is illustrated in Table 3. The shadowed parts in Table 3 indicate belower range than the amplification rate of harmonic current, that is 2.5323 in Figure 7. The value 2.5323 is the amplification rate of harmonic current that one RC-Bank installed at SP should have at least the same effects with the RC-Bank installed at two optimal locations.
Finally, the optimal location of the RC-Bank is to be installed at SP. The optimal number of the RC-Bank is one at SP. And the optimal parameters of the RC-bank are R value 550Ω and C value 0.30㎌. Establishing the RC-bank at SP is most profitable on the harmonic control side and the economic performance side as preventive equipment against high-harmonic order.
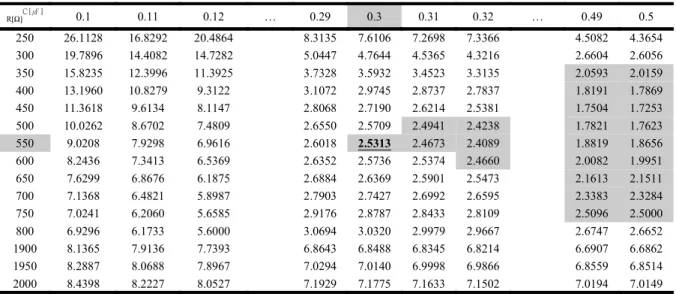
Table 3 Analysis sensitivity on the amplification rate of harmonic current
3.3 Current capacity at RC-bank
The preceding 3.2 chooses R=350Ω and C=0.33㎌ as the optimal parameter of the RC-bank given cost-effectiveness and effectiveness in reducing harmonics. Since the RC-bank is connected between conductor group on catenary and that on rail in parallel, which means that there always exists a certain amount of current. Therefore, chances of problem occurring should be minimized in advance by reviewing the amount of continuous current.
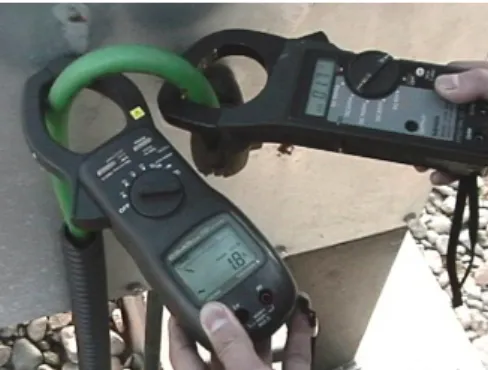
While changing R value from 250Ω through 2000Ω and C value from 0.1㎌ through 0.5㎌ at the same time, we calculate the current capacity at the RC-bank set in rated voltage and rated frequency. The outcome is illustrated in Table 4. The shadowed parts in Table 4 indicate R value 750Ω and 550Ω plus C value 0.18㎌ and 0.30㎌. Within this range, the current capacity(about 2A-4A) is not so great. Moreover, the current capacity is 3.1042A at the optimal parameter R=550Ω and C=0.30㎌, which shows there is no problem caused. In addition, in the current capacity review at Table 4, the current capacity at the RC-bank for the Korean National Railroad's industrial line(Figure 14, R=750Ω, C=0.18㎌) was 1.86A in case that electric trains are not in operation. The result of a real measurement confirms 1.8A in Figure 15. This is another proof supporting paragraph 3.2 review.
Somewhat, in case of electric trains in operation, the current capacity at the RC-bank increases due to inflow of harmonic currents.
Table 4 Current capacity of RC-Bank(60Hz, [A])
R[ ]ΩC[ ]㎌ 0.1 0.11 0.12 … 0.29 0.3 0.31 0.32 … 0.49 0.5
250 26.1128 16.8292 20.4864 8.3135 7.6106 7.2698 7.3366 4.5082 4.3654
300 19.7896 14.4082 14.7282 5.0447 4.7644 4.5365 4.3216 2.6604 2.6056
350 15.8235 12.3996 11.3925 3.7328 3.5932 3.4523 3.3135 2.0593 2.0159
400 13.1960 10.8279 9.3122 3.1072 2.9745 2.8737 2.7837 1.8191 1.7869
450 11.3618 9.6134 8.1147 2.8068 2.7190 2.6214 2.5381 1.7504 1.7253
500 10.0262 8.6702 7.4809 2.6550 2.5709 2.4941 2.4238 1.7821 1.7623
550 9.0208 7.9298 6.9616 2.6018 2.5313 2.4673 2.4089 1.8819 1.8656
600 8.2436 7.3413 6.5369 2.6352 2.5736 2.5374 2.4660 2.0082 1.9951
650 7.6299 6.8676 6.1875 2.6884 2.6369 2.5901 2.5473 2.1613 2.1511
700 7.1368 6.4821 5.8987 2.7903 2.7427 2.6992 2.6595 2.3383 2.3284
750 7.0241 6.2060 5.6585 2.9176 2.8787 2.8433 2.8109 2.5096 2.5000
800 6.9296 6.1733 5.6000 3.0694 3.0320 2.9979 2.9667 2.6747 2.6652
1900 8.1365 7.9136 7.7393 6.8643 6.8488 6.8345 6.8214 6.6907 6.6862
1950 8.2887 8.0688 7.8967 7.0294 7.0140 6.9998 6.9866 6.8559 6.8514
2000 8.4398 8.2227 8.0527 7.1929 7.1775 7.1633 7.1502 7.0194 7.0149
0.12 0.15 0.18 0.21 0.24 0.27 0.30 0.33 0.36
150 1.2440 1.5550 1.8660 2.1770 2.4879 2.7988 3.1097 3.4206 3.7314
250 1.2440 1.5549 1.8658 2.1767 2.4875 2.7983 3.1089 3.4195 3.7301
350 1.2439 1.5548 1.8656 2.1769 2.4869 2.7974 3.1077 3.4180 3.7280
450 1.2438 1.5546 1.8652 2.1757 2.4861 2.7962 3.1062 3.4158 3.7253
550 1.2437 1.5543 1.8648 2.1751 2.4851 2.7948 3.1042 3.4132 3.7219
650 1.2435 1.5540 1.8643 2.1742 2.4838 2.7931 3.1018 3.4101 3.7178
750 1.2434 1.5537 1.8637 2.1733 2.4824 2.7910 3.0990 3.4064 3.7130
850 1.2432 1.5533 1.8630 2.1722 2.4808 2.7887 3.0959 3.4022 3.7076
950 1.2429 1.5528 1.8622 2.1710 2.4790 2.7862 3.0924 3.3975 3.7016
1050 1.2427 1.5524 1.8614 2.1696 2.4770 2.7833 3.885 3.3924 3.6949
1150 1.2424 1.5518 1.8604 2.1682 2.4748 2.7802 3.0842 3.3867 3.6876
Figure 14 Specification of RC-bank Figure 15 Measurement of current capacity of installed at Anjung SP on JoongAng line RC-bank (in case that trains are not in operation)
Proposed optimal location and parameters is applied to the Korea high-speed railway system. After the RC-Bank(R=550Ω, C=0.30㎌) is established at SP. We calculate the THD at power utility’s bus. At this time, it is suppose that 2 electric trains run near by SP in simulation for the worst case.
Figure 16 THD before/after installing RC-Bank at kyungsan SP on the Korea
After the RC-bank was installed, the maximum THD was 1.13% in simulation. The results verify the quality of the proposed RC-Bank as well as 8-port represented model. Therefore, the optimal design of the RC-Bank and 8-port represented model are in good agreement with the Korean high-speed railway system.
4. CONCLUSION
This paper presents the RC-Bank installation by its optimal location and design to reduce harmonics on the Korean high-speed railway system. The system model of the Korean high-speed railway system is based on 8-port representation, which is an extension of 2-port network theory. A new proposed model is for harmonic analysis in 2×27.5kV traction power supply system including feeders, contact lines, rails and autotransformers.
In this paper, we specially propose the system model based on 8-port representation that is an extension of 2-port networktheory. Aggregating subsystems compose the overall system. The proposed model is developed by combining fundamental element models of the Korean high-speed railway system.
The THD calculated at electric power outgoing line(point) of Chungwon substation bus, exceeds 1.5%, the upper limit of the THD regulation.
We design the optimal location and parameters of the RC-Bank by the verified 8-port
representation model. Establishing the RC-bank at SP is most profitableon the harmonic control side and the economic performance side as preventive equipment against high-harmonic order. The most suitable values are R value 550Ωand C value 0.30㎌ as the design parameters of the RC-bank.
The simulation results of the proposed model and the measurement data from the test are compared. The results verify the quality of the proposed RC-Bank as well as 8-port represented model. Therefore, the optimal design of the RC-Bank and 8-port represented model are in good agreement with the Korean high-speed railway system.
5. REFERENCES
[1] N J Balu , Railroad electrification on utility system, EPRI, EL-3001, Contract TPS 81-796. 1983, pp 60-83
[2] H Lee, C Lee, H Cho, G Jang, S Kwon, "Harmonic analysis model based on PSCAD/EMTDC for korean high-speed railway", 2004 Large Engineering Systems Conference on Power Engineering, 2004, pp 93-97
[3] Yuen K H, Pong M H, Lo W C, Ye Z M, "Modeling of electric railway vehicle for harmonic analysis of traction power-supply system using spline interpolation in frequency domain", Applied Power Electronics Conference and Exposition, Vol. 1, 1999, pp 458-463 [4] J Holtz, H J Klein, "The propagation of harmonic currents generated by inverter-fed
locomotives in the distributed overhead supply system", IEEE Transaction on Power Electronics, Vol. 4, No. 2, 1989, pp 168-174
[5] R J Hill, I H Cevik, "On-line simulation of voltage regulation in autotransformer-fed AC electric railroad traction network", IEEE Transaction on Vehicular Technology, Vol.
42, No. 3, 1993, pp 365-372
[6] J Holtz, J O Krah , "Suppression of time-varying resonances in the power supply line of AC locomotives by inverter control", IEEE Transaction on Industrial Electronics, Vol. 39, No. 3, 1992
[7] D Rivas, L Moran, J W Dixon, J R Espinoza, "Improving passive filter compensation performance with active techniques", IEEE Transaction on Industrial Electronics, Vol.
50, No. 1, 2003
[8] P Ferrari, P Pozzobon, "Railway lines models for impedance evaluation", 8thInternational Conference on harmonics and Quality of Power ICHQP ’98, 1998, pp 641-646
[9] CCITT,Directives concerning the protection of telecommunication lines against harmful effects from electric power and electrified railway lines, Vol.?, 1989