Analysis of the Physicochemical Properties and Antioxidative Activity of Napa Cabbage Pickle
Hae-Reon Son
1, Sun-Kyung Oh
1, Sang-Ok Bae
2and Myeong-Rak Choi
1*
1
Department of Biomedical and Electronic Engineering, Chonnam National University, Yeosu 550-749, Korea
2
Department of Culinary Art, Chodang University, Muan 534-701, Korea
Received June 13, 2016 /Revised August 15, 2016 /Accepted August 30, 2016
The principal objective of this fundamental research was to analyze the physicochemical properties the and antioxidative activity of Napa cabbage pickle (NCP) for development of low-salt pickles.
NCP-1 was a smaller than NCP at amount soy sauce (10%). The pH of NCP and NCP-1 were 4.51±
0.15, 4.85±0.08 immediately after preparation. The pH of NCP and NCP-1 was reduced to 4.08±0.05 and 4.31±0.12 over time during 60 days of storage. The acidity of the NCP and NCP-1 immediately after preparation were 0.51% and 0.38% and increased to 0.67% and 0.56% after 60 days of storage.
The salinity for the NCP ranged from 1.71-2.22% and NCP-1 ranged from 1.18–1.63%. The L value, which indicates the lightness, was the highest at day 0 and the lowest at 60 day. The tensile strength value of NCP was 10.9±0.05 kgf/cm
2and NCP-1 in 11.84±0.11 kgf/cm
2at day 0 and then significantly decreased with time in storage. The cutting force of NCP was 1004±7.12 gf/cm
2and NCP-1 in 845±5.27 gf/cm
2at day 0, which increased over time in storage. The overall acceptability of NCP was the highest at day 30, but the overall acceptability of NCP-1 was the highest at day 45. NCP-1 extracts at day 60 showed the highest antioxidant activity of 66.04%, whereas the NCP extract at day 0 showed the lowest antioxidant activity of 45.41%. These results showed that depending on the content of the seasoning pickle difference in the antioxidant activity. Thus, the best pickled Napa cabbage is de- termined by a smaller amount soy sauce in NCP-1, and the results could provide a basis for improv- ing the availability and quality of Napa cabbage.
Key words : Antioxidative activity, Brassica rapa, napa cabbage, physicochemical property, pickle
*Corresponding author
*Tel : +82-61-659-7303, Fax : +82-61-659-7309
*E-mail : [email protected]
This is an Open-Access article distributed under the terms of the Creative Commons Attribution Non-Commercial License (http://creativecommons.org/licenses/by-nc/3.0) which permits unrestricted non-commercial use, distribution, and reproduction in any medium, provided the original work is properly cited.
Journal of Life Science 2016 Vol. 26. No. 11. 1275~1281 DOI : http://dx.doi.org/10.5352/JLS.2016.26.11.1275
Introduction
Sustained economic growth and development of medicine has increased age and human life expectancy. Since food supplies energy and nutrients, there is increasing interest in the functional foods to inhibit diseases associated with aging by prevention and recovery. In order to obtain health-promoting effects from a functional food, looking for excellent food material for developing functional food appli- cations will continue to be made necessary [9]. Recent re- search on the physiological functionality of the Brassicaceae family has increased, in particular, this plant family’s sig- nificant anti-cancer and antimicrobial effects have been rec- ognized [18].
Lapa cabbage (Brassica campestris ssp. pekinensis) is a mem- ber of the Brassicaceae family. Historically, a sense-mediated adaptive mechanism to avoid consumption of poisons has selected for low-glucosinolate content in vegetables. Recent sensory trials have shown typical rocket salad flavor and pungency are perceived as positive sensory traits, while bit- ter notes, characterized by high glucosinolate content(sin- albin /gluconapin-herbaceous; sinigrin pungency), were much less acceptable. Glucosinolate concentrations in plants are around 1% dry weight in some Brassica vegetables, al- though these concentrations are highly variable. Glucosino- lates are very stable water-soluble precursors of isothiocya- nates and some fresh plants have been shown to contain glucosinolate almost exclusively and no isothiocyanates.
Pickles that are prepared in many western countries use var-
ious vegetables depending on the season and region. Korean
traditional jangachi production methods are similar, and
mainly cucumbers, onions, tomatoes, green peppers, and
cabbage are used [8]. Pickles are usually separated into salty
pickles and sweet pickles, which use mainly vinegar and
sugar, respectively. Salting during the manufacturing proc-
ess affects qualities such as taste, flavor, and texture. These qualities are highly dependent on the salt concentration, storage temperature, storage time, and brine used. A food is pickled after saltwater cause the dehydration of the mate- rial, and the separated plasma is made of a component of the penetrated sauce [17]. So far, research has been per- formed on jangachi prepared with pickled turnip, cauli- flower, ginseng, bellflower, deodeok, lotus root, and mush- room [16]. Though reports have been made about pickling a variety of agricultural products, research on the pickle us- ing napa cabbage has not been conducted. This study exam- ines the using potential of napa cabbage as a low-salt pickle product, in hopes of contributing to the diversification of food with napa cabbage to generate pickle-oriented revenues.
Matrials and Methods
Materials
Napa cabbage was produced at Yeosu-si Dolsan-eup, Korea and harvested in October 2015. Napa cabbage pickle (NCP) samples were prepared with napa cabbage (65%) (v/v), soy (15%), apple vinegar (7%), water (7%), garlic (1%) and condiment sauce (5%), and napa cabbage pickle(NCP-1) samples were prepared with napa cabbage (65%), soy sauce (10%), apple vinegar (7%), water (12%), garlic (1%) and con- diment sauce(5%), and stored at 4℃ during 60 days after preparation.
Preparation of NCP and NCP-1 extracts
NCP and NCP-1 were ground to a particle size of 5-10 mm using a high speed mixer (Blender, Hanil, HNF-340, Seoul, Korea). NCP and NCP-1 samples (10 g) were placed in a round flask in a Soxhlet extractor with 80%(v/v) ethanol in a round flask extracted at 60℃ for 24 hr. After cooling at room temperature (RT) of 25℃, the extracts were filtered with a Whatman No. 2 filter. The filtrate was evaporated by an evaporator (EYELA, Tokyo, Japan) at 60℃, and then the extracts were transferred to a freeze-drying tube and lyophilized. The dried extracts were weighed to get ethanol extract (10.98%). After each extracts stored at 0℃ prior to analysis. The absorbance of extracts (300 μl) was analyzed in a 96-well plate (SPL Lifescience Co., Pocheon, Korea) us- ing a Microplate Reader (UVM340, Biochrom, Cambridge, UK).
pH and titratable acidity
NCP and NCP-1 were ground to a particle size of 5-10 mm using a high speed mixer, and then, they were strained through a sterile gauze. The pH of each sample was meas- ured based on the mean value of 3measurements from 10 ml of the undiluted liquid portion of NCP and NCP-1 using a pH meter (Orion 520A, Boston, USA). Each sample was diluted 2×by mixing 10 ml of sample with 10 ml of distilled water, followed by measurement of the quantity of a 0.1 N NaOH solution used to titrate the mixture to a pH of 8.3 for measurement of titratable acidity.
Salinity
NCP and NCP-1 were ground to a particle size of 5-10 mm using a high speed mixer, and then they were strained through a sterile gauze. The salinity of each sample was measured based on the mean value of 3measurements from 35 ml of the undiluted liquid portion of NCP and NCP-1 using a salimeter (TM-30D, Tokyo, Japan).
Color measurement
Color measurement was performed using a Color Reader (JC801S, Color Techno System Co., Japan) with an 8 mm diameter measuring area. The instrument was calibrated with a standard white plate. Measured L, a, and b values were used as indicators of lightness, greenness, and yellow- ness, respectively.
Hardness analysis
NCP and NCP-1 samples measuring 4×1 cm were cut from the central part of the NCP and NCP-1 at each stage of storage. The hardness of the NCP and NCP-1 was meas- ured using a rheometer (CR-500DX, Osaka, Japan). A 10.00 kg load cell was installed at the rheometer cross-head and chart speeds were 5 and 1.0 mm/s. Hardness analysis is a type of compression test that is used to determine the hard- ness of a sample. Moreover, compression elasticity test jig and cutting force test jig were used to determine the tensile strength and cutting force of the materials, respectively.
Samples were stored at room temperature for 30 min before analysis.
Sensory evaluation
For the sensory evaluation, stored NCP and NCP-1 were
periodically removed from storage (0, 7, 15, 30, 45 and 60
days). The sensory evaluation was performed by 10-trained
Fig. 1. Decreasing the pH at napa cabbage pickle and napa cab- bage pickle-1 during storage. (
●: Napa cabbage pickle,
▲
: Napa cabbage pickle-1)
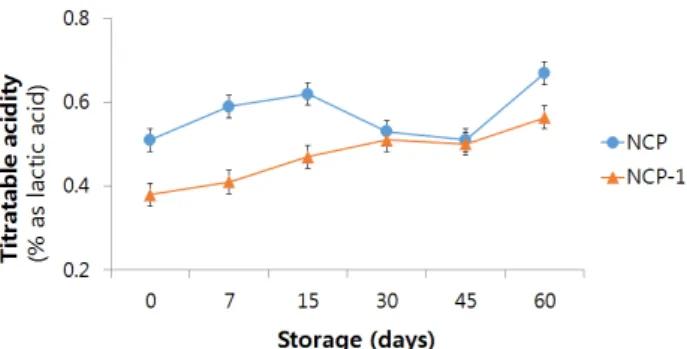
Fig. 2. Increasing titratable acidity at napa cabbage pickle and napa cabbage pickle-1 during storage. (
●: Napa cabbage pickle,
▲: Napa cabbage pickle-1)
panelists, who were graduate students at the Chonnam National University, that were familiar with NCP and NCP-1 consumption. The panelists evaluated the NCP and NCP-1 randomly. The appearance, color, flavor, texture and overall acceptability were evaluated using a 5-point scale(1=
very weak, 3=moderate, 5=very strong).
DPPH radical scavenging activity
The electron donation ability of the obtained methanol extracts was measured by bleaching a purple-colored sol- ution of DPPH radicals based on the method of Blois [14].
Briefly, NCP and NCP-1 extracts were dissolved in ethanol (1 mg/ml) and were added to a 1 ml DPPH radical solution in methanol (final concentration of DPPH 0.2 mM). The sol- ution was incubated for 30 min in the dark at RT, and the mixture absorbance was measured at 517 nm. The control absorbance was measured 0.02% BHT (v/v). The DPPH radi- cal scavenging activity was calculated according to the fol- lowing equation:
DPPH scavenging activity (%) = (1-sample absorbance/
control absorbance) ⨯100
Statistical analysis
All tests and analyses were repeated at least three times.
The results were expressed as mean ± standard deviation (SD). One way analysis of variance (ANOVA) and Duncan’s test were used for multiple comparisons with SPSS version 21.0 (SPSS Institute, Chicago, IL, USA). The values were con- sidered as significantly different if the P value was less than 0.05.
Results and Discussion pH and titratable acidity
The pH changes in NCP and NCP-1 over time are shown in Fig. 1 The pH of NCP and NCP-1 were 4.51±0.15, 4.85±0.08 immediately after preparation (p<0.05). The pH of NCP and NCP-1 was reduced to 4.08±0.05, 4.31±0.12 over time during 60 days of storage. Oh et al [10] showed that the longer the storage time, the lower the pH; the pH of pickled turnips was reduced to 3.0-3.2 after day 35 days stor- age at 20℃. Flemig et al [3] showed the pH of cucumber pickles ranged from 3.1-3.2 after 30 days of storage at 25℃.
These reported pH values are lower than the results of the present study, probably due to different seasoning composi- tion and storage conditions. However, our leaf mustard pick- les differed from turnip, pickles due to differences epidermal thickness and the moisture content of the main component [16]. The pH changes over time in our study were similar to the results found for turnip pickles; the acidity increased over time (Fig. 2). The acidity of the NCP and NCP-1 imme- diately after preparation were 0.51%, 0.38% and increased to 0.67% and 0.56% after 60 days of storage (p<0.05). Park et al [12] showed lotus root pickle acidity was 1.50% immedi- ately after preparation and increased to 1.88% after 30 days of storage; these results are similar our study. Increased acid- ity during NCP and NCP-1, storage it is mainly due to the penetration of vinegar into the solid material, resulting in small amounts of acid produced by fermentation.
Salinity
Fig. 3 shows that salinity of the NCP ranged from 1.71-
2.22% and NCP-1 ranged from 1.18-1.63%(p<0.05). Park et
al [11] reported that salinity of pickled lotus root was not
changed extract substantially during fermentation, and also
showed similar results to this NCP and NCP-1 study. Han
et al [29] found salinity greater than 3.0% after 30 days of
storage of salt-pickled aralia. The average salinity of fer-
Fig. 3. Indicating the value of less than 3% in salinity changes at napa cabbage pickle and napa cabbage pickle-1 during storage. (●: Napa cabbage pickle, ▲: Napa cabbage pickle-1)
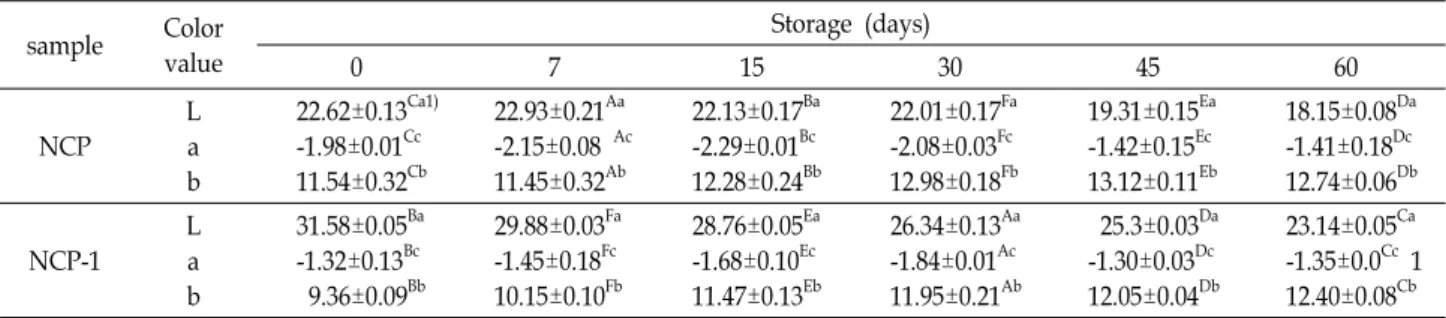
Table 1. Changes in the color of napa cabbage pickle and napa cabbage pickle-1 during storage
sample Color
value
Storage (days)
0 7 15 30 45 60
NCP
L a b
22.62±0.13
Ca1)-1.98±0.01
Cc11.54±0.32
Cb22.93±0.21
Aa-2.15±0.08
Ac11.45±0.32
Ab22.13±0.17
Ba-2.29±0.01
Bc12.28±0.24
Bb22.01±0.17
Fa-2.08±0.03
Fc12.98±0.18
Fb19.31±0.15
Ea-1.42±0.15
Ec13.12±0.11
Eb18.15±0.08
Da-1.41±0.18
Dc12.74±0.06
DbNCP-1 L a b
31.58±0.05
Ba-1.32±0.13
Bc9.36±0.09
Bb29.88±0.03
Fa-1.45±0.18
Fc10.15±0.10
Fb28.76±0.05
Ea-1.68±0.10
Ec11.47±0.13
Eb26.34±0.13
Aa-1.84±0.01
Ac11.95±0.21
Ab25.3±0.03
Da-1.30±0.03
Dc12.05±0.04
Db23.14±0.05
Ca-1.35±0.0
Cc1 12.40±0.08
Cb1)
All values are mean ± SD of the triplicate determination. The mean in row (a-c) and a column (A-F) followed by different superscripts are significantly different at p<0.05 by Duncan’s range test.
mented vegetables like the commercial pickle is 3.56-6.75%, depending on the type [6]. However, since the NCP and NCP-1 in this study contained less than 3% salinity after 60 days of storage, it should be considered a relatively low-salt pickle.
Color measurement
The results of the color change of NCP and NCP-1 during storage are shown in Table 1. The L value, which indicates the lightness, was the highest at day 0 and the lowest at 60 days (p<0.05). Hence, the L value result shows that light- ness significantly decreased with longer storage period. The L value of lotus root pickle also decreased overtime[8], low-salt yacon added leaf mustard pickle and a low-salt ya- con with pepper pickle with yacon pickl showed decreased lightness ager 50 days of storage, the results of this are sim- ilar to that reported before. The a value of our NCP was increased from -1.41±0.18 to -2.29±0.01 and NCP-1 was in- creased from -1.3±0.03 to -1.84±0.01. In the result of Park et al [13], the inherent green color of salted cucumbers turned red and the a value increased over time in storage. This was similar to our results in that the a value was increased, but
NCP and NCP-1 stayed green, as seen by the naked eye, and did not changed red. The b the value of the NCP in- creased from 11.54±0.32 to 13.12±0.11 and the NCP increased from 9.36±0.09 to 12.4±0.08. The longer storage was time in- creased b values in low-salt yacon pickle added leaf mustard pickle with yacon, turnip pickles [15], and lotus root pickles [8]. Therefore, browning phenomenon progresses over pick- ling time that can be seen by the changes in L, a and b values.
Texture analysis
The hardness values of the NCP and NCP-1 are presented in Table 2. The tensile strength values of NCP was 10.9±0.05 kgf/cm
2at day 0 and then significantly decreased with time in storage. Also, the tensile strength values of NCP-1 was 11.84±0.11 kgf/cm
2at day 0 and then significantly decreased with time in storage The lowest hardness level (9.63±0.03 kgf/cm
2) was recorded after 90 days of storage. Lee at al [2] also reported decreased onion hardness after higher blanching temperatures. Cutting force of NCP was 1004±7.12 gf/cm
2and NCP-1 was 845±5.27 gf/cm
2at day 0, which in- creased over time in storage. After that, cutting force in- creased to 1574±11.95 and 1324±7.93 gf/cm
2(p<0.05), re- spectively. Thus, after the blanching heat treatment process, the change in volume, density, weight, and cell structure of plant tissues are related to differences in texture [1].
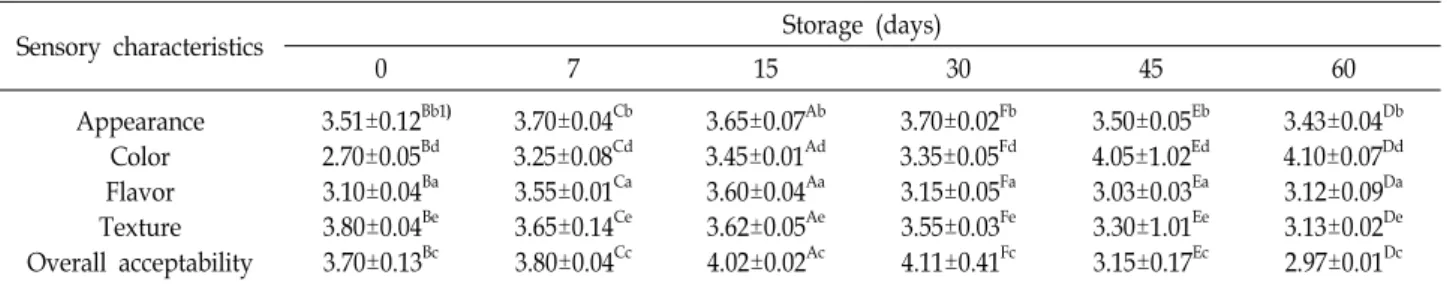
Sensory evaluation
The results of NCP and NCP-1 sensory evaluation are
shown in Table 3, 4. Over time, color was increasingly stron-
ger, and texture was gradually decreased with the longer
times in storage. Appearance showed similar results as a
whole. The overall acceptability of NCP was the highest at
day 30. But the overall acceptability of NCP-1 was the high-
est at day 45. At 10% salinity or greater, a fetid or soft phe-
Table 2. Changes in the tensile strength and cutting force at hardness of napa cabbage pickle and napa cabbage pickle-1 during storage
sample H
1)Storage (days)
0 7 15 30 45 60
NCP TS
3)CF
4)10.90±0.05
Ca2)1004±7.12
Cb10.82±0.15
Ea1258±5.47
Eb10.88±0.73
Aa1441±3.16
Ab10.70±0.82
Fa1487±4.66
Fb9.51±0.62
Da1562±5.92
Db9.16±0.13
Ba1574±11.95
BbNCP-1 TS
CF
11.84±0.11
Ab845±5.27
Aa11.65±0.03
Fb914±3.48
Fa11.54±0.08
Cb987±1.01
Ca10.94±0.34
Bb1054±5.07
Ba10.85±0.41
Db1235±5.34
Da9.72±0.31
Eb1324±7.93
Ea1)
Hardness
2)
All values are mean ± SD of the triplicate determination. The mean in row (a-b) and a column (A-F) followed by different superscripts are significantly different at p<0.05 by Duncan’s range test.
3)
Tensile strength (kgf/cm
2) in hardness.
4)
Cutting force (gf/cm
2) in hardness.
Table 3. Changes in the sensory evaluation of napa cabbage pickle during storage
Sensory characteristics Storage (days)
0 7 15 30 45 60
Appearance Color Flavor Texture Overall acceptability
3.51±0.12
Bb1)2.70±0.05
Bd3.10±0.04
Ba3.80±0.04
Be3.70±0.13
Bc3.70±0.04
Cb3.25±0.08
Cd3.55±0.01
Ca3.65±0.14
Ce3.80±0.04
Cc3.65±0.07
Ab3.45±0.01
Ad3.60±0.04
Aa3.62±0.05
Ae4.02±0.02
Ac3.70±0.02
Fb3.35±0.05
Fd3.15±0.05
Fa3.55±0.03
Fe4.11±0.41
Fc3.50±0.05
Eb4.05±1.02
Ed3.03±0.03
Ea3.30±1.01
Ee3.15±0.17
Ec3.43±0.04
Db4.10±0.07
Dd3.12±0.09
Da3.13±0.02
De2.97±0.01
Dc1)
All values are mean ± SD of the triplicate determination. The mean in row (a-e) and a column (A-F) followed by different superscripts are significantly different at p<0.05 by Duncan’s range test.
Table 4. Changes in the sensory evaluation of napa cabbage pickle-1 during storage
Sensory characteristics Storage (days)
0 7 15 30 45 60
Appearance Color Flavor Texture Overall acceptability
3.58±0.5
Ba1)3.17±0.05
Bb3.14±0.06
Bd3.80±0.04
Be3.65±0.11
Bc3.65±0.01
Fa3.40±0.05
Fb3.48±0.04
Fd3.65±0.05
Fe4.01±0.03
Fc3.74±0.05
Aa3.75±0.01
Ab3.65±0.05
Ad3.62±0.02
Aa4.07±0.14
Ac4.04±0.03
Ca3.35±0.05
Cb3.31±0.04
Cd3.55±0.03
Ca4.14±0.04
Cc3.85±0.08
Ea4.12±0.02
Eb3.37±0.02
Ed3.30±1.01
Ea4.25±0.10
Ec3.55±0.04
Da3.80±0.05
Db3.42±1.01
Dd3.13±0.02
Ds3.81±0.21
Dc1)
All values are mean ± SD of the triplicate determination. The mean in row (a-e) and a column (A-F) followed by different superscripts are significantly different at p<0.05 by Duncan’s range test.
nomenon is seen in pickles due to bacteria, fungi or yeasts [7]. However, since the salinity of our NCP and NCP-1 were less than 3%, they did not appear soft and fetid during storage. Therefore, we consider the low-salt napa cabbage pickling method to be a good method.
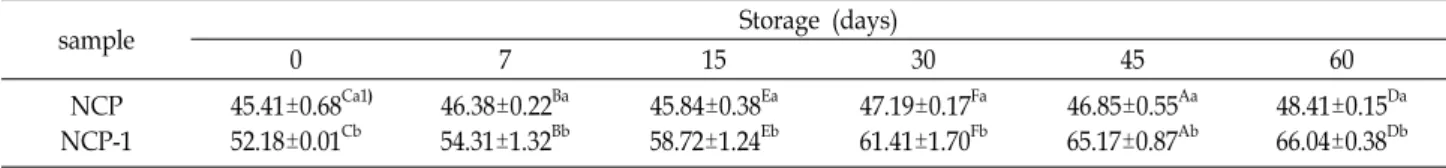
Antioxidant activity
The DPPH radical scavenging activity was measured to determine antioxidant activitiy of NCP and NCP-1 extracts (Table 5), which ranged 87.72±2.03 of control 0.02% BHT (v/v) (data not shown). The antioxidant activities was grad-
ually decreased with the longer times in storage. The anti-
oxidant activities from previous studies measured 43.28% in
fresh cabbage, respectively [5]. When compared to this re-
sult, the antioxidant activity in NCP and NCP-1 in the pres-
ent study was higher than was previously found in fresh
cabbage, but lower than that observed control. NCP-1 ex-
tracts at day 60 showed the highest antioxidant activity of
66.04%, whereas the NCP extract at day 0 showed the lowest
antioxidant activity of 45.41%. These results showed that an-
tioxidant activity differ depending on the content of the sea-
soning pickle. So the best pickled napa cabbage is de-
Table 5. DPPH radical antioxidant activities of of napa cabbage pickle and napa cabbage pickle-1 during storage
sample Storage (days)
0 7 15 30 45 60
NCP NCP-1
45.41±0.68
Ca1)52.18±0.01
Cb46.38±0.22
Ba54.31±1.32
Bb45.84±0.38
Ea58.72±1.24
Eb47.19±0.17
Fa61.41±1.70
Fb46.85±0.55
Aa65.17±0.87
Ab48.41±0.15
Da66.04±0.38
Db1)