1. Introduction
The urban heat island effect is one of the most serious urban environmental problems in the world.
The main reasons for higher temperature in cities are high energy consumption, the absorption of solar radiation by urban buildings, asphalt roads and other impervious materials during the day time. The absorbed heat re-radiates at night time (Voogt, 2003).
Hot urban areas increase energy usage and this increased energy usage causes temperature rise, repeating the vicious cycle.
There are certain urban landscape components that
can contribute to the mitigation of urban heat island effects. Since green spaces can cool down the temperature of urban areas, a better understanding about the configuration of these landscape components can help develop mitigation strategies for urban heat island effects. An analysis of the surface temperature maps is one approach to this understanding, as thermal data from remote sensing can provide important information. The early application of thermal remote sensing had focused mostly on surface water temperatures. However, recent studies of thermal remote sensing over urban areas began to pay attention to land cover types
A Preliminary Analysis of the Impact of Urban Green Spaces on the Urban Heat Island Effect Using a
Temperature Map
Soojeong Myeong†
Korea Adaptation Center for Climate Change, Korea Environment Institute, Seoul, Korea
Abstract :Temperature is one of the main issues in climate change, and the urban heat island effect in highly developed urban areas is an important issue that we need to deal with. This study analyzed the extent of the cooling effects of urban green spaces. The study used a surface temperature map of Seoul. It found that the cooling effects of green space was observed within limited distances, although it varied a little depending on the parks investigated. The cooling effect distance ranged from 240m to 360m, averaging about 300m. It also found the size of an urban green space does not make much difference in cooling the surrounding areas. Although further investigation with diverse urban areas should be conducted on this matter, the results did imply that many small green spaces in the neighborhood are more effective than a single big green space in mitigating the heat island effects of cities.
Key Words :urban heat island, temperature map, cooling effect, green space.
Received December 20, 2010; Revised December 24, 2010; Accepted December 25, 2010.
†Corresponding Author: Soojeong Myeong ([email protected])
(Chen et al., 2006; Voogt and Oke, 2003; Lougeay et al., 1996; Balling and Brazel, 1988; Lathrop and Lillesand, 1987).
This study uses thermal remote sensing in order to examine the extent to which urban green spaces influence the thermal environment of the city and seek implications for developing mitigation strategies for the urban heat island effect.
2. Assessing the Cooling Effects of Green Spaces
The study used the thermal infrared band of remotely sensed imagery to develop a temperature map of Seoul, and selected five parks to investigate the temperature changes in their vicinities.
1) Study Area
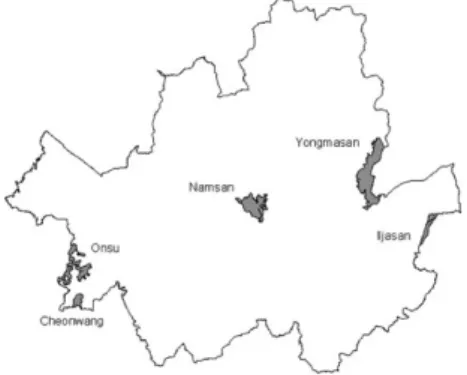
As the urban landscape consists of various kinds of components, such as buildings, roads, parks, and rivers, the remote sensing data of an urban area should be selectively used in order to examine the cooling effects of green spaces. This study chose the following five parks in the Seoul area: the Iljasan Park, the Cheonwangsan Park, the Onsu Park, the Yongmasan Park, and the Namsan Park (Fig. 1).
Iljasan and Yongmasan are located along the eastern
city limit. While Iljasan is near the residential area, Yongmasan is surrounded by less developed areas with another mountain not far away. Cheonwangsan and the Onsu Park are located near the western city limit and are relatively close to each other. Both are surrounded by residential and commercial areas.
Namsan is located right in the middle of the city, surrounded by highly developed and very crowded urban areas, with shops, offices and high-rise apartment buildings.
2) Generating a Temperature Map
This study used Landsat TM data of September 13th of 2006 to develop a temperature map. The following equation was used to extract temperature information (NASA; Chander and Markham, 2003).
Ll= ( )Qcal+ LMINl
where
Ll= spectral radiance at the sensor’s aperture in W/(m2·sr·mm)
Qcal= quantized calibrated pixel value in DNs Qcal min= minimum quantized calibrated pixel value
(DN = 0) corresponding to LMINl
Qcal max= maximum quantized calibrated pixel value (DN = 255) corresponding to LMAXl LMINl= spectral radiance that is scaled to Qcal minin
W/(m2·sr·mm)
LMAXl= spectral radiance that is scaled to Qcal maxin W/(m2·sr·mm)
Spectral radiance was converted to effective at- satellite temperature using the following conversion formula.
T =
where T is effective at-satellite temperature in Kelvin (K), K1is the calibration constant 1, 607.76 W/(m2sr mm), and K2 is the calibration constant 2 in Kelvin, 1260.56. The temperature in Celsius was obtained
LMAXl_LMINl
Qcal max
K2
ln(KLl1+ 1)
Fig. 1. Five Parks Selected for the Current Study.
through the following equation.
T(˚C) = T + 273.15
The temperature map of the study area with selected greenspaces is shown in Fig. 2.
3) Assessing the Cooling Effect
The researcher assessed the cooling effect distance by setting layers of buffers of greenspaces. Buffers were made for every 30m from the boundary of each park to 420m in order to examine the temperature change from park boundary to the surrounding areas.
Then, the mean temperature of each buffer was measured. The cooling effect distance was defined as the distance where the temperature increase stops. In other words, the cooling effect distance is where the relative temperature is lower than surrounding areas.
The temperature distribution around each park is shown in Fig. 3.
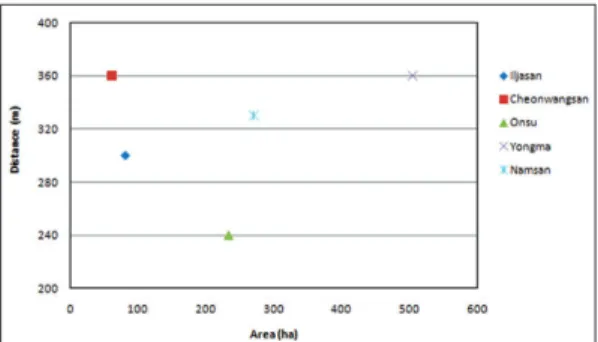
The temperature distribution from the park boundaries shows diverse patterns. And yet, the temperature increased incrementally as the distance from the park boundary increased, and from a certain distance the temperature tended to be stabilized. The cooling effect distance was found to be 300m (Iljasan), 360m (Cheonwangsan), 240m (Onsu), 360m (Yongmasan), and 330m (Namsan). On average, about 300m is the cooling effect distance from the selected green spaces of the study. However, the effect of green space on urban cooling is a complicated function of many variables, and those variables cannot easily be identified completely. The size of green space was hypothesized to be one of those variables. This study examined the effect of green space size on urban heat distribution (Fig. 4).
As Fig. 4 shows, the size of green space does not seem to have a strong correlation with the cooling effect distance. Some possible interpretations can be made. First, the size of the park itself may not mean much unless the adjacent areas are taken into consideration. For example, although the Cheonwangsan Park itself is small, it is neighbored by small hills scattered around. Therefore, the cooling effect distance can be as big as those of other bigger parks. The same is true with the Iljasan Park. The Iljasan Park within the city limit of Seoul is small, but it is neighbored by hills in the vicinity. Second, in case of the Onsu Park, which has the smallest cooling Fig. 2. A Temperature Map of the Study Area with park and
buffer boundary (Unit: ˚C).
Fig. 3. The Temperature Distribution from Park Boundaries.
Fig. 4. Cooling Effect Distances and Green Space Sizes.
effect distance, the shape of the park may be the cause. Although the overall size of the park is larger than those of the Cheonwangsan Park and the Iljasan Park, its shape is like small patches of green spaces linked by narrow strips. Therefore, the cooling effect of those small patches of green space may be dissipated. Third, the surroundings themselves may be different. In the present study, the cooling effect distance seems to be affected by the land-cover types of the surrounding areas. That is, the distance was short if the surrounding areas were highly populated residential areas or crowded commercial areas, while it was long if the surrounding areas was less densely populated. A more careful examination of these factors is needed.
3. Discussion and Conclusion
The results of this study have important implications in terms of urban land use planning to mitigate the urban heat island effects. It should be noted that the cooling effect of urban green spaces seems to be limited. Usually it did not work after 300 or 400 meters from the boundaries of green spaces.
This implies that green spaces had better be made within the neighborhood levels.
This study also showed that the size of green space does not affect the cooling distance. However, as discussed above, this result needs to be examined more carefully, as the result contradicts that of Rosenzweig’s (2007) study which found a positive relationship between the park size and the cooling effect distance. Rosenzweig (2007) found that the Central Park of the New York City, with its size of 850 acres, had about 60 meters of cooling effect, whereas the Bryant Park, whose size is only about 5 acres, had 15 meters of cooling effect distance.
Nevertheless, the results imply an important climate
change adaptation strategy in urban structures; it would be a good urban planning policy to accomodate properly-sized green spaces at every certain distance.
This study examined the extent of the cooling effects of urban green spaces on the thermal environment of Seoul. The study found that the cooling effect distance of the studied parks in Seoul ranged from 240m to 360m, averaging about 300m.
The size of the green space did not seem to affect the cooling effect distance. The study has some implications on strategies of mitigating urban heat island effects. Since the cooling effect distance is rather limited, developing more green spaces in neighborhood areas is suggested for a more effective mitigation of urban heat island effects.
This study has a limitation because it considered a single land cover type and did not consider the mixture effect of other cover types. In the future, more research should be conducted using other thermal imageries with higher spatial resolution on diverse types of urban areas. Yuan and Bauer(2007) compared percentages of impervious surfaces using NDVI as an indicator of surface urban heat island effects. More sophisticated land cover information should be included in the future studies considering percentages of impervious surfaces. The complicated effects of other land uses should be also considered when developing mitigating strategies of urban heat island effects. A second limitation is that the study made use of only one-time imagery. The results are rather preliminary and ad hoc. Therefore, is may be premature to make a conclusion on the effects of green spaces on the urban heat island effect. Future studies are necessary based on analyses of the time series imageries, seasonal variation of green spaces, and the degree of the development of the surrounding areas.
More extreme temperatures are expected as the
climate change continues (IPCC, 2007; Stern, 2006).
With this increasing probability of heat waves, urban areas, where frequent heat island effects are occurring, especially in summer, are more vulnerable than other settlement areas or other types of land usage. Therefore, it will be necessary to develop proper and efficient strategies to mitigate urban heat island effects and also to adapt climate changes. The results of this study will be useful for urban environmental management in mitigating urban heat island effects. Without the assistance of remote sensing, it would be very difficult to find the urban landscape layout. Temperature maps from remote sensing are indispensible for this kind of analysis.
Improvement in spatial resolution in thermal data would allow a big progress in the application of urban remote sensing.
Acknowledgment
This study was supported by Korea Environment Institute under the Basic Research Program (2009- 08).
References
Balling, R. C. and S. W. Brazel, 1988. High- resolution surface-temperature patterns in a complex urban terrain. Photogrammetric Engineering and Remote Sensing, 54: 1289 - 1293.
Chander, G. and B. Markham, 2003. Revised Landsat-5 TM Radiometric Calibration procedures and postcalibration dynamic ranges. IEEE Transactions on Geoscience and remote sensing, 41(11): 2674 - 2677.
Chen, X., H. Zhao, P. Li, Z, Yin, 2006. Remote
sensing image-based analysis of the relationship between urban heat island and land use/cover changes. Remote Sensing of Environment. 104(2): 133-146.
IPCC, 2007. Climate Change 2007: Impact, adaptation and vulnerability. Parry, M.L., O.F. Canziani, J.P. Palutikof, P.J. van der Linden and C.E. Hanson (eds). Cambridge University Press. Cambridge, UK and New York, NY, US.
Lathror, R. J. and T. M. Lillesand, 1987. Calibration of Thematic Mapper Thermal Data for Water Surface Temperature Mapping: Case study on the Great lakes. Remote Sensing of Environment, 22: 297 - 307.
Lougeay, R., A. Brazel, and M. Hubble, 1996.
Monitoring intra-urban temperature patters and associated land cover in Phoenix, Arizona using Landsat thermal data. Geocarto International, 11: 79-89.
NASA. Landsat science data users handbook.
http://ltpwww.gsfc.nasa.gov/
Rosenzweig. C., 2007. Environmental monitoring, evaluation, protection program. New York State Energy Research and Development Authority.
Smit, B., O. Pilifosova, I. Burton, B. Challenge, S.
Huq, R. J. Klein, and T. Yohe, 2001.
Adaptation to climate change in the context of sustainable development and equity; in Climate change 2001: Impacts, Adaptation and Vulnerability.
Steel, T. J. and K. Pye, 1997. The development of salt marsh tidal creek networks: Evidence from the UK, in Proceedings of the Canadian Coastal Conference, pp.267-280, CCSEA.
Stern, N., 2006. Stern Review: The Economics of Climate Change. Cambridge University Press.
Voogt, J. A. and T. R. Oke., 2003. Thermal remote sensing of urban climate, Remote Sensing of Environment, 86(3): 3790-384.
Yuan, F. and M. E. Bauer, 2007. Comparison of impervious surface area and normalized
difference vegetation index as indicators of surface urban heat island effect in Landsat imagery. Remote Sensing of Environment, 106: 375 - 386.