• 검색 결과가 없습니다.

Long-term Efficacy of S-1 Monotherapy or Capecitabine Plus Oxaliplatin as Adjuvant Chemotherapy for Patients with Stage II or III Gastric Cancer after Curative Gastrectomy: a Propensity Score-Matched Multicenter Cohort Study

N/A
N/A
Protected

Academic year: 2021

Share "Long-term Efficacy of S-1 Monotherapy or Capecitabine Plus Oxaliplatin as Adjuvant Chemotherapy for Patients with Stage II or III Gastric Cancer after Curative Gastrectomy: a Propensity Score-Matched Multicenter Cohort Study"

Copied!
13
0
0

로드 중.... (전체 텍스트 보기)

전체 글

(1)

https://jgc-online.org 152

ABSTRACT

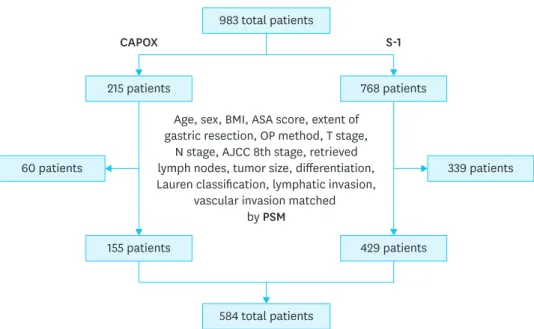
Purpose: To compare long-term disease-free survival (DFS) between patients receiving tegafur/gimeracil/oteracil (S-1) or capecitabine plus oxaliplatin (CAPOX) adjuvant chemotherapy (AC) for gastric cancer (GC).

Original Article

Chang Min Lee 1 , Moon-Won Yoo 2 , Young-Gil Son 3 , Sung Jin Oh 4 , Jong-Han Kim 1 , Hyoung-Il Kim 5 , Joong-Min Park 6 , Hoon Hur 7 , Ye Seob Jee 8 , Sun-Hwi Hwang 9 , Sung-Ho Jin 10 , Sang Eok Lee 11 , Ji-Ho Park 12 , Kyung Won Seo 13 , Sungsoo Park 1 , Chang Hyun Kim 14 , In Ho Jeong 15 , Han Hong Lee 16 , Sung Il Choi 17 , Sang-Il Lee 18 , Chan Young Kim 19 , In-Hwan Kim 20 , Myoung-Won Son 21 , Kyung Ho Pak 22 , Sungsoo Kim 15 , Moon-Soo Lee 23 , Jae-Seok Min 24

1

Department of Surgery, Korea University College of Medicine, Seoul, Korea

2

Department of Surgery, Asan Medical Center, University of Ulsan College of Medicine, Seoul, Korea

3

Department of Surgery, Keimyung University Dongsan Hospital, Keimyung University School of Medicine, Daegu, Korea

4

Department of Surgery, Inje University Haeundae Paik Hospital, Inje University College of Medicine, Busan, Korea

5

Department of Surgery, Yonsei University College of Medicine, Seoul, Korea

6

Department of Surgery, Chung-Ang University College of Medicine, Seoul, Korea

7

Department of Surgery, Ajou University School of Medicine, Suwon, Korea

8

Department of Surgery, Dankook University Hospital, Cheonan, Korea

9

Department of Surgery, Pusan National University Yangsan Hospital, Yangsan, Korea

10

Department of Surgery, Korea Cancer Center Hospital, Seoul, Korea

11

Department of Surgery, Konyang University Hospital, Daejeon, Korea

12

Department of Surgery, Gyeongsang National University Hospital, Jinju, Korea

13

Department of Surgery, Kosin University College of Medicine, Busan, Korea

14

Department of Surgery, Incheon St. Mary's Hospital, College of Medicine, The Catholic University of Korea, Incheon, Korea

15

Department of Surgery, Jeju National University Hospital, Jeju, Korea

16

Department of Surgery, Seoul St. Mary's Hospital, College of Medicine, The Catholic University of Korea, Seoul, Korea

17

Department of Surgery, Kyung Hee University Hospital at Gangdong, Seoul, Korea

18

Department of Surgery, Chungnam National University College of Medicine, Daejeon, Korea

19

Department of Surgery, Chonbuk National University College of Medicine, Jeonju, Korea

20

Department of Surgery, Daegu Catholic University College of Medicine, Daegu, Korea

21

Department of Surgery, Soonchunhyang University Cheonan Hospital, Cheonan, Korea

22

Department of Surgery, Hallym University Dongtan Sacred Heart Hospital, Hwaseong, Korea

23

Department of Surgery, Eulji University Hospital, Daejeon, Korea

24

Department of Surgery, Dongnam Institute of Radiological and Medical Sciences, Cancer Center, Busan, Korea

Long-term Efficacy of S-1 Monotherapy or Capecitabine Plus Oxaliplatin as Adjuvant Chemotherapy for Patients with Stage II or III Gastric Cancer after Curative Gastrectomy: a Propensity

Score-Matched Multicenter Cohort Study

Received: Dec 19, 2019 Revised: Mar 11, 2020 Accepted: Mar 11, 2020 Correspondence to Jae-Seok Min

Department of Surgery, Dongnam Institute of Radiological and Medical Sciences, Cancer Center, 40 Jwadong-gil, Busan 46033, Korea.

E-mail: [email protected]

Copyright © 2020. Korean Gastric Cancer Association

This is an Open Access article distributed under the terms of the Creative Commons Attribution Non-Commercial License (https://

creativecommons.org/licenses/by-nc/4.0) which permits unrestricted noncommercial use, distribution, and reproduction in any medium, provided the original work is properly cited.

ORCID iDs Chang Min Lee

https://orcid.org/0000-0003-2567-5533 Jae-Seok Min

https://orcid.org/0000-0002-5798-4595 Funding

This study was funded by the Korean Gastric Cancer Association, Republic of Korea (grant KGC0118C1).

Author Contributions

Conceptualization: M.J.S.; Data curation:

M.J.S.; Formal analysis: M.J.S., L.C.M.; Funding

acquisition: M.J.S.; Investigation: L.C.M.,

Y.M.W., S.Y.G., O.S.J., K.J.H., K.H.I., P.J.M.,

H.H., J.Y.S., H.S.H., J.S.H., L.S.E., P.J.H.,

S.K.W., P.S., K.C.H., J.I.H., L.H.H., C.S.I., L.S.I.,

K.C.Y., K.I.H., S.M.W., P.K.H., K.S., L.M.S.,

M.J.S.; Methodology: M.J.S., L.C.M.; Project

(2)

administration: M.J.S., L.C.M.; Resources:

L.C.M., Y.M.W., S.Y.G., O.S.J., K.J.H., K.H.I., P.J.M., H.H., J.Y.S., H.S.H., J.S.H., L.S.E., P.J.H., S.K.W., P.S., K.C.H., J.I.H., L.H.H., C.S.I., L.S.I., K.C.Y., K.I.H., S.M.W., P.K.H., K.S., L.M.S., M.J.S.; Software: M.J.S., L.C.M.; Supervision:

L.C.M., Y.M.W., S.Y.G., O.S.J., K.J.H., K.H.I., P.J.M., H.H., J.Y.S., H.S.H., J.S.H., L.S.E., P.J.H., S.K.W., P.S., K.C.H., J.I.H., L.H.H., C.S.I., L.S.I., K.C.Y., K.I.H., S.M.W., P.K.H., K.S., L.M.S., M.J.S.; Validation: M.J.S., L.C.M.; Visualization:

L.C.M., Y.M.W., S.Y.G., O.S.J., K.J.H., K.H.I., P.J.M., H.H., J.Y.S., H.S.H., J.S.H., L.S.E., P.J.H., S.K.W., P.S., K.C.H., J.I.H., L.H.H., C.S.I., L.S.I., K.C.Y., K.I.H., S.M.W., P.K.H., K.S., L.M.S., M.J.S.; Writing - original draft: M.J.S., L.C.M.;

Writing - review and editing: L.C.M., Y.M.W., S.Y.G., O.S.J., K.J.H., K.H.I., P.J.M., H.H., J.Y.S., H.S.H., J.S.H., L.S.E., P.J.H., S.K.W., P.S., K.C.H., J.I.H., L.H.H., C.S.I., L.S.I., K.C.Y., K.I.H., S.M.W., P.K.H., K.S., L.M.S., M.J.S.

Conflict of Interest

No potential conflict of interest relevant to this article was reported.

Materials and Methods: This retrospective multicenter observational study enrolled 983 patients who underwent curative gastrectomy with consecutive AC with S-1 or CAPOX for stage II or III GC at 27 hospitals in Korea between February 2012 and December 2013.

We conducted propensity score matching to reduce selection bias. Long-term oncologic outcomes, including DFS rate over 5 years (over-5yr DFS), were analyzed postoperatively.

Results: The median and longest follow-up period were 59.0 and 87.6 months, respectively.

DFS rate did not differ between patients who received S-1 and CAPOX for pathologic stage II (P=0.677) and stage III (P=0.899) GC. Moreover, hazard ratio (HR) for recurrence did not differ significantly between S-1 and CAPOX (reference) in stage II (HR, 1.846; 95% confidence interval [CI], 0.693–4.919; P=0.220) and stage III (HR, 0.942; 95% CI, 0.664–1.337; P=0.738) GC. After adjustment for significance in multivariate analysis, pT (4 vs. 1) (HR, 11.667; 95%

CI, 1.595–85.351; P=0.016), pN stage (0 vs. 3) (HR, 2.788; 95% CI, 1.502–5.174; P=0.001), and completion of planned chemotherapy (HR, 2.213; 95% CI, 1.618–3.028; P<0.001) were determined as independent prognostic factors for DFS.

Conclusions: S-1 and CAPOX AC regimens did not show significant difference in over-5yr DFS after curative gastrectomy in patients with stage II or III GC. The pT, pN stage, and completion of planned chemotherapy were prognostic factors for GC recurrence.

Keywords: Gastric cancer; Adjuvant chemotherapy; Disease-free survival

INTRODUCTION

Among various agents for adjuvant chemotherapy (AC) after curative radical gastrectomy in patients with stage II and III gastric cancer (GC), tegafur/gimeracil/oteracil (S-1) and capecitabine plus oxaliplatin (CAPOX) predominate owing to their remarkable oncologic outcomes in 2 multicenter randomized controlled trials (RCTs) proving the efficacy of ACs [1,2]. Most physicians or surgical oncologists, especially in Asia, follow similar strategies to select AC regimen for GC; in general, the selection is based on the clinicopathologic status of a patient. Although the efficacies of S-1 and CAPOX regimens could not be compared directly by the 2 previous RCTs, a subgroup analysis of these trials proposed the indications of AC regimens. The CAPOX regimen tended to be administered to patients with relatively higher stages of GC, whereas S-1 monotherapy was administered to less advanced cases. These strategies come from the assumption that CAPOX, a doublet regimen, might be superior over S-1 monotherapy in terms of oncologic outcomes.

However, these strategies are not based on reliable studies that directly compare both regimens. This issue has remained controversial because the therapeutic effects of the 2 AC regimens have not been verified by a high-quality evidence extracted from multicenter RCTs involving both regimens. In addition, we have no scientific basis to determine whether either of the 2 regimens is more effective than the other in terms of long-term oncologic outcomes. This issue remains unresolved owing to difficulties in performing prospective comparative trials due to commercial and other challenges.

For these reasons, the Surgical Oncology Forum study group launched a multicenter retrospective study to compare disease-free survival (DFS) rates at 3 years after surgery between patients receiving S-1 monotherapy and those receiving CAPOX doublet

chemotherapy [3]. The results showed that in patients with relatively higher-stage disease,

CAPOX was associated with higher DFS than S-1 monotherapy. Although CAPOX regimen

Adjuvant Chemotherapy for Gastric Cancer

(3)

may be superior to S-1 monotherapy in terms of 3-year DFS rates in patients with high-stage disease, there is still no evidence that CAPOX is superior to S-1 monotherapy in terms of outcomes after long-term follow-up in these patients. The results of the previous studies investigated the relatively short-term oncologic outcomes rather than the long-term efficacy of these 2 AC regimens.

Therefore, the present propensity score-matched multicenter cohort study compared the long-term oncologic results over 5 years (over-5yr DFS) after curative resection between patients who received AC with S-1 or CAPOX. To the best of our knowledge, this was the first multicenter cohort study to evaluate the long-term recurrence outcomes (over-5yr DFS) of 2 AC regimens in patients with GC after curative gastrectomy.

MATERIALS AND METHODS

Patients

This study included data from 983 patients who underwent curative resection and received AC for GC between January 2012 and December 2013 at 27 hospitals in the Republic of Korea.

The enrolled patients underwent R0 resection by radical gastrectomy with D2 or more lymph node dissection according to guidelines [4,5].

Eligible patients 1) were 20 years of age or older; 2) had histologically proven stage II or III GC after radical gastrectomy based on the 8th edition of American Joint Committee on Cancer (AJCC) cancer staging system; 3) had received S-1 monotherapy or CAPOX regimen as an AC within 8 weeks after surgery; 4) had not received preoperative chemotherapy, radiotherapy, or immunotherapy; 5) did not have synchronous or metachronous cancer;

6) did not have distant metastasis; and 7) did not have tumor cells according to peritoneal washing cytologic examination [6].

Study design and data collection

We reviewed the clinical status data and medical records of all participating institutions in May 2019. The primary endpoint was over-5yr DFS after curative gastrectomy. DFS was defined as the time elapsed from the operation date to the recurrence date or the time of the last follow-up. The study protocol was approved by the Institutional Review Board of the Institute of Radiological and Medical Sciences, Busan, Republic of Korea (No. D-1902-031- 002), which waived the requirement for written informed consent from the patients owing to the retrospective study design.

AC regimens

The AC treatments were initiated within 4–8 weeks after curative resection. The chemotherapeutic regimens were administered as described by the ACTS-GC and the CLASSIC trial [1,2]. Patients in the S-1 group received the treatment at a dose of 40, 50, or 60 mg twice daily. The dose was determined based on the body surface area of each individual patient. Each S-1 cycle included drug administration for 4 weeks, followed by 2 weeks of rest;

the 6-week cycle was repeated for a total of 8 cycles. Patients in the CAPOX group received 3-week cycles of oral capecitabine (1,000 mg/m

2

twice daily on days 1–14 of each cycle) plus intravenous oxaliplatin (130 mg/m

2

on day 1 of each cycle) for a total of 8 cycles. Reductions of doses, modifications of schedules, or interruptions of AC were conducted based on a clinician's decision considering the events that occurred during AC.

https://jgc-online.org https://doi.org/10.5230/jgc.2020.20.e13 154

(4)

Follow-up

The patients underwent follow-up examinations including abdominal computed tomography (CT) scan and/or endoscopy to detect GC recurrence. After AC completion, follow-up medical consultations, history-taking, physical examinations, and clinical evaluations were recommended every 3–4 months for 2 years and then every half-year for the subsequent 2 years. After approximately 5 years following surgery, assessments were performed annually or once every 2 years. The follow-up evaluations included measurement of gastrointestinal tumor markers, simple chest X-ray, abdominal and pelvic enhanced CT scan (AP-CT), and upper gastrointestinal endoscopy. Abdominal ultrasonography, chest CT scan, abdominal magnetic resonance imaging, positron emission tomography scan, and bone scan were additionally performed when AP-CT revealed equivocal abnormalities.

Statistical analysis

Propensity score matching (PSM) based on binary logistic regression was used to minimize selection bias caused by imbalanced variables in the historical cohort study (Fig. 1). The propensity score model considered clinicopathological characteristics including patients' age, sex, American Society of Anesthesiologists (ASA) score, extent of gastrectomy, operation method, T stage, N stage, stage according to the 8th AJCC staging system, retrieved lymph nodes, tumor size and differentiation, Lauren's classification, and lymphatic and vascular invasion. We performed 1:3 matching between the S-1 and CAPOX groups using the nearest- neighbor matching method without replacement.

IBM SPSS Statistics for Windows, version 19.0 (IBM Corp., Armonk, NY, USA) was used for statistical analyses. The chi-square test was used to compare baseline characteristics between the 2 groups. The Kaplan–Meier method was used to estimate cumulative DFS with 95%

confidence intervals (CIs). Breslow or 2-sided log-rank test was used to compare DFS rate between the treatment groups. Significant factors in the univariate analysis were included in Adjuvant Chemotherapy for Gastric Cancer

983 total patients

584 total patients

215 patients 768 patients

339 patients 60 patients

155 patients 429 patients

Age, sex, BMI, ASA score, extent of gastric resection, OP method, T stage,

N stage, AJCC 8th stage, retrieved lymph nodes, tumor size, differentiation, Lauren classification, lymphatic invasion,

vascular invasion matched by PSM

CAPOX S-1

Fig. 1. Flowchart of PSM.

CAPOX = capecitabine and oxaliplatin; S-1 = tegafur/gimeracil/oteracil; BMI = body mass index; ASA = American

Society of Anesthesiologists; OP = operation; AJCC = American Joint Committee on Cancer; PSM = propensity

score matching.

(5)

the multivariate analysis, and the hazard ratios (HRs) for recurrence in the S-1 group, with the CAPOX group as a reference, were analyzed using the Cox proportional hazards model.

P-values less than 0.05 were considered statistically significant.

RESULTS

Patient baseline characteristics

The median and longest follow-up periods were determined to be 59.2 and 87.6 months, respectively, before PSM and 59.0 and 87.6 months, respectively, after PSM until the cutoff date of April 31, 2019. Table 1 presents the baseline characteristics of patients in the S-1 and CAPOX groups. Before PSM (n=983), some clinicopathologic variables differed significantly between the 2 groups. Patients in the S-1 group were older (P<0.001); more commonly underwent a minimally invasive approach (P<0.001); had less advanced pathologic T, N, and AJCC 8th stages (P=0.016, P<0.001, P<0.001); had smaller tumor size (P<0.001); more commonly had intestinal-type Lauren classification (P=0.007); less often had lymphatic or vascular invasion (P=0.007, P=0.002); and less often completed the planned chemotherapy (P=0.027) compared with those in the CAPOX group. After PSM (n=584, Fig. 1), to reduce the bias caused by the historical nature of the cohort study, no significant differences in baseline characteristics were observed between the S-1 and CAPOX groups.

156 https://jgc-online.org https://doi.org/10.5230/jgc.2020.20.e13

Table 1. Baseline characteristics of patients in S-1 and CAPOX groups

Variables Before PSM (n=983) After PSM (n=584)

S-1 (n=768) CAPOX (n=215) P-value Standardized

difference S-1 (n=429) CAPOX (n=155) P-value Standardized difference

Age (yr) <0.001 * 0.343 0.907 0.011

<60 313 (40.76) 124 (57.67) 208 (48.48) 76 (49.03)

≥60 455 (59.24) 91 (42.33) 221 (51.52) 79 (50.97)

Sex 0.091 0.133 0.237 0.112

Male 518 (67.45) 158 (73.49) 285 (66.43) 111 (71.61)

Female 250 (32.55) 57 (26.51) 144 (33.57) 44 (28.39)

BMI (kg/m

2

) 0.982 0.002 0.394 0.081

≤23 371 (48.5) 103 (48.58) 211 (49.41) 69 (45.39)

>23 394 (51.5) 109 (51.42) 216 (50.59) 83 (54.61)

ASA score 0.440 0.137 0.499 0.152

1 267 (34.86) 86 (40) 168 (39.25) 60 (38.71)

2 407 (53.13) 105 (48.84) 216 (50.47) 74 (47.74)

3 89 (11.62) 24 (11.16) 42 (9.81) 21 (13.55)

4 3 (0.39) 0 (0) 2 (0.47) 0 (0)

Extent of gastric resection 0.946 0.005 0.530 0.059

Subtotal gastrectomy 502 (65.36) 140 (65.12) 273 (63.64) 103 (66.45)

Total gastrectomy 266 (34.64) 75 (34.88) 156 (36.36) 52 (33.55)

Operation approach method <0.001 * 0.305 0.530 0.018

Open 605 (78.78) 193 (89.77) 273 (63.64) 103 (66.45)

Laparoscopy or robot 163 (21.22) 22 (10.23) 156 (36.36) 52 (33.55)

pT stage 0.016 * 0.254 0.978 0.042

T1 42 (5.47) 6 (2.79) 18 (4.2) 6 (3.87)

T2 120 (15.63) 24 (11.16) 61 (14.22) 23 (14.84)

T3 370 (48.18) 97 (45.12) 185 (43.12) 69 (44.52)

T4 236 (30.73) 88 (40.93) 165 (38.46) 57 (36.77)

pN stage <0.001 * 0.661 0.811 0.093

N0 186 (24.22) 17 (7.91) 57 (13.29) 17 (10.97)

N1 184 (23.96) 25 (11.63) 64 (14.92) 25 (16.13)

N2 172 (22.4) 60 (27.91) 113 (26.34) 45 (29.03)

N3 226 (29.43) 113 (52.56) 195 (45.45) 68 (43.87)

(continued to the next page)

(6)

DFS and HRs for recurrence after PSM

After PSM, no differences in DFS rate for pathologic stage II (P=0.677) and III (P=0.899) GC were observed between the S-1 and CAPOX groups (Fig. 2). In patients with stage II GC, the DFS rates were 85.4% (95% CI, 82.3%–88.5%) in the S-1 group and 89.3% (95% CI, 82.6%–

96.0%) in the CAPOX group. In patients with stage III GC, the DFS rates were 56.0% (95%

CI, 53.2%–58.8%) in the S-1 group and 56.2% (95% CI, 50.5%–61.9%) in the CAPOX group (Table 2). Subgroup analysis of stage III GC did not reveal significant differences in DFS rate for stage IIIA (P=0.784), IIIB (P=0.834), and IIIC (P=0.435) GC between the 2 groups.

No significant differences in recurrence according to the HR of S-1 compared with that of CAPOX as a reference for stage II (HR, 1.846; 95% CI, 0.693–4.919; P=0.220) and stage III (HR, 0.942; 95% CI, 0.664–1.337; P=0.738) GC were observed between groups (Table 3).

Subgroup analysis of patients with stage III GC showed HRs of S-1 for recurrence of 0.873 (95% CI, 0.466–1.635; P=0.671) for stage IIIA, 1.220 (95% CI, 0.571–2.610; P=0.608) for stage IIIB, and 0.813 (95% CI, 0.482–1.371; P=0.437) for stage IIIC. Fig. 3 shows forest plots from subgroup analysis of DFS for the 2 groups. The subgroup analysis did not reveal any significant differences in recurrence between the S-1 and CAPOX groups.

Adjuvant Chemotherapy for Gastric Cancer

Variables Before PSM (n=983) After PSM (n=584)

S-1 (n=768) CAPOX (n=215) P-value Standardized

difference S-1 (n=429) CAPOX (n=155) P-value Standardized difference

AJCC 8th stage <0.001 * 0.666 0.807 0.023

Stage II 415 (54.04) 50 (23.26) 143 (33.33) 50 (32.26)

Stage III 353 (45.96) 165 (76.74) 286 (66.67) 105 (67.74)

Retrieved lymph nodes 0.229 −0.059 0.380 −0.101

≤45 439 (57.16) 113 (52.56) 239 (55.71) 80 (51.61)

>45 329 (42.84) 102 (47.44) 190 (44.29) 75 (48.39)

Tumor size (cm) <0.001 * 0.260 0.384 0.082

≤5 430 (56.14) 93 (43.26) 214 (49.88) 71 (45.81)

>5 336 (43.86) 122 (56.74) 215 (50.12) 84 (54.19)

Differentiation 0.341 0.109 0.818 0.059

W or M 263 (34.24) 67 (31.16) 124 (28.9) 49 (31.61)

P or S 463 (60.29) 131 (60.93) 276 (64.34) 96 (61.94)

Others 42 (5.47) 17 (7.91) 29 (6.76) 10 (6.45)

Lauren classification 0.007 * 0.276 0.076 0.251

Intestinal 284 (40.34) 62 (34.44) 142 (35.86) 46 (35.94)

Diffuse 335 (47.59) 107 (59.44) 205 (51.77) 75 (58.59)

Mixed 85 (12.07) 11 (6.11) 49 (12.37) 7 (5.47)

Lymphatic invasion 0.007 * 0.220 0.781 0.027

No 263 (36.23) 54 (26.09) 113 (28.32) 44 (29.53)

Yes 463 (63.77) 153 (73.91) 286 (71.68) 105 (70.47)

Vascular invasion 0.002 * 0.236 0.511 0.063

No 507 (69.26) 120 (57.97) 267 (66.09) 94 (63.09)

Yes 225 (30.74) 87 (42.03) 137 (33.91) 55 (36.91)

Completion of planned

chemotherapy 0.027 * 0.174 0.908 0.011

Yes 503 (65.49) 158 (73.49) 294 (68.53) 107 (69.03)

No 265 (34.51) 57 (26.51) 135 (31.47) 48 (30.97)

Values are presented as number (%).

PSM = propensity score matching; S-1 = tegafur/gimeracil/oteracil; CAPOX = capecitabine plus oxaliplatin; BMI = body mass index; ASA = American society of anesthesiologist; AJCC 8th = 8th edition of American Joint Committee on Cancer; W = well-differentiated; M = moderately-differentiated; P = poorly- differentiated; S = signet ring cell carcinoma.

* Statistically significant with P<0.05.

Table 1. (Continued) Baseline characteristics of patients in S-1 and CAPOX groups

(7)

158 https://jgc-online.org https://doi.org/10.5230/jgc.2020.20.e13

Time after surgery (mo) P=0.677

A

DF S (%)

80

12 48 60

100

40

0 60

20

36 24

No. at risk CAPOX S-1

50 141

44 130

40 124

37 119

35 114

16 72 S-1

CAPOX

Time after surgery (mo) P=0.575

B

DF S (%)

80

12 48 60

100

40

0 60

20

36 24

No. at risk CAPOX S-1

17 66

17 61

12 59

12 58

12 57

4 34 S-1

CAPOX

Time after surgery (mo) P=0.265

C

DF S (%)

80

12 48 60

100

40

0 60

20

36 24

No. at risk CAPOX S-1

33 75

30 69

28 65

25 61

23 57

12 38 S-1

CAPOX

Time after surgery (mo) P=0.899

D

DF S (%)

80

12 48 60

100

40

0 60

20

36 24

No. at risk CAPOX S-1

103 285

81 218

66 170

57 149

53 136

36 88 S-1

CAPOX

Time after surgery (mo) P=0.784

E

DF S (%)

80

12 48 60

100

40

0 60

20

36 24

No. at risk CAPOX S-1

43 106

36 92

33 82

26 74

26 69

16 50 S-1

CAPOX

Time after surgery (mo) P=0.834

F

DF S (%)

80

12 48 60

100

40

0 60

20

36 24

No. at risk CAPOX S-1

32 94

27 70

24 53

23 43

21 37

16 21 S-1

CAPOX

Time after surgery (mo) P=0.435

Stage II Stage II A

Stage II B Stage III

Stage III A Stage III B

Stage III C G

DF S (%)

80

12 48 60

100

40

0 60

20

36 24

No. at risk CAPOX S-1

28 85

18 56

9 35

8 32

6 30

4 17 S-1

CAPOX

Fig. 2. DFS of patients with stage II and III gastric cancer according to adjuvant chemotherapy regimen; (A) stage II, (B) stage IIA, (C) stage IIB, (D) stage III, (E) stage IIIA, (F) stage IIIB, and (G) stage IIIC.

CAPOX = capecitabine and oxaliplatin; S-1 = tegafur/gimeracil/oteracil; DFS = disease-free survival. (continued to the next page)

(8)

Sites of recurrence after AC

Table 4 lists the major sites of GC recurrence after AC. The total incidences of recurrence were similar between the S-1 (32.9%) and CAPOX (31.6%) groups. Among the major sites of recurrence, there were no differences between the peritoneum (HR, 1.040; 95% CI, 0.633–

1.708; P=0.878), hematogenous sites (HR, 0.813; 95% CI, 0.398–1.659; P=0.568), lymph nodes (HR, 1.442; 95% CI, 0.710–2.928; P=0.311), and locoregional sites (HR, 1.471; 95% CI, 0.489–4.425; P=0.492) between groups.

Adjuvant Chemotherapy for Gastric Cancer Time after surgery (mo)

P=0.677

A

DF S (%)

80

12 48 60

100

40

0 60

20

36 24

No. at risk CAPOX S-1

50 141

44 130

40 124

37 119

35 114

16 72 S-1

CAPOX

Time after surgery (mo) P=0.575

B

DF S (%)

80

12 48 60

100

40

0 60

20

36 24

No. at risk CAPOX S-1

17 66

17 61

12 59

12 58

12 57

4 34 S-1

CAPOX

Time after surgery (mo) P=0.265

C

DF S (%)

80

12 48 60

100

40

0 60

20

36 24

No. at risk CAPOX S-1

33 75

30 69

28 65

25 61

23 57

12 38 S-1

CAPOX

Time after surgery (mo) P=0.899

D

DF S (%)

80

12 48 60

100

40

0 60

20

36 24

No. at risk CAPOX S-1

103 285

81 218

66 170

57 149

53 136

36 88 S-1

CAPOX

Time after surgery (mo) P=0.784

E

DF S (%)

80

12 48 60

100

40

0 60

20

36 24

No. at risk CAPOX S-1

43 106

36 92

33 82

26 74

26 69

16 50 S-1

CAPOX

Time after surgery (mo) P=0.834

F

DF S (%)

80

12 48 60

100

40

0 60

20

36 24

No. at risk CAPOX S-1

32 94

27 70

24 53

23 43

21 37

16 21 S-1

CAPOX

Time after surgery (mo) P=0.435

Stage II Stage II A

Stage II B Stage III

Stage III A Stage III B

Stage III C G

DF S (%)

80

12 48 60

100

40

0 60

20

36 24

No. at risk CAPOX S-1

28 85

18 56

9 35

8 32

6 30

4 17 S-1

CAPOX

Fig. 2. (Continued) DFS of patients with stage II and III gastric cancer according to adjuvant chemotherapy regimen; (A) stage II, (B) stage IIA, (C) stage IIB, (D) stage III, (E) stage IIIA, (F) stage IIIB, and (G) stage IIIC.

CAPOX = capecitabine and oxaliplatin; S-1 = tegafur/gimeracil/oteracil; DFS = disease-free survival.

Table 2. Disease free survival rates of S-1 and CAPOX groups according to stages (AJCC 8th) using log-rank test

Stages S-1 (n=429) CAPOX (n=155) P-value

All 66.1 (64.3–67.9) 66.5 (62.5–70.5) 0.961

Stage II

All of stage II 85.4 (82.3–88.5) 89.3 (82.6–96.0) 0.677

Stage IIA 92.1 (87.4–96.8) 92.3 (77.5–107.1) 0.575

Stage IIB 79.6 (74.3–84.9) 87.9 (78.8–97.0) 0.265

Stage III

All of stage III 56.0 (53.2–58.8) 56.2 (50.5–61.9) 0.899

Stage IIIA 72.1 (67.4–76.8) 62.2 (51.9–72.5) 0.784

Stage IIIB 52.5 (45.7–59.3) 74.5 (63.5–85.5) 0.834

Stage IIIC 38.9 (30.9–46.9) 26.0 (6.5–45.5) 0.435

Values are presented as disease free survival rates (95% confidence interval).

S-1 = tegafur/gimeracil/oteracil; CAPOX = capecitabine plus oxaliplatin; AJCC 8th = 8th edition of American Joint Committee on Cancer.

Table 3. HR of S-1 compared with CAPOX as reference for recurrence of gastric cancer

Stages HR 95% CI P-value

All 1.008 0.728–1.395 0.963

Stage II 1.846 0.693–4.919 0.220

Stage IIA 1.727 0.202–14.787 0.618

Stage IIB 2.140 0.710–6.450 0.176

Stage III 0.942 0.664–1.337 0.738

Stage IIIA 0.873 0.466–1.635 0.671

Stage IIIB 1.220 0.571–2.610 0.608

Stage IIIC 0.813 0.482–1.371 0.437

S-1 = tegafur/gimeracil/oteracil; CAPOX = capecitabine plus oxaliplatin; HR = hazard ratio; CI = confidence interval.

(9)

Risk factors for recurrence

In both uni- and multivariate analysis, we entered pT and pN stages instead of the AJCC 8th stage. Univariate analysis of risk factors revealed that patient age, ASA score, extent of gastric resection, operation approach method, pT and pN stages, tumor size, lymphatic and vascular invasions, and completion of planned chemotherapy were significant predictors related to DFS. After adjustment for meaningful factors in multivariate analysis, pT (4 vs. 1) (HR, 11.667; 95% CI, 1.595–85.351; P=0.016), pN stage (0 vs. 3) (HR, 2.788; 95% CI, 1.502–5.174;

P=0.001), and completion of planned chemotherapy (HR, 2.213; 95% CI, 1.618–3.028;

P<0.001) were revealed as independent prognostic factors for DFS (Table 5).

https://jgc-online.org https://doi.org/10.5230/jgc.2020.20.e13 160

Variables Total No.

of patients HR 95% CI P-value

Sex

Male 396 1.153 0.784–1.695 0.469

Female 188 0.750 0.408–1.378 0.355

Age

<60 284 0.971 0.595–1.584 0.906

≥60 300 1.011 0.654–1.564 0.959

ASA score

1 228 0.757 0.449–1.279 0.299

2 290 1.414 0.855–2.337 0.177

3 63 0.898 0.407–1.982 0.791

Extent of gastric resection

Subtotal gastrectomy 376 0.942 0.618–1.438 0.783

Total gastrectomy 208 1.084 0.649–1.810 0.759

pT stage

T2 84 1.302 0.424–3.994 0.644

T3 254 1.163 0.664–2.039 0.597

T4 222 0.875 0.570–1.344 0.543

pN stage

N0 74 0.648 0.203–2.070 0.464

N1 89 0.978 0.311–3.074 0.969

N2 158 0.732 0.366–1.461 0.376

N3 263 1.230 0.811–1.864 0.329

AJCC 8th stage

Stage II 193 1.050 0.420–2.623 0.916

Stage III 391 1.041 0.735–1.475 0.820

Tumor size (cm)

≤5 285 1.362 0.759–2.443 0.300

>5 299 0.890 0.599–1.322 0.564

S-1 better

CAPOX better 1

0.1 10

Fig. 3. Forest plot for subgroup analysis of disease-free survivals in S-1 and CAPOX groups.

CAPOX = capecitabine and oxaliplatin; S-1 = tegafur/gimeracil/oteracil; HR = hazard ratio; CI = confidence interval; ASA = American Society of Anesthesiologist;

AJCC 8th, 8th edition of American Joint Committee on Cancer.

Table 4. Major sites of recurrence after adjuvant chemotherapy for gastric cancers

Sites * S-1 CAPOX HR 95% CI P-value

Peritoneum 51 (11.8) 23 (14.8) 1.040 0.633–1.708 0.878

Hematogenous 34 (7.9) 11 (7.1) 0.813 0.398–1.659 0.568

Lymph nodes 45 (10.5) 10 (6.5) 1.442 0.710–2.928 0.311

Locoregional 11 (2.6) 5 (3.2) 1.471 0.489–4.425 0.492

Total No. of recurrences 141 (32.9) 49 (31.6) - - -

Values are presented as number (%).

S-1 = tegafur/gimeracil/oteracil; CAPOX = capecitabine plus oxaliplatin; HR = hazard ratio; CI = confidence interval.

* Some patients had recurrence more than one site at first relapse.

(10)

DISCUSSION

We compared the long-term efficacy of S-1 and CAPOX AC regimens for stage II or III GC based on PSM analysis from a multicenter historical cohort study over 5 years after surgery.

We did not identify any significant difference in over-5yr DFS between the 2 regimens. We also observed no significant differences between the 2 regimens in subgroup analysis. The pathologic stage and completion of planned chemotherapy were shown as independent prognostic factors for DFS.

Previous prominent prospective studies on AC for GCs, the ACTS-GC [1] and CLASSIC [2,7] trials, showed the efficacy of S-1 and CAPOX regimens compared with that of no chemotherapy. However, they did not directly compare the efficacies of both regimens.

Therefore, the difference in efficacy between the 2 regimens remained unknown. A recent retrospective multicenter study showed that the CAPOX AC regimen was more effective than S-1 in patients with stage IIIB or IIIC GC based on 3-year DFS [3]. Another retrospective single-center study showed that CAPOX tended to be more effective than S-1 in patients with stage IIIC GC after D2 gastrectomy, although the adjuvant CAPOX and S-1 regimens did not show any significant difference in patients with stage III GC [8]. Consequently, the single-center study concluded that pathologic N stage and cycle completion as planned were meaningful prognostic factors for recurrence, comparable to the results of the multivariate analysis in the present study.

We did not find any differences in survival between the 2 AC regimens for GC. However, previous retrospective studies reported that CAPOX chemotherapy may be superior to S-1 Adjuvant Chemotherapy for Gastric Cancer

Table 5. Univariate and multivariate analysis of risk factors for disease-free survival

Variable Univariate Multivariate

HR (95% CI) P-value HR (95% CI) P-value

Age (≥60) 1.433 (1.075–1.909) 0.014 * 1.014 (0.736–1.396) 0.933

Sex (male) 1.201 (0.877–1.643) 0.253 - -

BMI (>23) 1.014 (0.761–1.35) 0.927 - -

ASA score (2 vs. 1) 1.207 (0.884–1.649) 0.237 - -

ASA score (3 vs. 1) 1.840 (1.17–2.896) 0.008 * - -

ASA score (4 vs. 1) 2.577 (0.357–18.594) 0.348 - -

Extent of gastric resection (total) 1.538 (1.155–2.049) 0.003 * 1.151 (0.835–1.585) 0.391

Operation approach method (open) 1.647 (1.025–2.647) 0.039 * 1.132 (0.670–1.914) 0.643

pT stage (2 vs. 1) 5.133 (0.683–38.573) 0.112 5.260 (0.688–40.19) 0.110

pT stage (3 vs. 1) 7.555 (1.049–54.414) 0.045 * 7.043 (0.959–51.719) 0.055

pT stage (4 vs. 1) 15.243 (2.127–109.253) 0.007 * 11.667 (1.595–85.351) 0.016 *

pN stage (1 vs. 0) 0.797 (0.385–1.651) 0.541 0.942 (0.428–2.074) 0.881

pN stage (2 vs. 0) 1.180 (0.638–2.183) 0.598 1.204 (0.613–2.364) 0.590

pN stage (3 vs. 0) 3.072 (1.766–5.341) <0.001 * 2.788 (1.502–5.174) 0.001 *

Retrieved lymph nodes (>45) 0.846 (0.634–1.13) 0.258 - -

Tumor size (cm) (>5) 1.864 (1.39–2.5) <0.001 * 1.376 (0.983–1.928) 0.063

Differentiation (P/S vs. W/M) 1.076 (0.781–1.481) 0.655 - -

Differentiation (O vs. W/M) 1.050 (0.573–1.923) 0.876 - -

Lauren classification (D vs. I) 1.053 (0.759–1.461) 0.755 - -

Lauren classification (M vs. I) 1.064 (0.634–1.787) 0.814 - -

Lymphatic invasion 1.598 (1.11–2.299) 0.012 * 0.907 (0.589–1.396) 0.657

Vascular invasion 1.698 (1.257–2.292) 0.001 * 1.222 (0.867–1.723) 0.252

Incompletion of planned chemotherapy 2.552 (1.913–3.406) <0.001 * 2.213 (1.618–3.028) <0.001 *

HR = hazard ratio; CI = confidence interval; ASA = American society of anesthesiologist; BMI = body mass index; Differentiation: W = well-differentiated; M = moderately-differentiated; P = poorly-differentiated; S = signet ring cell carcinoma; O = others; Lauren classification: D = diffuse; I = intestinal; M = mixed.

* Statistically significant with P<0.05.

(11)

monotherapy in terms of efficacy on DFS [3]. This survival discrepancy might be due to the different AJCC stages, 7th or 8th, and the slight differences in planned AC completion rates between the past and present studies. A previous retrospective multicenter study investigated actual patient compliance to AC [9]. In line with this study, the actual completion rates of S-1 and CAPOX were 65.9% and 70.3%, respectively. In a retrospective multicenter observational study [3], the completion rates of planned AC were 79.76% and 76.37% in the S-1 and CAPOX groups, respectively, after PSM. We also performed PSM to reduce bias due to the retrospective nature of data collection, and observed planned AC completion rates of 68.53%

in the S-1 group and 69.03% in the CAPOX group. Another potential cause of discrepancies in survival might be the somewhat small numbers of patients in the CAPOX group (43, 32, and 28 patients with stage IIIA, IIIB, and stage IIIC GC, respectively), compared with those in the S-1 group (106, 94, and 85 patients with stage IIIA, IIIB, and stage IIIC GC, respectively).

In the present study, the HRs for GC recurrence of S-1 compared with those of CAPOX were below 1 in the subgroups of patients with stage III GC, at 0.873 (95% CI, 0.466–1.635;

P=0.671) for stage IIIA, and 0.813 (95% CI, 0.482–1.371; P=0.437) for stage IIIC, although the HRs did not reach statistical significance. Additional large-scale, prospective studies are needed to confirm these differences in survival.

Recent studies have reported the use of other AC regimens, such as S-1 with oxaliplatin and taxane. The RESCUE-GC study aimed to elucidate the efficacy of S-1 alone compared with that of S-1 plus oxaliplatin for AC in patients with locally advanced GC after curative gastrectomy [10]. The JACCRO GC-07 study is a prospective randomized phase III study that aimed to assess the effect of postoperative S-1 plus docetaxel over S-1 alone in patients with stage III GC [11]. The analysis clarified the superiority of S-1 plus docetaxel (66%) over S-1 (50%) in terms of 3-year DFS with manageable adverse effects. AC regimens are expected to become more diverse. The differences in survival and adverse effects between these AC regimens require direct comparisons to determine the best choice of regimen. Two phase II studies, the J-CLASSIC and SOXaGC trials, analyzed the patient compliance and safety of CAPOX and S-1 plus oxaliplatin regimens [12,13], but they did not investigate oncologic outcomes as the primary end points. However, in another 2 phase II study, the observational study cohort was designed with somewhat small size of enrolled patients to analyze survival outcomes [14]. This ad hoc cohort study revealed that CAPOX and S-1 plus oxaliplatin regimens in the adjuvant setting have similar oncologic efficacy for patients with pathologic stage III GC. The findings of previous studies showed that doublet AC regimens might have comparable efficacies, whereas monotherapies tended to have inferior capability to suppress recurrence compared with doublet regimens [3,8]. To the best of our knowledge, the current propensity score-matched multicenter cohort study was the first report comparing long-term DFS outcomes between a monotherapy and a doublet regimen as an AC.

Our findings showed similar long-term oncologic outcomes despite the different regimens, indicating the need to consider factors other than chemotherapeutic regimens that may affect patient prognosis. For example, the duration of chemotherapy may explain the differences in 3- and 5-year oncologic outcomes of patients with GC [3]. Moreover, the long-term outcomes of GC patients might also be affected by factors related to GC (e.g., histologic classification, lymphatic or venous invasion, and c-erbB2 status).

Therefore, a nomogram should be established to extend the duration of AC according to the disease categories. On the basis of these factors, physicians may administer additional chemotherapeutic agents after the currently accepted AC in cases of highly aggressive GC.

https://jgc-online.org https://doi.org/10.5230/jgc.2020.20.e13 162

(12)

Additional strategies are needed to enhance compliance to complete AC in patients with intractable AGC.

In conclusion, although the present study was limited by its retrospective design, the PSM analysis in this multicenter cohort study clarified that the AC regimens S-1 and CAPOX did not show significant difference in terms of over-5yr DFS after curative gastrectomy in patients with stage II or III GC.

ACKNOWLEDGMENTS

The authors thank Seung-Wan Ryu, Byung-Jo Seo, Young-Jae Mok, You-Jin Jang, Sang-Uk Han, Si-Hak Lee, Jong-In Lee, Hang-Jong You, Hyun-Sik Min, Young Joon Lee, Sang-Ho Jeong, Ki Hyun Kim, Ki-Young Yoon, Jong-Seok Kim, Seong-Heum Park, Seung-Man Park, Jin-Jo Kim, Doo-Hyun Yang, Hyun-Dong Chae, and Dong-Woo Shin. The authors also thank all members of the Surgical Oncology Forum (SOF) study group for data sharing, discussion, and collaboration in this study.

REFERENCES

1. Sakuramoto S, Sasako M, Yamaguchi T, Kinoshita T, Fujii M, Nashimoto A, et al. Adjuvant chemotherapy for gastric cancer with S-1, an oral fluoropyrimidine. N Engl J Med 2007;357:1810-1820.

PUBMED | CROSSREF

2. Bang YJ, Kim YW, Yang HK, Chung HC, Park YK, Lee KH, et al. Adjuvant capecitabine and oxaliplatin for gastric cancer after D2 gastrectomy (CLASSIC): a phase 3 open-label, randomised controlled trial. Lancet 2012;379:315-321.

PUBMED | CROSSREF

3. Kim IH, Park SS, Lee CM, Kim MC, Kwon IK, Min JS, et al. Efficacy of adjuvant S-1 versus XELOX chemotherapy for patients with gastric cancer after D2 lymph node dissection: a retrospective, multi- center observational study. Ann Surg Oncol 2018;25:1176-1183.

PUBMED | CROSSREF

4. Guideline Committee of the Korean Gastric Cancer Association (KGCA), Development Working Group

& Review Panel. Korean practice guideline for gastric cancer 2018: an evidence-based, multi-disciplinary approach. J Gastric Cancer 2019;19:1-48.

PUBMED | CROSSREF

5. Japanese Gastric Cancer Association. Japanese gastric cancer treatment guidelines 2014 (ver. 4). Gastric Cancer 2017;20:1-19.

PUBMED | CROSSREF

6. Amin MB, Edge S, Greene F, Byrd DR, Brookland RK, Washington MK, et al. AJCC Cancer Staging Manual. 8th ed. New York (NY): Springer International Publishing, 2017.

7. Sasako M, Sakuramoto S, Katai H, Kinoshita T, Furukawa H, Yamaguchi T, et al. Five-year outcomes of a randomized phase III trial comparing adjuvant chemotherapy with S-1 versus surgery alone in stage II or III gastric cancer. J Clin Oncol 2011;29:4387-4393.

PUBMED | CROSSREF

8. Cho JH, Lim JY, Cho JY. Comparison of capecitabine and oxaliplatin with S-1 as adjuvant chemotherapy in stage III gastric cancer after D2 gastrectomy. PLoS One 2017;12:e0186362.

PUBMED | CROSSREF

9. Kim DW, Kwon OK, Yoo MW, Ryu SW, Oh SJ, Hur H, et al. Actual compliance to adjuvant chemotherapy in gastric cancer. Ann Surg Treat Res 2019;96:185-190.

PUBMED | CROSSREF

10. Hu X, Chen L, Du Y, Fan B, Bu Z, Wang X, et al. Postoperative chemotherapy with S-1 plus oxaliplatin versus S-1 alone in locally advanced gastric cancer (RESCUE-GC study): a protocol for a phase III randomized controlled trial. Chin J Cancer Res 2017;29:144-148.

PUBMED | CROSSREF

Adjuvant Chemotherapy for Gastric Cancer

(13)

11. Yoshida K, Kodera Y, Kochi M, Ichikawa W, Kakeji Y, Sano T, et al. Addition of docetaxel to oral fluoropyrimidine improves efficacy in patients with stage III gastric cancer: interim analysis of JACCRO GC-07, a randomized controlled trial. J Clin Oncol 2019;37:1296-1304.

PUBMED | CROSSREF

12. Fuse N, Bando H, Chin K, Ito S, Yoshikawa T, Tsuburaya A, et al. Adjuvant capecitabine plus oxaliplatin after D2 gastrectomy in Japanese patients with gastric cancer: a phase II study. Gastric Cancer 2017;20:332-340.

PUBMED | CROSSREF

13. Shitara K, Chin K, Yoshikawa T, Katai H, Terashima M, Ito S, et al. Phase II study of adjuvant chemotherapy of S-1 plus oxaliplatin for patients with stage III gastric cancer after D2 gastrectomy.

Gastric Cancer 2017;20:175-181.

PUBMED | CROSSREF

14. Nakamura Y, Yamanaka T, Chin K, Cho H, Katai H, Terashima M, et al. Survival outcomes of two phase 2 studies of adjuvant chemotherapy with S-1 plus oxaliplatin or capecitabine plus oxaliplatin for patients with gastric cancer after D2 gastrectomy. Ann Surg Oncol 2019;26:465-472.

PUBMED | CROSSREF

164

https://jgc-online.org https://doi.org/10.5230/jgc.2020.20.e13

수치

Fig. 1. Flowchart of PSM.
Table 1. Baseline characteristics of patients in S-1 and CAPOX groups
Table 1. (Continued) Baseline characteristics of patients in S-1 and CAPOX groups
Fig. 2. DFS of patients with stage II and III gastric cancer according to adjuvant chemotherapy regimen; (A) stage II, (B) stage IIA, (C) stage IIB, (D) stage III, (E)  stage IIIA, (F) stage IIIB, and (G) stage IIIC
+4

참조

관련 문서

Short-term surgical outcomes from a phase III study of laparoscopy-assisted versus open distal gastrectomy with nodal dissection for clinical stage IA/IB gastric cancer:

Kaplan-Meier survival analysis of patients with stage III gastric cancer who were treated with 1–7 cycles (incomplete chemotherapy, blue) or 8 cycles (complete chemotherapy, green)

Purpose: The surgical outcomes of end-stage renal disease (ESRD) patients undergoing radical gastrectomy for gastric cancer were inferior compared with those of non-ESRD

The aim of this study was to evaluate the tolerance to adjuvant chemotherapy, and to com- pare survival between elderly patient groups (aged ≥75 years) with advanced gastric

In conclusion, based on this meta-analysis, patients with ypT0–2N0 rectal cancer after nCRT and radical surgery may not benefit from adjuvant chemotherapy with respect to long term

We evaluated the expres- sion of TS using immunohistochemistry in primary tumours of locally advanced gastric cancer patients treated with 5-FU and doxorubicin- based

In the NSABP Protocol R-02 trial, 694 patients who had undergone a radical resection for stage II/III rectal cancer were randomized to receive either adjuvant chemotherapy

Three gastric cancer patients with isolated para-aortic lymph node (PAN) metastasis showed partial re- sponse to capecitabine-based chemotherapy, and laparoscopy-assisted