Landslide Analysis of River Bank Affected by Water Level Fluctuation II
저수위 변동에 영향을 받는 강기슭의 산사태 해석 II
김 유 성1* Kim, You-Seong 왕 유메이2 Wang, Yu-Mei 최 재 선3 Choi, Jae-Seon
ABSTRACT
The change of water level in reservoirs is an important factor causing failure of bank slopes, i.e. landslide. The water level of Three Gorges reservoir in China fluctuate between 145 m and 175 m, as a matter of flood control. During its normal operational state, the rate of water level fluctuation is supposed to range from 0.67 m/d to 3.0 m/d. Majiagou slope is located on the left bank of Zhaxi River, 2.1 km up from the outlet. Zhaxi River is a tributary of the Yangtze River within the Three Gorges area, of which the water level changes with the reservoir. At the back of Majiagou slope, a 20 m long and 3~10 cm wide fissure developed just after the reservoir water level rose from 95 m to 135 m in 2003. This big fissure was a full suggestion of potential failure of this slope. In this study, the pore water pressure files obtained from seepage analysis were used to evaluate the change in factor of safety (FS) with reservoir water level. Slope stability analyses then were carried out, with fully specified slip surface and limit equilibrium method. In the limit equilibrium analysis, the contribution of negative pore water pressure to shear strength was considered by the use of Fredlund’s shear strength equation for unsaturated soils.
On the base of the analyses, the change of FS with reservoir water level was interpreted in detail. It was found that FS against bank slopes decreases with the rise of the reservoir water level and increases with the drawdown of the reservoir water level. The most dangerous state was when the reservoir water level stays at the highest for a long time.
요 지
저수지의 수위변화는 저수지 주변 강기슭 사면파괴의 주요 요인이다. 중국의 삼협댐 저수위는 홍수량 조절을 위해 145m와 175m사이에서 변화한다. 삼협댐 저수위의 정상적 운영상태에서 저수위 변동속도는 0.67m~3.0m의 범위에 있다. 마지아고 사면은 자시강의 2.1km 상류 좌측기슭에 위치한다. 자시강은 삼협지역내에 있는 양츠강의 지류이다. 2003년 저수위가 95m에 서 135m로 상승한 직후, 마지아고 사면의 후면부에서 길이 20m, 폭 3~10의 균열이 발생하였다. 지금은 균열 보수 후 특별한 징후는 보이지 않고는 있으나, 이 큰 균열은 마지아고 사면의 산사태 가능성을 암시하고 있었다. 이 연구에서는 침투해석에서
얻어진 간극수압을 저수위 변동에 따른 안전율 변화를 평가하기 위해 사용되었다. 안전율 평가는 한계평형해석에 의한 사면안
정해석에 의해 수행되었다. 한계평형해석에서 전단강도에 미치는 부의 간극수압 효과는 불포화 흙에 대한 프레드런드의 전단
강도식을 사용하여 고려하였다. 연구결과 강기슭사면의 안전율은 저수위의 상승, 하강에 따라 감소와 증가의 경향을 보이나, 가장 위험한 상태는 저수위가 최대높이를 장기간 유지할 때인 것으로 나타났다.
Keywords : Landslide, Water level fluctuation, Stability analysis, Factor of safety 한국토목섬유학회논문집 제9권 3호 2010년 9월 pp. 87 ∼ 93
J. Korean Geosynthetics Society Vol.9 No.3 September. 2010 pp. 87 ~ 93
1* 정회원, 전북대학교 토목공학과 교수 (Member, Professor, Dept. of Civil Engineering, Chonbuk National University, E-mail: [email protected]) 2 비회원, 전북대학교 토목공학과 석사졸업 (Non-member, Former master student, Dept. of Civil Engineering, Chonbuk National University) 3 비회원, SK건설 부장 (Non-member, General Manager, SK Engineering and Construction)
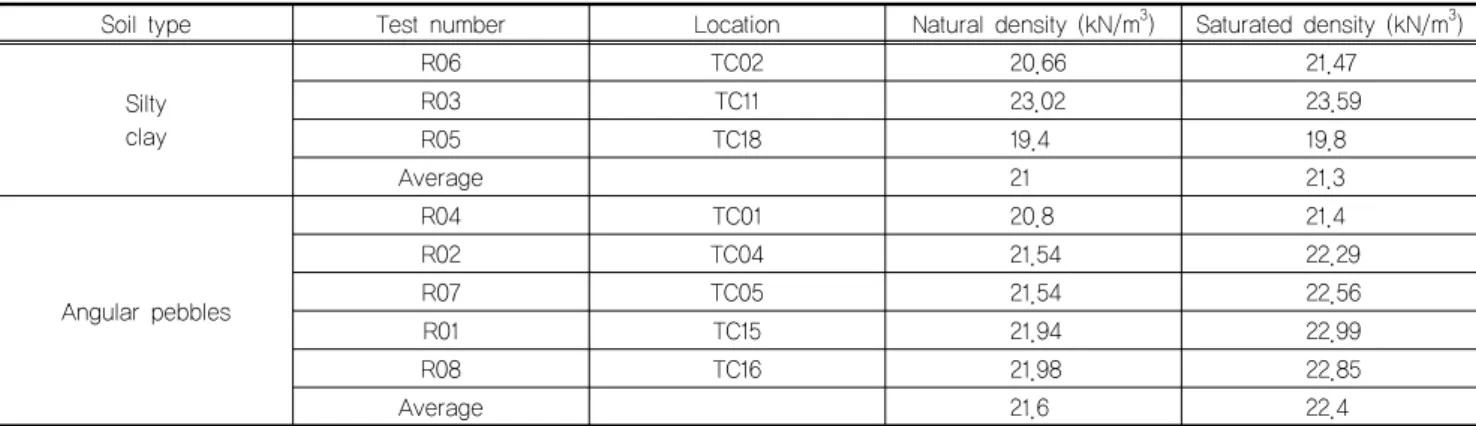
Table 1. Slope soil mass density
Soil type Test number Location Natural density (kN/m3) Saturated density (kN/m3)
Silty clay
R06 TC02 20.66 21.47
R03 TC11 23.02 23.59
R05 TC18 19.4 19.8
Average 21 21.3
Angular pebbles
R04 TC01 20.8 21.4
R02 TC04 21.54 22.29
R07 TC05 21.54 22.56
R01 TC15 21.94 22.99
R08 TC16 21.98 22.85
Average 21.6 22.4
1. Introduction
The change of water level in reservoirs is an important factor causing failure of bank slopes(Jin Yanli, 2007).
Jones(1961) investigated the landslides occurred in the vicinity of Roosevelt lake from 1941 to 1953. It was found that 49% of them occurred during the first filling period of reservoir from 1941 to 1942, and 30% of them occurred as a result of drawdown of reservoir. In Japan, about 40% landslides around reservoirs occurred during the rising of water level, and 60% of these happened under a drawdown condition. The water level in the Three Gorges reservoir in China fluctuate between 145 m and 175 m, as a matter of flood control. The hydraulic and mechanical loadings changing with the water level will affect the stability of the river bank slope. Majiagou slope is located in Zigui county, Hubei province, China, within the Three Gorges area. The slope lies on the left bank of Zhaxi River which is a tributary of the Yangtze River, 2.1 km up from the outlet. In 2003, a 20 m long, 3~5 cm wide, locally 10 cm-wide fissure developed at the back of the slope just after the reservoir water level rose from 95 m to 135 m. After that, the fissure was stabilized, with no further opening. During the normal operation state of the reservoir, the rate of water level fluctuation is supposed to range from 0.67 m/d to 3.0 m/d between 145 and 175 m(Liao, 2005). Even if the new formed fissure was stabilized without further opening, there could be large scale landslide due to the big change of reservoir water level. In this study, unsaturated-saturated seepage analyses were carried out using SEEP/W to simulate the
change of pore water pressure in the bank slope subject to the reservoir level change(GEO-STUDIO, 2004). The pore water pressure files obtained from seepage analysis were imported into SLOPE/W program, with fully specified slip surface and limit equilibrium method to evaluate the change in factor of safety with reservoir water level change. In the limit equilibrium analysis, the con- tribution of negative pore-water pressure to shear strength was considered by the use of Fredlund’s shear strength equation for unsaturated soils. The change of SF with res- ervoir level fluctuation was represented in detail relatively.
2. Physical and Mechanical Properties
2.1 Density of the slope soil mass
As the soil layer contains too many irregular rock blocks, it could not be sampled by the ring cut; therefore, the natural density and saturated density of the slide mass were obtained by in-situ tests. The process is firstly to excavate a cubic pit of 50 cm×50 cm×50 cm in size, and to weigh the soil being cut package by package during excavation. As the pit was completed, its bottom and walls were covered with thin watertight film. As it was filled up with water, the volume of water was gauged bucket by bucket. The natural density is equal to the quotient of the cumulative soil weight to the cumulative soil volume. For measuring the saturated density, water was allowed to penetrate to the area tested to make the soil fully saturated. The soil densities obtained by this method are shown in Table 1. As shown in Table 1, the
Table 2. Direct shear test results for shear strength
Strength indexes Peak strength Residual strength
(°) c (kPa) (°) c (kPa)
Count 6 6 6 6
Range 5.2~30.0 6.8~21.0 2.7~25.0 5.1~18.5
Average 14.6 18.0 12.4 13.4
Table 3. Results of water injection test
Number Borehole number Test depth Soil
type
Permeability coefficient
(cm/s) (m/d)
1 ZK4 0.5~0.67 Slity clay 1.38e-5 1.19e-2
2 ZK10 4.3~4.5 Angular pebbles 0.064 55.30
3 ZK11 6.1~6.3 Angular pebbles 0.500 432.0
4 ZK1 6.4~6.6 Angular pebbles 1.520 1313.28
5 ZK2 10.0~10.3 Angular pebbles 0.025 21.6
6 ZK6 10.4~10.6 Angular pebbles 0.006 5.18
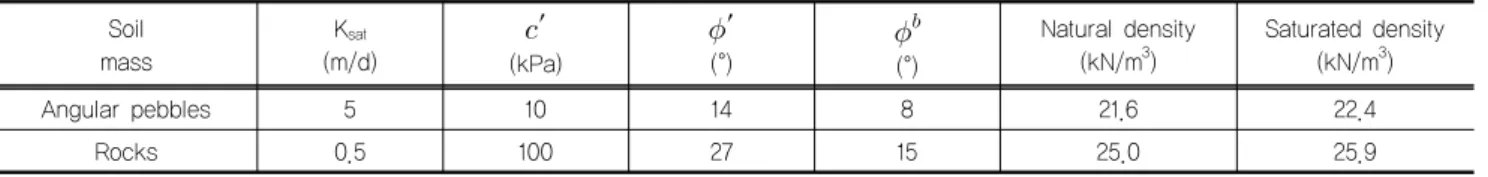
Table 4. Parameters used in the analyses Soil
mass
Ksat
(m/d)
′
(kPa)
′
(°)
(°)
Natural density (kN/m3)
Saturated density (kN/m3)
Angular pebbles 5 10 14 8 21.6 22.4
Rocks 0.5 100 27 15 25.0 25.9
difference between the natural density and the saturated density is small. It indicates that the soil mass is close to a naturally-saturated state. The silty clay on the top layer contains irregular rock blocks and fragments, so the deviation of the density is little bit wide. Because this layer is relatively thin and the thickness is not uniform, it will be little effected on the stability assessment and could be neglected.
2.2 Shear strength parameters of the slope soil mass
The shear strength of the potential slide zone are shown in Table 2, which were obtained from direct shear test with the soil samples collected in the investigation pits. Because the samples contain more or less fragments, both c and have high variations.
2.3 Permeability of the soil mass
To determine the permeability of the soils in the slope,
6 groups of water injection tests were completed in the boreholes, of which one group for the slity clay and five groups for angular pebbles. The results of the tests are shown in Table 3.
3. Analysis simulation of the slope
3.1 Parameters of the slope
Based on results of laboratory experiments, in situ ex- periments, the parameters used in the simulation are identified as what is shown in Table 4.
3.2 Effect of negative pore-water pressures
Soil suction or negative pore water pressures have the effect of adding strength to a soil. That is to say that positive pore-water pressures decrease the effective stress and thereby decrease the strength, negative pore-water pressures increase the effective stress and in turn increase the strength. The shear strength of unsaturated soil is:
300
300
200
150
10011
0 50 100 150 200 250 300 350 400 450 500 550
10 2
1 5
4
2 3 1
6
7
8 9
Distance(m)
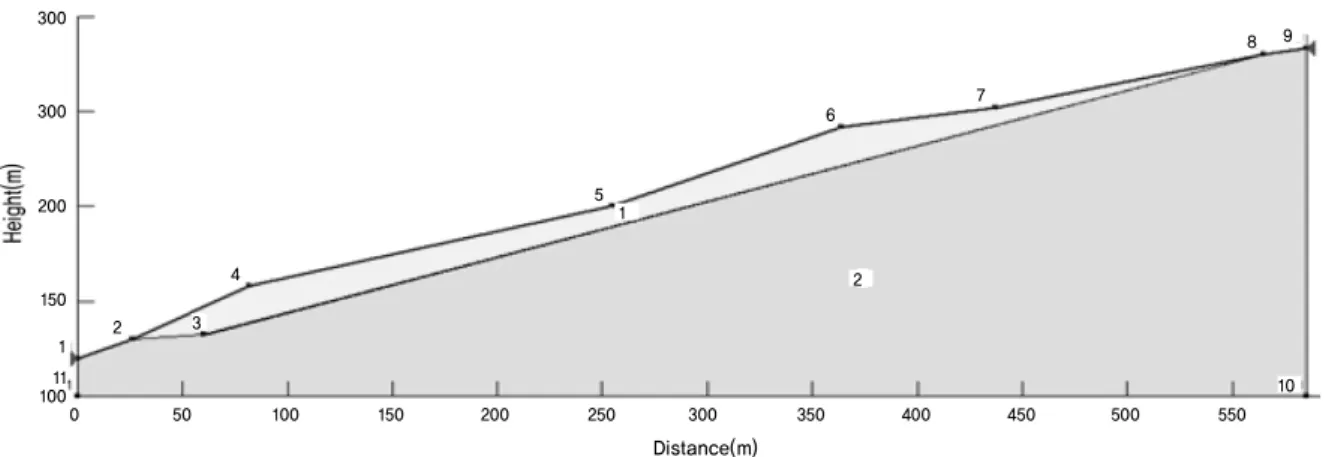
Fig. 1. The stability analysis mode of Majiagou slope where,
= pore air pressure,
= pore water pressure, and
= angle defining the increase in shear strength for an increase in suction.
This equation indicates that the shear strength of a soil could be considered as having three components: the cohesive strength due to ′, the frictional strength due to
′ and the suction strength due to . The term
is called suction when presented as a positive number. The angle is a material property. In SLOPE/W,
is treated as a constant value, but in actual fact this parameter varies with the degree of saturation. In the capillary zone where the soil is saturated, but the pore- water pressure is under tension, is equal to the friction angle ′. As the soil desaturates, decreases. The de- crease in is a reflection of the fact that the negative pore-water pressure acts over a smaller area. More spe- cifically, is related to the soil water characteristic curve, but relating to the volumetric water content has yet not been implemented in SLOPE/W. Currently, only a constant can be specified. For practical purposes, can be taken to be about
′. In SLOPE/W, if is un- defined (zero), any negative pore-water pressure is ig-
nored. If is a non-zero specified value, the above equation for unsaturated soil is used in SLOPE/W and an extra strength component depend on the suction is added to the slice base shear strength(Zheng, 2007).
4. Slope stability analysis results
4.1 Stability analysis of the slope during regulation process
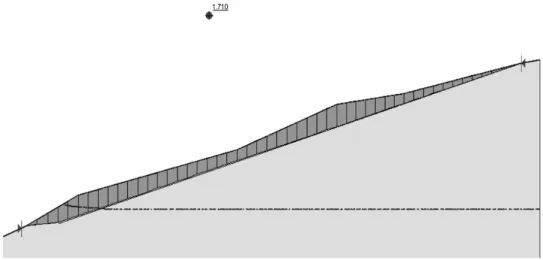
The obtained pore-water pressure files which are results of another part of this study were then imported into program SLOPE/W, with fully specified slip surface and limit equilibrium method to evaluate the change in factor of safety with reservoir water level. In the limit equilibrium analysis, the contribution of negative pore-water pressure to shear strength was considered by the use of Fredlund’s shear strength equation for unsaturated soils. Fig. 1 shows the stability analysis mode of majiagou slope. As an example, Fig. 2 shows the result of stability analysis during rising with 1m/day rate when reservoir water level rise to 150 m.
Based on the analysis results just like Fig. 15 from SLOPE/W, the relationship between stability of Majiagou slope on landslide and reservoir water level was inter- preted as shown in Figs. 3 and 4. Fig. 3 shows relation between the change of FS and water level change with three water level change rate. Fig. 3 is the results in case of assuming the equals to 8. And also Fig. 4 is the
Fig. 2. Stability analysis during rising with 1 m/d rate at water level 150 m
Fig. 3. Stability of the slope with different water level and water level change rate (= 8)
Fig. 4. Stability of the slope with different water level and water level change rate (= 0)
Fig. 5. The whole year normal water level of the reservoir from October
results in case of neglecting the negative pore water pressure. Three points could be read from Fig. 3.
Firstly, FS decrease with the increasing water level and then FS increase again with decreasing water level. But increasing rate of FS is slower than decreasing rate of FS during water level increase. Secondly, the water level change rate is slower, the FS change line is stiffer. Thirdly, when the water level is 175 high, FS is the most low and if the safety standard is 1.5, it could be dangerous state.
Fig. 4 is just identical with Fig. 3, but of angular pebbles was supposed to zero, that is there is no negative pore water pressure. When heavy rainfall pour in this area, such state could be developed. The general features are similar to results from Fig. 3, but it need to emphasize the fact that FS decreased in the ratio of almost half.
Comparing two figures, it could be concluded that the suction has a big contribution on FS. And the rising rate of reservoir water level is faster, the FS decreases slowly,
and the drawdown rate is faster, the FS increases slowly.
Besides, the suction and the seepage force seems to lead to that at the same water level and the same fluctuating rate, the FS during the drawdown process is smaller than that during the rising process. As the reservoir water level
(a) 0~30 day (October ) (b) 30~60 day (November)
(c) 60~90 day (December) (d) 90~120 day (January)
(e) 120~150day (February) (f) 150~180 day (March)
(g) 180~210day (April) (h) 210~240 day (May)
(i) 240~270 day (June) (j) 270~300 day (July)
(k) 300~330 day (August) (l) 330~360 day (September) Fig. 6. Change of phreatic lines in the slope around a whole
year
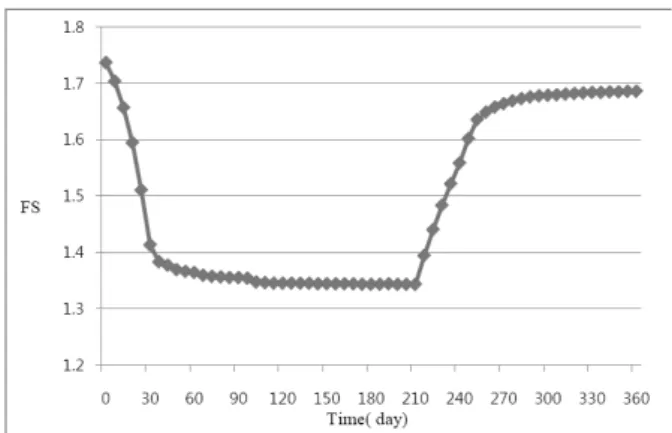
Fig. 7. The change of FS of the slope through whole year
rise, the frictional resistance and suction decrease, and this two decreasing components plays a dominant role in change of FS.
4.2 Stability analysis of the slope during the normal operational process
According to the water level management schedule of the Three Gorges reservoir, the whole year’s boundary conditions of the front part of the bank slope beginning from October neglecting the flood control and agricultural irrigation parts are shown in Fig. 5.
Next Fig. 6 show the change of phreatic lines in the slope once every 6 day month by month through whole year from October.
Based on the phreatic lines above, the obtained change of FS were shown in Fig. 7. Fig. 7 shows how the FS in the slope change with the fluctuation of reservoir water level through one operating year. During the rising and drawdown process, the FS shows a delayed response with respect to the change of reservoir level(Desai, 1977).
After the reservoir water level stops rise or drawdown, the FS of the slope continues to decrease or increase, respectively. The permeability of the potential slip mass is relatively large, so the FS does not change very much after the water level is constant. The trend of FS in this study could be different with some other literatures, be- cause the results might be affected by the characteristics of slope, such as the shape of the potential slip zone, the range of water level influence on the slope, the perme- ability and the natural density of the soil mass, and so
on(Lane and Griffiths, 2000). In this study, the most dangerous state of the slope is when the reservoir water level stay 175 m for a long time.
5. Conclusions
(1) With the rise of reservoir water level, the FS against river bank landslide decreases, and as the reservoir water level lowing, the FS increases.
(2) Rising rate of reservoir water level is faster, the FS decreases slowly, and also the drawdown rate is faster, the FS increases more slowly.
(3) The suction and the seepage force seems to lead to that the FS during the drawdown process is smaller than that during the rising process at the same water level and the same fluctuating rate.
(4) The suction seems to have a big contribution on FS, judging from the fact that FS decreas in the ratio of almost half if there is no suction in top slope layer.
(5) After the reservoir water level stops rise or draw- down, the FS of continues to decrease or increase, respectively. The most dangerous state is when the
reservoir water level is maximum operating height (175 m) for a long time.
References
1. Desai, C. S. (1977), “Drawdown analysis of slopes by nu- merical method”, Journal of the Geotechnical Engineering Division, Vol.103, No.7, pp.667-676.
2. GEO-STUDIO. (2004), International Ltd. Users Manual of finite element analysis by SEEP/W and SLOPE/W.
3. Jin Yanli (2007), “Analysis of loess slope stability duo to groundwater rise”, Jounal of geoengineering geology.
4. Jones, F.O., Embody, D.R., and Hazelwood, R.M.(1961), Landslides along the Columbia River valley, northeastern Washington, with a section on seismic surveys, U.S. Geol- ogical Survey Professional Paper 367, pp. 98.
5. Liao Hon-jian (2005), “Influence of drawdown of reservoir water level on landslide stability”, Chinese Journal of rock mechanics and engineering.
6. P. A. Lane and D. V. Griffiths (2000), “Assessment of stability of slopes under drawdown conditions”, Journal of geotechnical and geoenvironmental engineering, Vol.126, Issue 5, pp.443-450.
7. Zheng Xiaojing (2007), “Stability calculation of reservoir bank landslide based on unsaturated seepage flow”, Hydro- geology & engineering geology, Vol.34, No.2, pp.29-32.
(논문접수일 2010. 9. 10, 심사완료일 2010. 9. 25)