ABSTRACT
Background: Procalcitonin (PCT) is a diagnostic biomarker for bacterial infections in critically-ill patients. However, the cut-off value of PCT for the diagnosis of bacterial infections is unclear and unreliable. This study aimed to determine the optimal cut-off value of PCT for the diagnosis of bacterial infections in critically-ill patients.
Materials and Methods: We conducted a retrospective study involving 311 adult patients who had been admitted to the medical or surgical intensive care unit for more than 24 hours from 2013 to 2015. At least one blood test for PCT level was performed for all patients within the first 24 hours of suspecting an infection.
Results: One hundred and fifty-seven patients had bacterial infections, while 154 did not.
Patients with bacterial infections had a significantly higher median PCT level than those without bacterial infections (1.90 ng/mL vs. 0.16 ng/mL, P <0.001). The area under the receiver operating characteristic curve of PCT for discriminating between bacterial and non- bacterial infections was 0.874 (95% confidence interval: 0.834, 0.914; P <0.001). The optimal cut-off value of PCT for differentiating between fevers due to bacterial infections from those due to non-bacterial infections was 0.5 ng/mL, with a sensitivity of 84.7%, specificity of 79.9%, positive predictive value of 81.1%, and negative predictive value of 83.7%.
Conclusion: PCT was found to be an accurate biomarker for the diagnosis of bacterial infections among patients admitted to medical and surgical intensive care units. The optimal cut-off value of PCT for the diagnosis of bacterial infections was 0.5 ng/mL.
Keywords: Bacterial infections; Critical illness; Diagnosis; Procalcitonin
INTRODUCTION
Many inflammatory markers, such as erythrocyte sedimentation rate, C-reactive protein level, and white blood cell count, are non-specific laboratory tests for the diagnosis of bacterial infections [1]. The diagnosis of bacterial infections in patients admitted to the intensive care unit (ICU) is difficult, due to the multiple etiologies of fever including non- infectious diseases [2]. Patients admitted to the ICU with fever always receive empirical
Original Article
Received: Mar 21, 2019 Accepted: Jun 18, 2019 Corresponding Author:
Preecha Montakantikul, Pharm D, BCP Department of Pharmacy, Faculty of Pharmacy, Mahidol University, Bangkok, 447 Sri-Ayuthaya Road, Rajathevi, Bangkok 10400, Thailand.
Tel: +66(0)2644-8694 Fax: +66(0)2354-4326
E-mail: [email protected] Copyright © 2019 by The Korean Society of Infectious Diseases and Korean Society for Antimicrobial Therapy
This is an Open Access article distributed under the terms of the Creative Commons Attribution Non-Commercial License (https://
creativecommons.org/licenses/by-nc/4.0/) which permits unrestricted non-commercial use, distribution, and reproduction in any medium, provided the original work is properly cited.
ORCID iDs Apichot So-Ngern
https://orcid.org/0000-0001-7393-0901 Preecha Montakantikul
https://orcid.org/0000-0001-6782-2939 Funding
This study was funded by the Department of Pharmacy, Faculty of Pharmacy, Mahidol University, Bangkok, Thailand.
Conflict of Interest No conflicts of interest.
Apichot So-Ngern 1, Sombat Leelasupasri2, Suvatna Chulavatnatol3,
Chalermsri Pummangura1, Pakwan Bunupuradah4, and Preecha Montakantikul 3
1Faculty of Pharmacy, Siam University, Bangkok, Thailand
2Department of Medicine, Phyathai 2 International Hospital, Bangkok, Thailand
3Department of Pharmacy, Faculty of Pharmacy, Mahidol University, Bangkok, Thailand
4 Clinical Pharmacy Unit, Division of Pharmacy, Faculty of Medicine Ramathibodi Hospital, Mahidol University, Bangkok, Thailand
Prognostic Value of Serum Procalcitonin level for the Diagnosis of Bacterial
Infections in Critically-ill Patients
Author Contributions
Conceptualization: AS-N, PM, SL. Data curation: AS-N. Formal analysis: AS-N.
Funding acquisition: AS-N. Investigation: PM, SL. Methodology: AS-N, PM, SL. Supervision:
PM, SL. Writing - original draft: AS-N. Writing - review & editing: CP, PB, PM, SL, SC.
antimicrobial therapy, even when the diagnosis of infection is doubtful [3]. This is an important contributory factor to antimicrobial resistance [4]. Therefore, an accurate diagnosis is of utmost importance to avoid unnecessary antibiotic usage. Moreover, the early diagnosis of bacterial sepsis might decrease the associated mortality rate [5].
Procalcitonin (PCT), the most studied biomarker, has been specifically related to bacterial infections [6]. Serum PCT level significantly increases within the first 4–8 hours in response to bacterial infections [7]. Normal PCT levels in healthy volunteers are undetectable (<10 pg/mL) [7]. An increased serum PCT level has been reported in different types of bacterial infections: intra-abdominal infections, meningitis, urinary tract infections, pneumonia, and sepsis [6]. Some authors have previously reported that a high PCT level could differentiate between fevers due to bacterial infections and those due to non-infectious causes [8-10].
PCT level was recommended as a useful diagnostic marker for the recognition of sepsis in the Surviving Sepsis Campaign Guidelines 2012 [11]. In 2013, a meta-analysis reported that PCT was a good biomarker for the diagnosis of systemic inflammation response syndromes due to sepsis in critically-ill patients [12]. However, the definition of sepsis was revised in 2016 [13]. The level of PCT is no longer recommended since the definition was changed from the concept of an inflammatory response to one regarding organ dysfunction [13]. In 2016, the guideline for the management of hospital-acquired pneumonia and ventilator- associated pneumonia recommended that the level of PCT should only be used as a marker for the discontinuation of antibiotic administration and not for the initiation of antibiotic administration [14]. Furthermore, the guideline for the implementation of the Antibiotic Stewardship Program, which was published in 2016, suggested that the PCT level should be used in patients admitted to an ICU as a marker for decreasing antibiotic usage [15].
However, no specific cut-off value of PCT was recommended for the initiation of antibiotic therapy [15]. Thus, this retrospective study was conducted to determine the optimal cut-off value of PCT for the diagnosis of bacterial infections in critically-ill patients.
MATERIALS AND METHODS
This retrospective study collected data at Phyathai II International Hospital, a private facility located in Bangkok, Thailand. The protocol for this study was approved by the Institutional Review Board, Faculty of Dentistry and Faculty of Pharmacy, Mahidol University, Thailand, with reference number 2017/045.2208. The committee waived the need for informed consent.
Adult patients (aged >18 years) who were clinically suspected of having severe infections and who required admission to the medical or surgical ICU for more than 24 hours from 2013 to 2015 were enrolled. At least, one blood test for PCT level was performed for all patients within the first 24 hours of suspecting an infection. Patients with clinically suspected severe infections were defined as those who had signs and symptoms compatible with infection, verified by staff physicians. The exclusion criteria included pregnant women, human immunodeficiency virus-infected patients, and those with incomplete data regarding the symptoms of fever. Surgical patients were defined as those who had undergone surgical procedures during hospital admission, and who developed a fever after the procedures. Those surgical patients required admission to the surgical ICU.
The data for the study were extracted from patients' medical records. We collected data regarding sex, age, weight, height, underlying diseases, vital signs, presence of mechanical ventilation, medications, clinical and laboratory data for the evaluation of the sequential
organ failure assessment (SOFA) score, type of surgery, complete blood count, presence of positive hemocultures including other positive isolates from other specimens, length of hospital stay, and PCT level. Moreover, the clinical features, results of laboratory
examination, including radiography, and microbiological response, were evaluated. Patients' statuses at discharge were classified as cured, dead, or referred.
PCT levels were measured using a commercially available electrochemiluminescence immunoassay device (Elecsys BRAHMS PCT; Roche Diagnostics, Indianapolis, IN, USA). The analytical measurement range and functional sensitivity of this instrument were 0.02 – 100 ng/mL and 0.06 ng/mL, respectively.
Patients with fever were diagnosed with bacterial infections if the source of infection was compatible with the laboratory test results and imaging findings. The table of definable sources of infection used in this study was a modified form of a version obtained from the Center for Disease Control/National Healthcare Safety Network [16] (Supplementary Table 1).
The patients were diagnosed with bacterial sepsis if they obtained SOFA scores of two or more.
Patients without bacterial infection were defined as those whose diagnostic investigations did not yield findings compatible with the criteria specified for bacterial infections.
Continuous variables are presented as mean and standard deviation, or median and interquartile range and compared using the Student t-test or Mann-Whitney U test, as appropriate. Categorical variables are presented as percentages and compared in each group using Fisher's exact test or Pearson's chi-square test, as appropriate. The PCT levels among patients in the bacterial infection group were compared to those of patients in the non-bacterial infection group (as the control group) and assessed for sensitivity, specificity, negative predictive value, and positive predictive value. The area under the receiver operating characteristic curves (AUC) was calculated to assess the ability of PCT level to discriminate between bacterial and non-bacterial infections. The optimal cut-off value and AUC were determined among all patients and in the subgroup populations.
Patients in the bacterial infection group were divided into three subgroups. The first group comprised all patients with positive microbiological culture results at the source of infection (culture-proven infections). The second group comprised all patients diagnosed with sepsis based on their clinical presentation (patients with sepsis). The last group comprised all patients for whom a clinical diagnosis of sepsis was made and for whom positive microbiological cultures were obtained at the source of infection (patients with sepsis and positive microbiological culture results). In addition, the authors determined specific cut-off values and the AUC values according to medical or surgical conditions of the patients. Values with P <0.05 were considered statistically significant. Independent variables associated with PCT levels above the optimal cut-off value or in-hospital mortality rate were assessed via multivariate analysis. Variables with a P-value <0.10 in the univariate analysis were included in the multivariate analysis. Multivariate analysis was performed using the logistic regression model. Statistical analyses were performed using SPSS version 20 for Windows (SPSS Inc., Chicago, IL, USA).
RESULTS
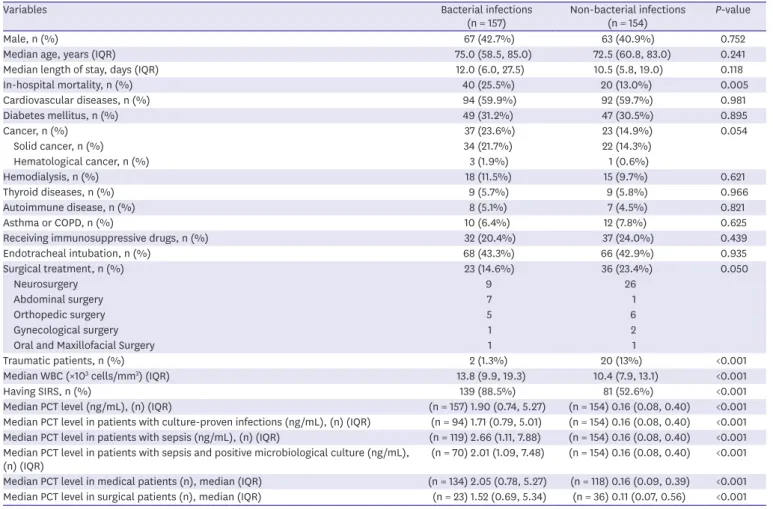
Out of a total of 311 patients enrolled, there were 157 with bacterial infections and 154 without bacterial infections. The baseline characteristics of the patients are shown in Table 1. The in-hospital mortality rate was significantly higher among patients with bacterial infections than among those without bacterial infections (25.5% vs. 13.0%, P = 0.005). Patients with bacterial infections had significantly higher white blood cell counts than did those without bacterial infections (median: 13,800 cell/mm3 vs. 10,400 cell/mm3, P <0.001). A higher proportion of patients with bacterial infections also had signs of systemic inflammatory response syndrome (88.5% vs 52.6%, P <0.001).
Table 2 presents a summary of the characteristics of patients diagnosed with bacterial infection. Of 157 patients with bacterial infections, 119 patients (75.8%) were diagnosed with sepsis and 94 (59.9%) had positive microbiological evidence from the source of infection.
The three most common sites of infection were the pulmonary system, urinary tract, and abdomen. Seventeen of 157 patients (10.8%) had positive hemoculture results. The primary source of infection could not be identified in 5 out of 157 patients, all of whom were diagnosed with sepsis.
Table 1. Baseline characteristics of patients enrolled in the study
Variables Bacterial infections
(n = 157) Non-bacterial infections
(n = 154) P-value
Male, n (%) 67 (42.7%) 63 (40.9%) 0.752
Median age, years (IQR) 75.0 (58.5, 85.0) 72.5 (60.8, 83.0) 0.241
Median length of stay, days (IQR) 12.0 (6.0, 27.5) 10.5 (5.8, 19.0) 0.118
In-hospital mortality, n (%) 40 (25.5%) 20 (13.0%) 0.005
Cardiovascular diseases, n (%) 94 (59.9%) 92 (59.7%) 0.981
Diabetes mellitus, n (%) 49 (31.2%) 47 (30.5%) 0.895
Cancer, n (%) 37 (23.6%) 23 (14.9%) 0.054
Solid cancer, n (%) 34 (21.7%) 22 (14.3%)
Hematological cancer, n (%) 3 (1.9%) 1 (0.6%)
Hemodialysis, n (%) 18 (11.5%) 15 (9.7%) 0.621
Thyroid diseases, n (%) 9 (5.7%) 9 (5.8%) 0.966
Autoimmune disease, n (%) 8 (5.1%) 7 (4.5%) 0.821
Asthma or COPD, n (%) 10 (6.4%) 12 (7.8%) 0.625
Receiving immunosuppressive drugs, n (%) 32 (20.4%) 37 (24.0%) 0.439
Endotracheal intubation, n (%) 68 (43.3%) 66 (42.9%) 0.935
Surgical treatment, n (%) 23 (14.6%) 36 (23.4%) 0.050
Neurosurgery 9 26
Abdominal surgery 7 1
Orthopedic surgery 5 6
Gynecological surgery 1 2
Oral and Maxillofacial Surgery 1 1
Traumatic patients, n (%) 2 (1.3%) 20 (13%) <0.001
Median WBC (×103 cells/mm3) (IQR) 13.8 (9.9, 19.3) 10.4 (7.9, 13.1) <0.001
Having SIRS, n (%) 139 (88.5%) 81 (52.6%) <0.001
Median PCT level (ng/mL), (n) (IQR) (n = 157) 1.90 (0.74, 5.27) (n = 154) 0.16 (0.08, 0.40) <0.001 Median PCT level in patients with culture-proven infections (ng/mL), (n) (IQR) (n = 94) 1.71 (0.79, 5.01) (n = 154) 0.16 (0.08, 0.40) <0.001 Median PCT level in patients with sepsis (ng/mL), (n) (IQR) (n = 119) 2.66 (1.11, 7.88) (n = 154) 0.16 (0.08, 0.40) <0.001 Median PCT level in patients with sepsis and positive microbiological culture (ng/mL),
(n) (IQR) (n = 70) 2.01 (1.09, 7.48) (n = 154) 0.16 (0.08, 0.40) <0.001
Median PCT level in medical patients (n), median (IQR) (n = 134) 2.05 (0.78, 5.27) (n = 118) 0.16 (0.09, 0.39) <0.001 Median PCT level in surgical patients (n), median (IQR) (n = 23) 1.52 (0.69, 5.34) (n = 36) 0.11 (0.07, 0.56) <0.001 IQR, interquartile range; COPD, chronic obstructive pulmonary diseases; WBC, white blood cell count; SIRS, systemic inflammation response syndrome; PCT, procalcitonin.
The median PCT levels are summarized in Table 1. The patients with bacterial infections had significantly higher PCT levels than did those without bacterial infections (median:
1.90 ng/mL vs. 0.16 ng/mL, P <0.001). Among patients with bacterial infections, there was no statistically significant difference in the median PCT level between medical and surgical patients (2.05 ng/mL vs. 1.52 ng/mL, P = 0.686). Similarly, among patients without bacterial infections, no difference was noted between medical and surgical patients (0.16 ng/mL vs 0.11 ng/mL, P = 0.368).
The receiver operating characteristic curve for PCT is shown in Figure 1. The AUC for discriminating between bacterial and non-bacterial infections was 0.874 (95% confidence interval [CI]: 0.834, 0.914; P <0.001). The measures of diagnostic accuracy, including the sensitivity, specificity, positive predictive value, and negative predictive value of PCT level are shown in Table 3. The optimal cut-off value of PCT was 0.50 ng/mL with a sensitivity of 84.7%, specificity of 79.9%, positive predictive value of 81.1%, and negative predictive value Table 2. Characteristics of bacterial infections
Characteristics of bacterial infections Total (n = 157) Culture positive (n = 94) Culture negative (n = 63)
Patients with bacteremia, n/N (%) 17/157 (10.8%) 17/94 (18.1%) 0%
Patients with sepsis, n/N (%) 119/157 (75.8%) 70/94 (74.5%) 49/63 (77.8%)
Cause of sepsis
Pneumonia, n 58 39 19
Urinary tract infections, n 27 21 6
Intra-abdominal infections, n 18 5 13
Skin and soft tissue infections, n 6 1 5
Central nervous system infections, n 2 1 1
Unknown sourcea, n 5 0 5
Blood stream infection, n 3 3 0
Patients without sepsis, n/N (%) 38/157 (24.2%) 24/94 (25.5%) 14/63 (22.2%)
Pneumonia, n 18 11 7
Intra-abdominal infections, n 4 1 3
Urinary tract infections, n 9 8 1
Central nervous system infections, n 2 1 1
Skin and soft tissue infections, n 2 1 1
Bronchitis, n 2 2 0
Bone infection, n 1 0 1
aAll patients met the criteria for sepsis.
1-Specificity
Sensitivity
0 0.2 0.4 0.6 0.8 1.0
0.4
0.2 1.0
0.8
0.6
Figure 1. Receiver operating characteristic curve of procalcitonin for the diagnosis of bacterial infection in critically-ill patients.
of 83.7%. The diagnostic performances of the subgroup analyses are summarized in Table 3.
The optimal cut-off values of PCT were 0.50 ng/mL in the subgroup of patients with sepsis and 0.60 ng/mL in the subgroups of patients with culture-proven infections, sepsis, and positive microbiological culture results. In addition, the optimal cut-off value of PCT was 0.50 ng/mL for medical patients. As a parameter with more practical use, the optimal cut-off value was 0.5 ng/mL for surgical patients. However, the specificity (0.55 ng/mL) was higher than that of the cut-off point (0.50 ng/mL).
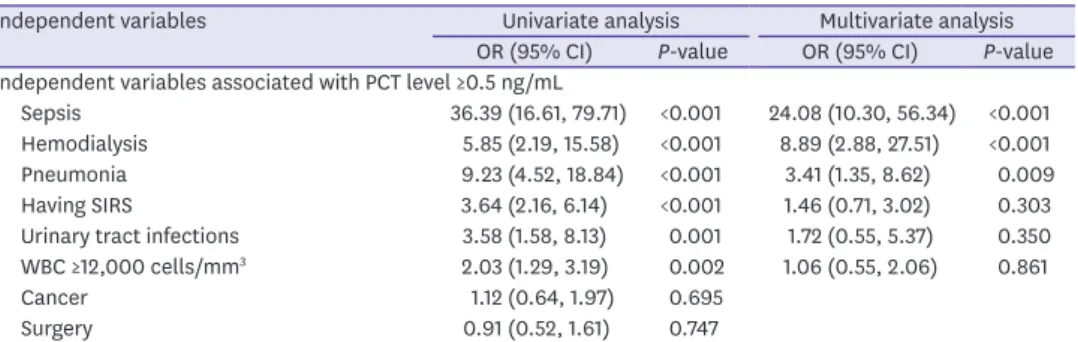
The independent variables associated with PCT level ≥0.5 ng/mL among a total of 311 patients are shown in Table 4. In the multivariate analysis, factors independently associated with PCT level ≥0.5 ng/mL were sepsis (odds ratio [OR] = 24.08; 95% CI: 10.30, 56.34; P <0.001), hemodialysis (OR = 8.89; 95% CI: 2.88, 27.51: P <0.001), and pneumonia (OR = 3.41; 95% CI:
1.35, 8.62; P=0.009).
Table 3. Diagnostic performances of procalcitonin Population AUC (95%CI) Diagnostic
accuracy Cut-off value of PCT (ng/mL)
0.25 0.30 0.40 0.50 0.55 0.60 0.70 0.80 0.90 1.0 1.25 1.5 2.0
Entire population 0.874 (0.834, 0.914), P <0.001
Sensitivity (%) 89.8 87.9 86.0 84.7 82.8 80.9 78.3 73.9 71.3 70.1 63.7 56.7 48.4
Specificity (%) 61.7 68.2 75.3 79.9 81.8 83.8 87.0 87.7 89.0 90.9 90.9 92.2 94.2
PPV (%) 70.5 73.8 78.0 81.1 82.3 83.6 86.0 85.9 86.8 88.7 87.7 88.1 89.4
NPV (%) 85.6 84.7 84.1 83.7 82.4 81.1 79.8 76.7 75.3 74.9 71.1 67.6 64.2
Patients with culture-proven infections (subgroup analysis)
0.859 (0.809, 0.909), P <0.001
Sensitivity (%) 87.2 85.1 83.0 81.9 81.9 81.9 78.7 75.5 73.4 71.3 60.6 54.3 45.7
Specificity (%) 61.7 68.2 75.3 79.9 81.8 83.8 87.0 87.7 89.0 90.9 90.9 92.2 94.2
PPV (%) 58.2 62.0 67.2 71.3 73.3 75.5 78.7 78.9 80.2 82.7 80.3 81.0 82.7
NPV (%) 88.8 88.2 87.9 87.9 88.1 88.4 87.0 85.4 84.6 83.8 79.1 76.8 74.0
Patients with sepsis (subgroup analysis)0.922
(0.890, 0.954), P <0.001
Sensitivity (%) 96.6 95.8 93.3 93.3 90.8 89.9 87.4 84.0 81.5 80.7 72.3 65.5 56.3
Specificity (%) 61.7 68.2 75.3 79.9 81.8 83.8 87.0 87.7 89.0 90.9 90.9 92.2 94.2
PPV (%) 66.1 69.9 74.5 78.2 79.4 81.1 83.9 84.0 85.1 87.3 86.0 86.7 88.2
NPV (%) 96.0 95.5 93.5 93.9 92.0 91.5 89.9 87.7 86.2 85.9 80.9 77.6 73.6
Patients with sepsis and positive microbiological culture (subgroup analysis)
0.909 (0.870, 0.949), P <0.001
Sensitivity (%) 94.3 92.9 90.0 90.0 90.0 90.0 87.1 82.9 81.4 80.0 65.7 60.0 50.0
Specificity (%) 61.7 68.2 75.3 79.9 81.8 83.8 87.0 87.7 89.0 90.9 90.9 92.2 94.2
PPV (%) 52.8 57.0 62.4 67.0 69.2 71.6 75.3 75.3 77.0 80.0 76.7 77.8 79.5
NPV (%) 96.0 95.5 94.3 94.6 94.7 94.9 93.7 91.8 91.3 90.9 85.4 83.5 80.6
Medical patients (subgroup analysis)0.873
(0.828, 0.919), P <0.001
Sensitivity (%) 88.8 88.1 85.8 84.3 82.1 80.6 79.1 74.6 71.6 70.1 64.2 57.5 50.7
Specificity (%) 61.0 67.8 77.1 82.2 83.9 85.6 89.0 89.0 90.7 91.5 91.5 92.4 94.1
PPV (%) 72.1 75.6 81.0 84.3 85.3 86.4 89.1 88.5 89.7 90.4 89.6 89.5 90.7
NPV (%) 82.8 83.3 82.7 82.2 80.5 79.5 78.9 75.5 73.8 73.0 69.2 65.7 62.7
Surgical patients (subgroup analysis)0.876
(0.790, 0.962), P <0.001
Sensitivity (%) 95.7 87.0 87.0 87.0 87.0 82.6 73.9 69.6 69.6 69.6 60.9 52.2 34.8
Specificity (%) 63.9 69.4 69.4 72.2 75.0 77.8 80.6 83.3 83.3 88.9 88.9 91.7 94.4
PPV (%) 62.9 64.5 64.5 66.7 69.0 70.4 70.8 72.7 72.7 80.0 77.8 80.0 80.0
NPV (%) 95.8 89.3 89.3 89.7 90.0 87.5 82.9 81.1 81.1 82.1 78.0 75.0 69.4
AUC, area under the receiver operating characteristic curves; CI, confidence interval; PCT, procalcitonin; PPV, positive predictive value; NPV, negative predictive value.
Table 4. Univariate and multivariate analysis of data from 311 patients
Independent variables Univariate analysis Multivariate analysis
OR (95% CI) P-value OR (95% CI) P-value Independent variables associated with PCT level ≥0.5 ng/mL
Sepsis 36.39 (16.61, 79.71) <0.001 24.08 (10.30, 56.34) <0.001
Hemodialysis 5.85 (2.19, 15.58) <0.001 8.89 (2.88, 27.51) <0.001
Pneumonia 9.23 (4.52, 18.84) <0.001 3.41 (1.35, 8.62) 0.009
Having SIRS 3.64 (2.16, 6.14) <0.001 1.46 (0.71, 3.02) 0.303
Urinary tract infections 3.58 (1.58, 8.13) 0.001 1.72 (0.55, 5.37) 0.350 WBC ≥12,000 cells/mm3 2.03 (1.29, 3.19) 0.002 1.06 (0.55, 2.06) 0.861
Cancer 1.12 (0.64, 1.97) 0.695
Surgery 0.91 (0.52, 1.61) 0.747
OR, odds ratio; CI, confidence interval; PCT, procalcitonin; SIRS, systemic inflammation response syndrome;
WBC, white blood cell count.
DISCUSSION
Our study results showed that the median PCT level was significantly higher among patients with bacterial infections than among those without bacterial infections, which corroborates the results of previous studies [8-10]. The proposed stimuli for PCT induction were
lipoteichoic acid of Gram-positive bacteria, lipopolysaccharide of Gram-negative bacteria, and pro-inflammatory cytokines (tumor necrosis factor-alpha and interleukin-6) [17-19].
Bacterial structure was the most potent stimulus of PCT production, while pro-inflammatory cytokines in the absence of bacteria were not strong inducers [7, 20, 21]. A previous study showed a correlation between the level of pro-inflammatory cytokines and PCT level in bacterial infection [18]. Excessive pro-inflammatory cytokines were produced in patients with sepsis; thus, high PCT levels were observed in patients with sepsis [22].
We performed a large-scale study using the SOFA score for the detection of bacterial sepsis. We identified an optimal cut-off value of 0.5 ng/mL, with a sensitivity of 84.7% and a specificity of 79.9%. Previous studies that aimed to identify the optimal cut-off value of PCT for differentiating between sepsis and systemic inflammation response syndrome, reported different optimal cut-off values ranging from 1.1–2.415 ng/mL with sensitivities and specificities that varied from 63–97% and 78–91%, respectively [8-10]. Moreover, surgical patients had higher PCT levels than did surgical patients [23]. Our findings were discordant with those of previous studies [8-10, 23]. The differences could be explained by the differences in the number of enrolled patients and conditions other than sepsis found to be the cause of elevated PCT level such as trauma, surgery, pancreatitis, invasive fungal infection, cardiogenic shock, and severe renal failure [18, 24-26].
Interestingly, previous study attributed the higher PCT level among surgical patients than among medical patients [23]. The majority of surgical procedures were either abdominal or thoracic surgeries [23]. The post-operative PCT level were > 0.5 ng/ml of patents undergoing abdominal surgery or those undergoing thoracic surgery [24, 27]. The increase in PCT level may be due to the intestinal translocation of the bacteria or the transient bacteremia during surgical procedures [28, 29]. Contrary to the findings of this study, the majority of our surgical procedures were either neurological or orthopedic surgeries; thus, transient bacteremia did not occur and PCT levels were reported as <0.2 ng/mL and 0.26 ng/mL, respectively [20, 30].
The increase in PCT levels in patients after orthopedic surgery and neurosurgery may be due to the up-regulation of pro-inflammatory cytokines [18, 19, 31, 32]. For this reason, only slight increases in post-operative PCT levels occurred in our surgical patients and were not different from those found in medical patients. In our study, the majority of 31 of 154 patients without bacterial infection who had PCT levels >0.5 ng/mL were trauma patients and patients with chronic renal failure on hemodialysis (Supplementary Table 2). In the multivariate analysis, no false positive results were identified among patients undergoing hemodialysis.
Our study found a median PCT level of 0.62 ng/mL among patients undergoing hemodialysis and without bacterial infection (data not shown). This finding was concordant with that of a previous study that showed that the mean PCT level among those patients was as high as 0.58 ng/mL [26]. Due to the composition of the non-bacterial infection group in our study, the majority of whom were stroke patients (33.7%) and congestive heart failure patients (12.3%), surgery was not a strong PCT inducer (data not shown). For these reasons, PCT levels in patients without bacterial infection were lower in our study than those declared in previous reports [8-10].
The sensitivity of the optimal cut-off value was lower in our study (84.7%) than that reported by Harbarth et al. (97%), while the specificity was similar (79.9% in our study vs. 78%
reported by Harbarth et al.) [9]. The observed difference could be explained by the difference in the characteristics of the patients enrolled in the bacterial infection group. All the patients enrolled in the study conducted by Harbarth et al. had sepsis [9]. In our study, 75.8% of patients had sepsis, while the remaining had localized infections. Our results showed that all patients with localized infections, including skin and soft tissue infections and bronchitis had PCT levels <0.5 ng/mL (data not shown). In addition, 56.4% of patients with urinary tract infections without sepsis had PCT levels <0.5 ng/mL (data not shown). Our findings were concordant with those of previous studies [33-35]. Notably, only patients with sepsis in this study showed a high sensitivity of 93.3% when using an optimal cut-off value of 0.5 ng/mL.
This finding confirmed that localized infection is a stimulus for PCT production, but does so to a lesser extent than sepsis.
Our results provided the optimal cut-off value of PCT for the accurate diagnosis of bacterial infections in critically-ill patients. Using the PCT level to guide the initiation of antibiotic administration, could reduce the mortality rate as well as the rate of unnecessary antibiotic use. However, some non-infectious diseases, as mentioned above, were causes of elevated PCT levels ≥0.5 ng/mL.
Our study had some limitations. First, the data were collected retrospectively. Some data such as the APACHE-II score and lactate level could not be retrieved. However, this study reported the in-hospital mortality rate for comparison of severity between both groups.
Second, this study did not classify patients according to the status of septic shock based on the new criteria because blood lactate data were missing. Further investigations are needed to determine and classify patients with septic shock based on the new criteria.
Despite these limitations, our study had some strengths. First, there were clear criteria for the diagnosis of bacterial infections, especially sepsis. Second, our study enrolled patients with either positive or negative microbiological culture results in the bacterial infectious diseases group that represented a real situation in clinical practice. Finally, we enrolled many patients with PCT values, which would make our assessment of the optimal cut-off more accurate for the detection of sepsis.
In conclusion, the biomarker PCT, can be used as an indicator of severe bacterial infection, including sepsis. It is helpful to differentiate between fevers due to bacterial infections from those due to non-bacterial infections. The optimal cut-off value for the diagnosis of bacterial infection was 0.5 ng/mL.
ACKNOWLEDGMENTS
This study was funded by Department of Pharmacy, Faculty of Pharmacy, Mahidol University, Bangkok, Thailand.
SUPPLEMENTARY MATERIALS
Supplementary Table 1 The definable source of infections Click here to view
Supplementary Table 2
The characteristic of patients with procalcitonin level above than 0.5 ng/mL Click here to view
REFERENCES
1. Barati M, Alinejad F, Bahar MA, Tabrisi MS, Shamshiri AR, Bodouhi NO, Karimi H. Comparison of WBC, ESR, CRP and PCT serum levels in septic and non-septic burn cases. Burns 2008;34:770-4.
PUBMED | CROSSREF
2. Laupland KB. Fever in the critically ill medical patient. Crit Care Med 2009;37 (Suppl 7):S273-8.
PUBMED | CROSSREF
3. Levin PD, Idrees S, Sprung CL, Weissman C, Weiss Y, Moses AE, Benenson S. Antimicrobial use in the ICU: indications and accuracy--an observational trial. J Hosp Med 2012;7:672-8.
PUBMED | CROSSREF
4. Huttner A, Harbarth S, Carlet J, Cosgrove S, Goossens H, Holmes A, Jarlier V, Voss A, Pittet D.
Antimicrobial resistance: a global view from the 2013 World Healthcare-Associated Infections Forum.
Antimicrob Resist Infect Control 2013;2:31.
PUBMED | CROSSREF
5. Pittet D, Rangel-Frausto S, Li N, Tarara D, Costigan M, Rempe L, Jebson P, Wenzel RP. Systemic inflammatory response syndrome, sepsis, severe sepsis and septic shock: incidence, morbidities and outcomes in surgical ICU patients. Intensive Care Med 1995;21:302-9.
PUBMED | CROSSREF
6. Schuetz P, Albrich W, Mueller B. Procalcitonin for diagnosis of infection and guide to antibiotic decisions:
past, present and future. BMC Med 2011;9:107.
PUBMED | CROSSREF
7. Dandona P, Nix D, Wilson MF, Aljada A, Love J, Assicot M, Bohuon C. Procalcitonin increase after endotoxin injection in normal subjects. J Clin Endocrinol Metab 1994;79:1605-8.
PUBMED
8. Castelli GP, Pognani C, Meisner M, Stuani A, Bellomi D, Sgarbi L. Procalcitonin and C-reactive protein during systemic inflammatory response syndrome, sepsis and organ dysfunction. Crit Care 2004;8:R234-42.
PUBMED | CROSSREF
9. Harbarth S, Holeckova K, Froidevaux C, Pittet D, Ricou B, Grau GE, Vadas L, Pugin J. Diagnostic value of procalcitonin, interleukin-6, and interleukin-8 in critically ill patients admitted with suspected sepsis. Am J Respir Crit Care Med 2001;164:396-402.
PUBMED | CROSSREF
10. BalcI C, Sungurtekin H, Gürses E, Sungurtekin U, Kaptanoglu B. Usefulness of procalcitonin for diagnosis of sepsis in the intensive care unit. Crit Care 2003;7:85-90.
PUBMED | CROSSREF
11. Dellinger RP, Levy MM, Rhodes A, Annane D, Gerlach H, Opal SM, Sevransky JE, Sprung CL, Douglas IS, Jaeschke R, Osborn TM, Nunnally ME, Townsend SR, Reinhart K, Kleinpell RM, Angus DC, Deutschman CS, Machado FR, Rubenfeld GD, Webb SA, Beale RJ, Vincent JL, Moreno R; Surviving Sepsis Campaign Guidelines Committee including the Pediatric Subgroup. Surviving sepsis campaign: international guidelines for management of severe sepsis and septic shock: 2012. Crit Care Med 2013;41:580-637.
PUBMED | CROSSREF
12. Wacker C, Prkno A, Brunkhorst FM, Schlattmann P. Procalcitonin as a diagnostic marker for sepsis: a systematic review and meta-analysis. Lancet Infect Dis 2013;13:426-35.
PUBMED | CROSSREF
13. Singer M, Deutschman CS, Seymour CW, Shankar-Hari M, Annane D, Bauer M, Bellomo R, Bernard GR, Chiche JD, Coopersmith CM, Hotchkiss RS, Levy MM, Marshall JC, Martin GS, Opal SM, Rubenfeld GD, van der Poll T, Vincent JL, Angus DC. The third international consensus definitions for sepsis and septic shock (Sepsis-3). JAMA 2016;315:801-10.
PUBMED | CROSSREF
14. Kalil AC, Metersky ML, Klompas M, Muscedere J, Sweeney DA, Palmer LB, Napolitano LM, O'Grady NP, Bartlett JG, Carratalà J, El Solh AA, Ewig S, Fey PD, File TM Jr, Restrepo MI, Roberts JA, Waterer GW, Cruse P, Knight SL, Brozek JL. Management of adults with hospital-acquired and ventilator-associated pneumonia: 2016 clinical practice guidelines by the Infectious Diseases Society of America and the American Thoracic Society. Clin Infect Dis 2016;63:e61-111.
PUBMED | CROSSREF
15. Barlam TF, Cosgrove SE, Abbo LM, MacDougall C, Schuetz AN, Septimus EJ, Srinivasan A, Dellit TH, Falck-Ytter YT, Fishman NO, Hamilton CW, Jenkins TC, Lipsett PA, Malani PN, May LS, Moran GJ, Neuhauser MM, Newland JG, Ohl CA, Samore MH, Seo SK, Trivedi KK. Implementing an antibiotic stewardship program: guidelines by the Infectious Diseases Society of America and the Society for Healthcare Epidemiology of America. Clin Infect Dis 2016;62:e51-77.
PUBMED | CROSSREF
16. Horan TC, Andrus M, Dudeck MA. CDC/NHSN surveillance definition of health care-associated infection and criteria for specific types of infections in the acute care setting. Am J Infect Control 2008;36:309-32.
PUBMED | CROSSREF
17. Brodská H, Malíčková K, Adámková V, Benáková H, Šťastná MM, Zima T. Significantly higher
procalcitonin levels could differentiate Gram-negative sepsis from Gram-positive and fungal sepsis. Clin Exp Med 2013;13:165-70.
PUBMED | CROSSREF
18. Becker KL, Snider R, Nylen ES. Procalcitonin assay in systemic inflammation, infection, and sepsis:
clinical utility and limitations. Crit Care Med 2008;36:941-52.
PUBMED | CROSSREF
19. Schneider HG, Lam QT. Procalcitonin for the clinical laboratory: a review. Pathology 2007;39:383-90.
PUBMED | CROSSREF
20. Hunziker S, Hügle T, Schuchardt K, Groeschl I, Schuetz P, Mueller B, Dick W, Eriksson U, Trampuz A. The value of serum procalcitonin level for differentiation of infectious from noninfectious causes of fever after orthopaedic surgery. J Bone Joint Surg Am 2010;92:138-48.
PUBMED | CROSSREF
21. Tamaki K, Kogata Y, Sugiyama D, Nakazawa T, Hatachi S, Kageyama G, Nishimura K, Morinobu A, Kumagai S. Diagnostic accuracy of serum procalcitonin concentrations for detecting systemic bacterial infection in patients with systemic autoimmune diseases. J Rheumatol 2008;35:114-9.
PUBMED
22. Hotchkiss RS, Karl IE. The pathophysiology and treatment of sepsis. N Engl J Med 2003;348:138-50.
PUBMED | CROSSREF
23. Clec'h C, Fosse JP, Karoubi P, Vincent F, Chouahi I, Hamza L, Cupa M, Cohen Y. Differential diagnostic value of procalcitonin in surgical and medical patients with septic shock. Crit Care Med 2006;34:102-7.
PUBMED | CROSSREF
24. Meisner M, Tschaikowsky K, Hutzler A, Schick C, Schüttler J. Postoperative plasma concentrations of procalcitonin after different types of surgery. Intensive Care Med 1998;24:680-4.
PUBMED | CROSSREF
25. Picariello C, Lazzeri C, Chiostri M, Gensini GF, Valente S. Kinetic of procalcitonin in patients with cardiogenic shock following acute myocardial infarction: preliminary data. HSR Proc Intensive Care Cardiovasc Anesth 2010;2:201-7.
PUBMED
26. Level C, Chauveau P, Delmas Y, Lasseur C, Pellé G, Peuchant E, Montaudon D, Combe C. Procalcitonin: a new marker of inflammation in haemodialysis patients? Nephrol Dial Transplant 2001;16:980-6.
PUBMED | CROSSREF
27. Franke A, Lante W, Fackeldey V, Becker HP, Kurig E, Zöller LG, Weinhold C, Markewitz A. Pro- inflammatory cytokines after different kinds of cardio-thoracic surgical procedures: is what we see what we know? Eur J Cardiothorac Surg 2005;28:569-75.
PUBMED | CROSSREF
28. Andersen LW, Landow L, Baek L, Jansen E, Baker S. Association between gastric intramucosal pH and splanchnic endotoxin, antibody to endotoxin, and tumor necrosis factor-alpha concentrations in patients undergoing cardiopulmonary bypass. Crit Care Med 1993;21:210-7.
PUBMED | CROSSREF
29. Buttenschoen K, Buttenschoen DC, Berger D, Vasilescu C, Schafheutle S, Goeltenboth B, Seidelmann M, Beger HG. Endotoxemia and acute-phase proteins in major abdominal surgery. Am J Surg 2001;181:36-43.
PUBMED | CROSSREF
30. Laifer G, Wasner M, Sendi P, Graber P, Gratzl O, Huber P, Fluckiger U, Zimmerli W. Dynamics of serum procalcitonin in patients after major neurosurgery. Clin Microbiol Infect 2005;11:679-81.
PUBMED | CROSSREF
31. Osuka K, Suzuki Y, Saito K, Takayasu M, Shibuya M. Changes in serum cytokine concentrations after neurosurgical procedures. Acta Neurochir (Wien) 1996;138:970-6.
PUBMED | CROSSREF
32. Bouaicha S, Blatter S, Moor BK, Spanaus K, Dora C, Werner CM. Early serum procalcitonin level after primary total hip replacement. Mediators Inflamm 2013;2013:927636.
PUBMED | CROSSREF
33. Eder J, Hlavin G, Haushofer A, Trubert-Exinger D, Trautinger F. Correlation of serum procalcitonin with the severity of skin and skin structure infections - a pilot study. J Dtsch Dermatol Ges 2012;10:564-71.
PUBMED
34. Daniels JM, Schoorl M, Snijders D, Knol DL, Lutter R, Jansen HM, Boersma WG. Procalcitonin vs C-reactive protein as predictive markers of response to antibiotic therapy in acute exacerbations of COPD.
Chest 2010;138:1108-15.
PUBMED | CROSSREF
35. Pecile P, Miorin E, Romanello C, Falleti E, Valent F, Giacomuzzi F, Tenore A. Procalcitonin: a marker of severity of acute pyelonephritis among children. Pediatrics 2004;114:e249-54.
PUBMED | CROSSREF