RESEARCH ARTICLE
Received: February 25, 2020, Revised: March 2, 2020, Accepted: March 4, 2020 eISSN 2233-7679
†Correspondence to: Ji-Hyoung Han, https://orcid.org/0000-0003-1613-2879
Department of Dental Hygiene, Suwon Science College, 288 Seja-ro, Jeongnam-myeon, Hwaseong 18516, Korea Tel: +82-31-350-2418, Fax: +82-31-350-2075, E-mail: [email protected]
Copyright © The Korean Society of Dental Hygiene Science.
The Relationship between Smartphone Use and Oral Health in Adolescents
Eunsuk Ahn
1and Ji-Hyoung Han
2,†1
Department of Dental Hygiene, Daejeon Institute of Science and Technology, Daejeon 35408,
2
Department of Dental Hygiene, Suwon Science College, Hwaseong 18516, Korea
Background: Smartphones are a modern necessity. While they are convenient to use, smartphones also have side effects such
as addiction. This study assessed the relationship between smartphone use, a part of everyday life in modern society, and oral health.
Methods: An analysis was conducted using 2017 Korea Youth Risk Behavior Web-based Survey data. The propensity score
estimation algorithm used logistic regression and 1:1 matching algorithm using nearest-neighbor matching. After matching, a total of 15,032 participants were classified into two groups containing 7,516 teenagers each who did and did not use smartphones, respectively.
Results:
Comparison of oral health behaviors according to smartphone use revealed a statistically significant difference in the frequency of tooth brushing per day, use of oral hygiene products, intake of foods harmful to oral health, and experience of oral health education (p<0.05). The factors affecting oral pain experience of adolescents were examined. Compared to male participants, female participants had an odds ratio of 1.627 for oral pain (p<0.05). According to the household income level, compared to the group with higher income, the group with lower income showed higher oral pain experience (p<0.05). Oral pain experience was 1.601 times more frequent among teenagers using smartphones (p<0.05).
Conclusion: The results of this study indicated that use of smartphones by adolescents affected their oral health. These findings
indicate the need for improved oral health management through the use of effective school oral health programs and individual counseling by oral health professionals, promotion of information dissemination through public media, and development of prevention strategies.
Key Words: Adolescent, Oral health, Smartphone
Introduction
In addition to Internet use, smartphones are now a necessity for modern life. Daily living activities start and end with the use of a smartphone. People use their smartphones for financial services and news, social media, messengers, movies, reading, watching television, and playing games. As such, smartphones have a net function that makes everyday life easier. However, while smartphones offer conveniences, they also have side effects such as addiction.
According to the Ministry of Science and ICT and the Korea Internet & Security Agency, 89.5% of individuals over 3 years of age had smartphones in 2018, 19.1% of whom are at risk of overdependency. In particular, 34.0%
of middle school students and 28.3% of high school students were at risk for overdependence, the highest rates compared with other age groups. The use of messengers by content was the highest, followed by social networking service (SNS), news, movies, television, videos, and games
1).
Adolescent overdependence on smartphones causes
problems in communication with others due to neglect of
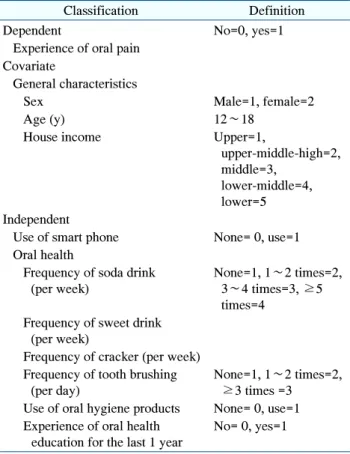
Table 1. Definition of Variables
Classification Definition
Dependent No=0, yes=1
Experience of oral pain Covariate
General characteristics
Sex Male=1, female=2
Age (y) 12∼18
House income Upper=1,
upper-middle-high=2, middle=3,
lower-middle=4, lower=5 Independent
Use of smart phone None= 0, use=1 Oral health
Frequency of soda drink (per week)
None=1, 1∼2 times=2, 3∼4 times=3, ≥5 times=4
Frequency of sweet drink (per week)
Frequency of cracker (per week) Frequency of tooth brushing
(per day)
None=1, 1∼2 times=2,
≥3 times =3 Use of oral hygiene products None= 0, use=1 Experience of oral health
education for the last 1 year
No= 0, yes=1 external relationships and reduced ability to adapt to
school life
2,3). In addition, overdependence has been reported to negatively affect not only family relationships, mental health, and sleep disturbances but also physical health and eating habits
4,5). Furthermore, smartphone use is associated with decreased physical activity and has been reported to affect obesity rates depending on smartphone usage time
6,7).
Adolescence is a period of rapid physical development as well as psychological and social growth. The health beliefs and behaviors formed in adolescence affect adulthood. Therefore, attention to adolescent health is important
8,9). The general characteristics of the oral condition of adolescents frequently include increased snack intake, multiple dental caries, and progression from gingivitis to periodontal disease
10). Oral health care in adolescence is important because dental caries and periodontal disease, which are serious oral diseases, affect tooth loss in adulthood and old age. Korean adolescents may neglect oral health care because of stress and lack of time due to schoolwork. Especially in the modern society, the side effects of smartphones are additive; thus, increased attention is required.
Although studies have compared the relationship between smartphone use and oral health in adolescents, few have compared factors affecting oral health after adjusting for demographic factors. This study investigated the factors affecting the oral health of adolescents after propensity score matching for socio-demographic character- istics. The results of this study are intended to provide basic data for policies related to the use of smart devices in oral health promotion projects in adolescents.
Materials and Methods
1. Subjects
This study analyzed data from the 2017 Korea Youth Risk Behavior Web-based Survey. In general, selection bias may occur in observational studies when selecting target and comparative groups. Accurate inferences of causality are not possible or can also lead to errors that can underestimate or overestimate the results
11,12). Therefore, this study selected variables to control for confounding variables in the design stage, calculated the variables as
covariates, and used propensity score matching to form similar experimental and control groups
13). The propensity score estimation algorithm used logistic regression and a 1:1 matching algorithm using nearest-neighbor matching.
The covariates were sex, age, and economic status and the binary treatment indicators were based on smartphone use.
The study population before matching was 61,861; after matching, 7,516 adolescents each were classified into smartphone and non-smartphone use groups, with a total of 15,032 participants.
2. Variables used in the analysis
The variables used in the analysis are shown in Table 1.
The questions “Have you had a tooth sore in the last 12
months?” and “Have you had gum pain or bleeding in the
last 12 months?” were used as oral pain variables. The
covariates considered socio-demographic characteristics
such as sex, age, and household income level. The
independent variables included smartphone use and oral
health behaviors including intake of soda drinks, sweet
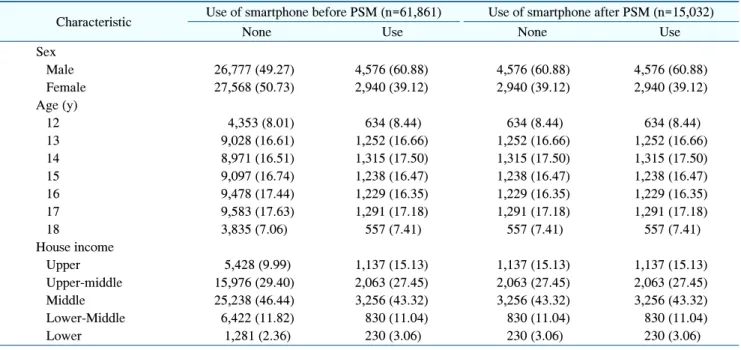
Table 2. Sample Characteristics
Characteristic Use of smartphone before PSM (n=61,861) Use of smartphone after PSM (n=15,032)
None Use None Use
Sex
Male 26,777 (49.27) 4,576 (60.88) 4,576 (60.88) 4,576 (60.88)
Female 27,568 (50.73) 2,940 (39.12) 2,940 (39.12) 2,940 (39.12)
Age (y)
12 4,353 (8.01) 634 (8.44) 634 (8.44) 634 (8.44)
13 9,028 (16.61) 1,252 (16.66) 1,252 (16.66) 1,252 (16.66)
14 8,971 (16.51) 1,315 (17.50) 1,315 (17.50) 1,315 (17.50)
15 9,097 (16.74) 1,238 (16.47) 1,238 (16.47) 1,238 (16.47)
16 9,478 (17.44) 1,229 (16.35) 1,229 (16.35) 1,229 (16.35)
17 9,583 (17.63) 1,291 (17.18) 1,291 (17.18) 1,291 (17.18)
18 3,835 (7.06) 557 (7.41) 557 (7.41) 557 (7.41)
House income
Upper 5,428 (9.99) 1,137 (15.13) 1,137 (15.13) 1,137 (15.13)
Upper-middle 15,976 (29.40) 2,063 (27.45) 2,063 (27.45) 2,063 (27.45)
Middle 25,238 (46.44) 3,256 (43.32) 3,256 (43.32) 3,256 (43.32)
Lower-Middle 6,422 (11.82) 830 (11.04) 830 (11.04) 830 (11.04)
Lower 1,281 (2.36) 230 (3.06) 230 (3.06) 230 (3.06)
Values are presented as n (%).
PSM: propensity score matching.
drinks, and cracker over the past week. The analysis also included the average frequency of tooth brushing per day, use of oral hygiene products, and oral health education experiences.
3. Data analysis
The general characteristics of the study subjects were confirmed through frequency analysis. Chi-square tests were performed to compare oral health behaviors and oral pain experiences according to smartphone use. Finally, logistic regression analysis was performed to identify factors affecting oral pain experience. All analyses were performed using STATA version 14.0 (Stata Corp., College Station, TX, USA) with a significance level of p=0.05.
Results
1. General characteristics
The general characteristics of the subjects are shown in Table 2. The distribution of the characteristics between the two groups before and after propensity score matching was compared to make the distribution similar between
the groups according to smartphone use, the character- istics between the group using smartphone and the group without the smartphone were used as covariate variables.
It was observed that the differences in the characteristics of the individuals in the group decreased.
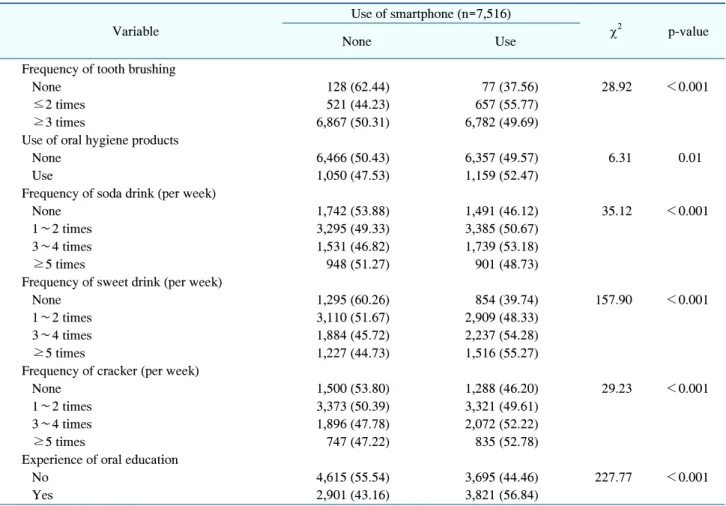
2. Comparison of oral health behavior according to smartphone use
A comparison of oral health behavior in adolescents according to smartphone use is shown in Table 3. The average frequency of tooth brushing per day, use of oral hygiene products, intake of foods harmful to oral health, and experience of oral health education differed sign- ificantly between user groups (p<0.05). The daily average frequency of tooth brushing showed a higher proportion of adolescents who brushed more than three times daily among those who did not use a smartphone (50.31%) compared to those who used a smartphone (49.69%).
However, the use of axillary oral hygiene products was higher in smartphone used adolescents (52.47%) than that in adolescents who did not use smartphones (47.53%).
Comparison of foods that are harmful to oral health
showed that adolescents who did not use smartphones do
Table 3. Oral Health Behavior according to Using Smart Phone
Variable
Use of smartphone (n=7,516)
2p-value
None Use
Frequency of tooth brushing
None 128 (62.44) 77 (37.56) 28.92 <0.001
≤2 times 521 (44.23) 657 (55.77)
≥3 times 6,867 (50.31) 6,782 (49.69)
Use of oral hygiene products
None 6,466 (50.43) 6,357 (49.57) 6.31 0.01
Use 1,050 (47.53) 1,159 (52.47)
Frequency of soda drink (per week)
None 1,742 (53.88) 1,491 (46.12) 35.12 <0.001
1∼2 times 3,295 (49.33) 3,385 (50.67)
3∼4 times 1,531 (46.82) 1,739 (53.18)
≥5 times 948 (51.27) 901 (48.73)
Frequency of sweet drink (per week)
None 1,295 (60.26) 854 (39.74) 157.90 <0.001
1∼2 times 3,110 (51.67) 2,909 (48.33)
3∼4 times 1,884 (45.72) 2,237 (54.28)
≥5 times 1,227 (44.73) 1,516 (55.27)
Frequency of cracker (per week)
None 1,500 (53.80) 1,288 (46.20) 29.23 <0.001
1∼2 times 3,373 (50.39) 3,321 (49.61)
3∼4 times 1,896 (47.78) 2,072 (52.22)
≥5 times 747 (47.22) 835 (52.78)
Experience of oral education
No 4,615 (55.54) 3,695 (44.46) 227.77 <0.001
Yes 2,901 (43.16) 3,821 (56.84)
p-value of Chi-squared test.
not consume these foods than once weekly compared to adolescents who used smartphones. A difference was also observed in the types of food ingested. Comparison of consumption of foods harmful to oral health more than five times per week showed higher ingestion of sweet drinks (55.27%) and sweets (52.78%) among smartphone users. Similarly, more adolescent smartphone users had experience with oral health education (56.84%).
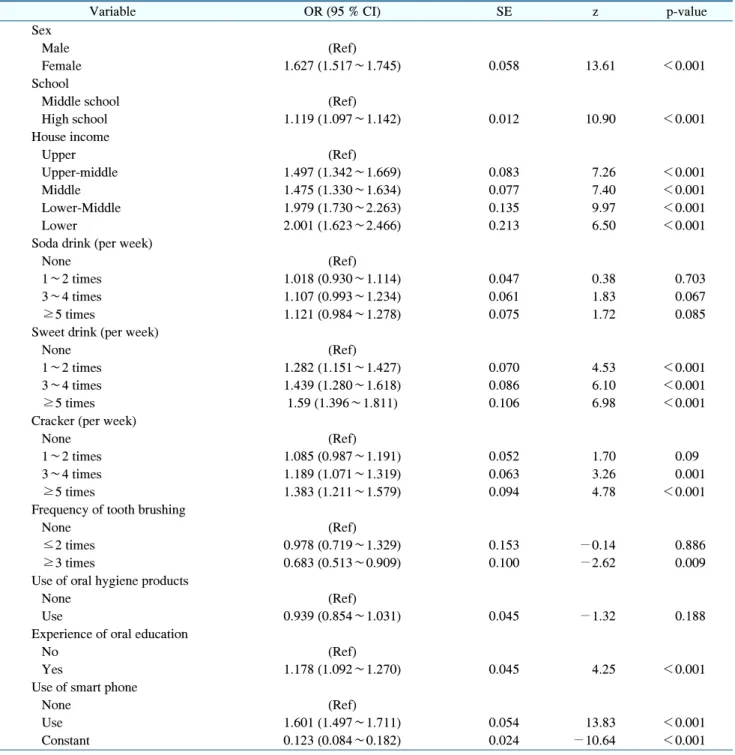
3. Factors influencing the oral pain experience of adolescents
Table 4 shows the factors influencing the oral pain experience of adolescents. Compared to male participants, female participants had an odds ratio of 1.627 for oral pain (p<0.05). According to household income level, partici- pants with lower income had experienced oral pain more often than had those with higher income. In particular, the
group with lower income had an odds ratio twice that in the higher income group. Increased intake of foods that are harmful to oral health is associated with higher occurrence of oral pain (p<0.05). Adolescents who brushed their teeth three or more times per day tended to experience less oral pain than did those who did not brush their teeth (p<
0.05). Analysis of the experience of oral pain according to smartphone use showed more frequent pain among those using smartphones, with an odds ratio of 1.601 (p<0.05).
Discussion
Smartphones provide convenience and pleasure to our
lives. However, excessive smartphone use can lead to
addiction and side effects such as poor academic per-
formance, cognitive function, and emotional control, as
well as interpersonal difficulties. In particular, adolescents
Table 4. Factors Affecting Experience of Oral Pain