Addition of N-terminal Pro-B-type Natriuretic Peptide Levels to Electrocardiography Criteria for Detection of Left Ventricular Hypertrophy: The ARIRANG Study
The utility of electrocardiography (ECG) in screening for left ventricular hypertrophy (LVH) in general populations is limited mainly because its low sensitivity. B-type natriuretic peptide (BNP) is released due to the remodeling processes of LVH and could improve the diagnostic accuracy for the ECG criteria for LVH. We hypothesized that addition of BNP levels to ECG criteria could aid LVH detection compared with ECG alone in a general population. We enrolled consecutive 343 subjects from a community-based cohort. LVH was defined as LV mass index > 95 g/m2 for females and > 115 g/m2 for males according to echocardiography. The area under the receiver operator characteristic (ROC) curve to detect LVH was 0.55 (95% confidence interval [CI], 0.50-0.61) in Sokolow-Lyon criteria and 0.53 (0.47-0.59) in the Cornell voltage criteria. After addition of N-terminal-proBNP levels to the model, the corresponding areas under the ROC were 0.63 (0.58-0.69) and 0.64 (0.59-0.69), respectively. P values for the comparison in areas under the ROC for models with and without N-terminal-proBNP levels were < 0.001. These data suggest that addition of N-terminal-proBNP levels to ECG criteria could significantly improve the diagnostic accuracy of LVH in general populations.
Keywords: Hypertrophy; Left Ventricular; Electrocardiography; Natriuretic Peptides Min-Soo Ahn,1 Byung-Su Yoo,1
Ji Hyun Lee,1 Jun-Won Lee,1 Young Jin Youn,1 Sung Gyun Ahn,1 Jang-Young Kim,1 Seung-Hwan Lee,1 Junghan Yoon,1 Jong-ku Park,2 Song Vogue Ahn,2 and Eunhee Choi3
1Department of Cardiology, 2Department of Preventive Medicine, Institute of Genomic Cohort, and 3Institute of Life Style Medicine, Wonju College of Medicine, Yonsei University, Wonju, Korea Received: 28 April 2014
Accepted: 3 December 2014 Address for Correspondence:
Byung-Su Yoo, MD
Department of Cardiology, Wonju College of Medicine, Yonsei University, 20 Ilsan-ro, Wonju 220-701, Korea
Tel: +82.33-741-0909, Fax: +82.33-741-1219 E-mail: [email protected]
Funding: This work was supported by a research grant from Yonsei University Wonju College of Medicine (YUWCM 2013-26).
http://dx.doi.org/10.3346/jkms.2015.30.4.407 • J Korean Med Sci 2015; 30: 407-413
INTRODUCTION
Left ventricular hypertrophy (LVH) is an important risk factor in hypertensive patients and the general population. LVH can lead to a 5-10-fold increase in cardiovascular risk, which is sim- ilar to the increase seen in patients with a history of myocardial infarction (1-4). LVH has important implications for assessment of the future risk of cardiovascular disease and for decision-mak- ing regarding interventions other than antihypertensive treat- ment, such as lipid-lowering treatment and lifestyle modifica- tions (5). Therefore, accurate and early diagnosis of LVH is an important component of the care of patients who have hyper- tension and for those who do not have hypertension.
Echocardiography permits reliable, non-invasive estimation of left ventricular mass. It has proved to be a sensitive and prac- tical tool for the detection of LVH (6). However, echocardiogra- phy is not affordable for community-wide screening for LVH because it is expensive, and measurements of LV mass are time- consuming. Hence, simple tools are needed to facilitate the iden- tification and screening of LVH in hypertensive patients and the general population.
Until recently, electrocardiography (ECG) was a simple and
acceptable tool for screening LVH in the general population.
More than 30 ECG indices for the diagnosis of LVH based on standard 12-lead ECG have been described. However, the diag- nostic values of various indices are modest because they have high specificity but very low sensitivity. Furthermore, the accu- racy of ECG criteria for the detection of LVH was evaluated in Western countries. The diagnostic value of these indices in Asian populations is not clear because of physiological and genetic differences.
Natriuretic peptide acts a counter-regulatory hormone in a compensatory response to pressure and volume overload in LVH (7). N-terminal pro-B-type natriuretic peptide (NT-proB- NP) has been positively associated with, LV strain, activation of the renin-angiotensin-aldosterone system, myocardial fibrosis and myocyte necrosis (8, 9). In addition, recent evidence sug- gests that NT-proBNP could have a role in the diagnosis of LVH (10, 11). Whether measurement of NT-proBNP levels can be an additional tool for LVH screening in the general population is not known.
Here, we compared the diagnostic accuracy of ECG criteria alone with a combination of measurements of ECG and of NT- proBNP levels for the detection of LVH in a rural population in
Korea. We hypothesized that the latter could improve the de- tection of LVH compared with ECG alone.
MATERIALS AND METHODS Study population
The Korean Genome and Epidemiology Study on Atherosclero- sis Risk of Rural Areas in the Korean General Population (KoG- ES-ARIRANG) is a population-based prospective cohort study to assess the prevalence, incidence and risk factors for chronic degenerative disorders such as hypertension, diabetes mellitus (DM), osteoporosis, and cardiovascular disease (12-16). We used ancillary data from KoGES-ARIRANG. KoGES-ARIRANG invit- ed all adults aged 40-70 yr who resided in the rural areas of Won- ju and Pyengchang in Korea to participate in the study (12-16).
In the present study, we investigated 343 adults from the Ko- GES-ARIRANG cohort (n = 1,954) who had previously under- gone ECG, echocardiography, and measurement of NT-proBNP levels. For the present study, all participants underwent a com- plete cardiovascular evaluation following 8 hr of fasting at first visit day, which included: 1) history, physical examination, and anthropometric analysis; 2) measurement of heart rate and blood pressure (BP, measured after 10 min resting in a sitting position, was expressed as the average of three consecutive measurements taken from each arm); 3) measurement of fasting serum glucose and insulin levels (in subjects not receiving insulin and/or oral hypoglycemic agents); 4) measurement of fasting plasma lipids (i.e., concentrations of triglyceride, high-density lipoprotein cho- lesterol [HDL-C], total cholesterol, and low-density lipoprotein cholesterol [LDL-C]); 5) measurement of NT-proBNP; and 6) echocardiography and electrocardiography (12-16). Past medi- cal histories of subjects such as hypertension, diabetes mellitus and dyslipidemia were based on history taking. Subjects with systolic dysfunction (ejection fraction ≤ 55%, n = 127) or renal dysfunction (estimated glomerular filtration rate < 60 mL/min/
1.73 m2, n = 154) were excluded from the analysis (17).
Echocardiography
Echocardiography was undertaken by 3 cardiologists in harmon- ic imaging mode by use of a 3-MHz transducer and commercial ultrasound system (Vivid-7; General Electric-Vingmed, Milwau- kee, WI, USA). All echocardiographic data were analyzed off- line using a dedicated automated software (EchoPAC PC, Ver- sion 112; GE Health Care, Milwaukee, WI).
The internal dimensions, wall thickness, and ejection frac- tion of the left ventricle (i.e., LVEF, by the modified Simpson’s rule) were measured according to recommendations (18). LV mass was calculated as recommended by the American Society of Echocardiography using the equation: LV mass = 1.04 × ([PW +VS+LVDd]3-[LVDd]3) × 0.8+0.6 where PW is the M-mode thick- ness of the posterior wall of the LV, VS is the M-mode thickness
of the interventricular septum, and LVDd is the M-mode LV di- mension in the short-axis view at end-diastole (12, 19). To cor- rect for body surface area, the LV mass index (LVMI) was calcu- lated as LV mass/body surface area. Body surface area (BSA) was calculated using the formula: BSA = 0.007184 × weight0.425
× height0.725 (m2). LVH was defined as LVMI > 95 g/m2 for fe- males and > 115 g/m2 for males (17). Relative wall thickness (RWT), which increases with concentric remodeling and con- centric hypertrophy, was calculated as 2 × PW/LVDd. Three left atrial (LA) dimensions were used to calculate LA volume as an ellipse using the formula: LA volume =π/6 (SA1 ∙ SA2 ∙ LA) where SA1 =M-mode LA dimension, and SA2 and LA are measure- ments of the short- and long-axis with the apical four-chamber view at ventricular end-systole, respectively (17). The LA vol- ume index was calculated by dividing the LA volume by the BSA (m2). Transmitral inflow velocities were measured using pulsed-wave Doppler (PWD) ultrasound and the apical four- chamber view, with the sample volume placed at the tips of mi- tral-valve leaflets. Measurements of transmitral early diastolic (E-wave) and atrial (A-wave) velocities were taken to calculate the E/A ratio and E-wave deceleration time. Tissue Doppler im- aging (TDI) and the apical four-chamber view were used to mea- sure LV myocardial velocities, with the sample volume placed at the septal mitral annulus (12, 20, 21). Measurements com- prised the early diastolic velocity (E’) and late diastolic velocity (A´). The E/E´ ratio was then calculated (12, 22).
ECG
A standard, at rest, 12-lead recording was made during quiet respiration, with subjects in the supine position. The electrocar- diogram was recorded at 25 mm/s and 0.1 mV/mm standard- ization. ECG criteria for the diagnosis of LVH were the Sokolow- Lyon criteria (S in V1+R in V5 or V6 [whichever was larger] > 35 mm) and the Cornell voltage criteria (S in V3+R in aVL > 28 mm in males, and S in V3+R in aVL > 20 mm in females) (23, 24).
Measurement of plasma levels of NT-proBNP
Blood samples were obtained from fasting participants in the morning. Subjects were in the supine position, and blood ob- tained from the antecubital vein. Samples were transferred im- mediately to pre-chilled tubes containing ethylenediamine tet- ra-acetic acid and then stored at -70°C for future analyses (25).
Plasma levels of NT-proBNP were measured using an electro- chemiluminesence assay (Elecsys 2010®; Roche Diagnostics, Indianapolis, IN, USA) using established methods (26). The low- er limit of detection was 4 pg/mL. The mean coefficient varia- tion for these samples was 2.7%.
Statistical analyses
Statistical analyses were carried out using SPSS v20 (SPSS, Chi- cago, IL, USA). Data are the mean ± standard deviation for con-
tinuous variables and as proportions for categorical variables.
The chi-square test was used to determine differences in cate- gorical variables between groups. Sensitivity was defined as the number of true-positive tests divided by the total number of pa- tients with LVH as defined by echocardiography. Specificity was defined as the number of true-negative tests divided by the to- tal number of patients who did not have LVH. The BNP level was log-transformed to achieve normality and correlation analyses undertaken. To evaluate the added discrimination provided by NTproBNP levels to detect LVH beyond the information pro- vided by ECG criteria, we compared the areas under the receiv- er-operator curves (ROCs) in models employing ECG criteria with and without NTproBNP levels. Areas under ROC curves and the strength of the relationship were compared using Med- Calc v11.0 (MedCalc, Mariakerke, Belgium). A two-sided P < 0.05 was considered to be significant.
Ethics statement
KoGES-ARIRANG was approved by the institational review board of Wonju Christian Hospital, Wonju College of Medicine, Yonsei University (Wonju, Korea, approval number: CR105024). Writ- ten informed consent was obtained from all study participants.
RESULTS
Demographic and clinical characteristics
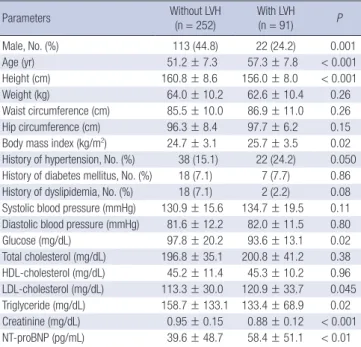
The demographic and clinical characteristics of the 343 subjects (mean age, 52.8 ± 7.9 yr; 39.4% males) were reported according
to the presence of LVH (Table 1). The prevalence of LVH was 26.5% and was significantly higher in females (16.3% of males and 33.2% of females, P < 0.001). Subjects with LVH were older and shorter compared with subjects who did not have LVH. Fast- ing blood glucose and triglyceride levels were significantly lower in the LVH group. The body mass index (BMI) was significantly higher in the LVH group (25.7 ± 3.5 vs. 24.7 ± 3.1 kg/m2, P = 0.02).
Echocardiographic characteristics
The mean LVEF was 65.4 ± 6.5%. In subjects with LVH, LVMI was 117.8 ± 19.2 g/m2, and LV geometry showed enlarged LV dimensions (5.3 ± 0.5 vs. 4.9 ± 0.5 cm, P < 0.001) and thicker walls (0.36 ± 0.08 vs. 0.33 ± 0.06, P = 0.02) (Table 2). LVEF was not different according to the presence of LVH. The mitral E ve- locity was similar between groups, but the A velocity was increas- ed in the LVH group (0.74 ± 0.19 vs. 0.68 ± 0.17 m/s, P = 0.01).
As a result, the E/A ratio decreased (0.87 ± 0.32 vs. 1.01 ± 0.34, P = 0.001). TDI revealed an elevated E/E´ ratio in the LVH group (10.6 ± 5.6 vs. 7.7 ± 5.4, P < 0.001).
Characteristics and performance of ECG
ECG characteristics according to the presence of LVH are dem- onstrated in Table 3. The prevalence of LVH as defined by So- kolow-Lyon criteria and by the Cornell voltage criteria was 4.1%
and 4.7%, respectively. ECG characteristics, including the So- kolow-Lyon voltage and Cornell voltage, were not significantly different regardless of LVH (Table 3). However, the Sokolow-Ly- on voltage was correlated with the LVMI (r = 0.18, P = 0.001), as
Table 1. Demographic and clinical characteristics
Parameters Without LVH
(n = 252)
With LVH
(n = 91) P
Male, No. (%) 113 (44.8) 22 (24.2) 0.001
Age (yr) 51.2 ± 7.3 57.3 ± 7.8 < 0.001
Height (cm) 160.8 ± 8.6 156.0 ± 8.0 < 0.001
Weight (kg) 64.0 ± 10.2 62.6 ± 10.4 0.26
Waist circumference (cm) 85.5 ± 10.0 86.9 ± 11.0 0.26 Hip circumference (cm) 96.3 ± 8.4 97.7 ± 6.2 0.15 Body mass index (kg/m2) 24.7 ± 3.1 25.7 ± 3.5 0.02 History of hypertension, No. (%) 38 (15.1) 22 (24.2) 0.050 History of diabetes mellitus, No. (%) 18 (7.1) 7 (7.7) 0.86 History of dyslipidemia, No. (%) 18 (7.1) 2 (2.2) 0.08 Systolic blood pressure (mmHg) 130.9 ± 15.6 134.7 ± 19.5 0.11 Diastolic blood pressure (mmHg) 81.6 ± 12.2 82.0 ± 11.5 0.80
Glucose (mg/dL) 97.8 ± 20.2 93.6 ± 13.1 0.02
Total cholesterol (mg/dL) 196.8 ± 35.1 200.8 ± 41.2 0.38 HDL-cholesterol (mg/dL) 45.2 ± 11.4 45.3 ± 10.2 0.96 LDL-cholesterol (mg/dL) 113.3 ± 30.0 120.9 ± 33.7 0.045 Triglyceride (mg/dL) 158.7 ± 133.1 133.4 ± 68.9 0.02 Creatinine (mg/dL) 0.95 ± 0.15 0.88 ± 0.12 < 0.001 NT-proBNP (pg/mL) 39.6 ± 48.7 58.4 ± 51.1 < 0.01 LVH, left ventricular hypertrophy; LDL, low-density lipoprotein; HDL, high-density lipo- protein; NT-proBNP, N-terminal pro-B-type natriuretic peptide. Data are the mean ± SD, or N (%).
Table 2. Echocardiographic parameter
Parameters Without LVH
(n = 252)
With LVH
(n = 91) P
LA volume (mL) 11.5 ± 15.6 11.7 ± 18.5 0.94
LA volume index (mL/m2) 6.8 ± 9.1 7.0 ± 11.1 0.86
IVSd (cm) 0.8 ± 0.1 0.9 ± 0.1 < 0.001
LVPWd (cm) 0.8 ± .01 0.9 ± 0.2 < 0.001
LVDd (cm) 4.9 ± 0.5 5.3 ± 0.5 < 0.001
Relative wall thickness 0.33 ± 0.06 0.36 ± 0.08 0.02 Ejection fraction (%) 65.7 ± 6.2 64.7 ± 6.5 0.19 LV mass/BSA (g/m2) 81.6 ± 14.4 117.8 ± 19.2 < 0.001
E (m/s) 0.67 ± 0.19 0.64 ± 0.19 0.13
A (m/s) 0.68 ± 0.17 0.74 ± 0.19 0.01
Deceleration time (ms) 212.2 ± 60.5 214.6 ± 52.6 0.74
E/A 1.01 ± 0.34 0.87 ± 0.32 0.001
E´ (cm/s) 0.05 ± 0.05 0.04 ± 0.02 0.06
A´ (cm/s) 0.07 ± 0.04 0.07 ± 0.04 0.63
E/E´ 7.7 ± 5.4 10.6 ± 5.6 < 0.001
LVH, left ventricular hypertrophy; LA, left atrium; IVSd, end-diastolic interventricular septal thickness; LVPWd, end-diastolic left ventricular posterior wall thickness; LVDd, end-diastolic left ventricular dimension; LV, left ventricle; BSA, body surface area; E, peak early diastolic transmitral flow velocity; A, peak late diastolic transmitral flow ve- locity; E/A, ratio of peak early to late diastolic transmitral flow velocity; E´, peak early diastolic mitral annular velocity; A´, peak late diastolic mitral annular velocity; E/E´, ra- tio of peak early diastolic transmitral flow velocity to peak early diastolic mitral annu- lar velocity. Data are the mean ± SD.
Table 3. Electrocardiographic characteristics
Parameters Without LVH
(n = 252)
With LVH
(n = 91) P
PR interval (ms) 160.6 ± 24.2 156.8 ± 27.6 0.06
QRS duration (ms) 90.1 ± 12.3 90.7 ± 14.7 0.70
QTc (ms) 425.4 ± 24.1 429.4 ± 21.5 0.16
SV1 (mm) 5.8 ± 4.5 5.7 ± 4.8 0.90
RV5 (mm) 11.2 ± 6.7 10.4 ± 8.4 0.40
RV6 (mm) 1.9 ± 2.5 1.8 ± 2.5 0.84
SV3 (mm) 2.7 ± 3.0 2.0 ± 2.6 0.054
SV1+RV5 (mm) 21.7 ± 6.2 23.4 ± 6.7 0.03
SV1+RV6 (mm) 19.9 ± 5.9 21.0 ± 5.6 0.11
Sokolow–Lyon voltage (mm) 22.1 ± 6.1 23.4 ± 6.7 0.09 Cornell voltage (mm) 12.6 ± 5.6 13.1 ± 5.5 0.48 Sokow–Lyon criteria LVH (%) 11 (4.4) 3 (3.3) 0.67 Cornell voltage criteria LVH (%) 10 (4.0) 6 (6.6) 0.41 LVH, left ventricular hypertrophy; QTc, corrected QT interval; SV1, S wave amplitude in V1 lead; RV5, R wave amplitude in V5 lead; RV6, R wave amplitude in V6 lead; SV3, S wave amplitude in V3 lead. Data are the mean ± SD, or N (%).
Table 4. Relationship between electrocardiographic criteria and NT-proBNP levels to left ventricular hypertrophy
Variables LVH
r (95% confidence interval)
Sokolow-Lyon voltage 0.18 (0.07-0.28)
Cornell voltage 0.16 (0.05-0.26)
Log NT-proBNP 0.17 (0.06-0.27)
P value, Sokolow-Lyon voltage vs. Cornell voltage 0.83 P value, Sokolow-Lyon voltage vs. log NT-proBNP 0.39 P value, Cornell voltage vs. log NT-proBNP 0.52
NT-proBNP, N-terminal pro-B-type natriuretic peptide. Correlations compared by the Z statistic.
Table 5. Diagnostic performance of electrocardiographic left ventricular hypertrophy criteria
Diagnostic values Sokolow-Lyon criteria Cornell voltage criteria
Sensitivity (%) 3.3 6.6
Specificity (%) 95.6 96.0
Positive predictive value (%) 21.4 37.5
Negative predictable value (%) 73.3 74.0
Accuracy (%) 71.1 72.3
was the Cornell voltage (r = 0.16, P = 0.003). The strengths of the relationships were not significantly different for ECG crite- ria with the LVMI (P = 0.83) (Table 4). The performance of the tested ECG criteria for the echocardiographic diagnosis of LVH was assessed in terms of sensitivity and specificity (Table 5).
Both ECG criteria showed low sensitivity and high specificity.
The Sokolow-Lyon criteria had 3.3% sensitivity, 95.6% specifici- ty, 21.4% positive predictive value, and 73.3% negative predict- able value. The criteria for the Cornell voltage had a sensitivity of 6.6%, a specificity of 99.2%, a positive predictive value of 37.5%, and a negative predictable value of 74.0%. The accuracy of the Sokolow-Lyon criteria was 71.1% and that of the Cornell voltage
criteria was 72.3%.
Characteristics of NT-proBNP and combined test performance
The mean level of NT-proBNP was 44.6 ± 49.9 pg/mL, which was significantly higher in subjects with LVH (58.4 ± 51.1 vs.
39.6 ± 48.7 pg/mL, P < 0.01) (Table 1). The NT-proBNP level was correlated with the LVMI (r = 0.17, P = 0.002). The strengths of relationships were similar for the BNP level and for ECG cri-
Fig. 1. Receiver operating characteristic (ROC) curves for the combination of N-terminal pro-B-type natriuretic peptide (NT-proBNP) level and electrocardiography (ECG) criteria compared with ECG criteria alone for the detection of left ventricular hypertrophy.
Sensitivity
1-Specificity
0 0.2 0.4 0.6 0.8 1.0 1.0
0.8
0.6
0.4
0.2
0
P = 0.003 AUC (95% CI) = 0.63 (0.58-0.69)
AUC (95% CI) = 0.55 (0.50-0.61) Sokolow-Lyon voltage
Sokolow-Lyon voltage+NT-proBNP Reference line
Sensitivity
1-Specificity
0 0.2 0.4 0.6 0.8 1.0 1.0
0.8
0.6
0.4
0.2
0
P = 0.007 AUC (95% CI) = 0.64 (0.59-0.69)
AUC (95% CI) = 0.53 (0.47-0.59) Cornellvoltage
Cornellvoltage+NT-proBNP Reference line
teria with the LVMI (Table 4). The area under the ROC to detect LVH was 0.55 (95% confidence interval [CI], 0.50-0.61) using the Sokolow-Lyon criteria and 0.53 (0.47-0.59) using the Cor- nell voltage criteria. After adding NT-proBNP levels to the mod- el, the corresponding areas under the ROC were 0.63 (0.58-0.69) and 0.64 (0.59-0.69), respectively. P-values for the comparison in areas under the ROC for models with and without NT-proB- NP levels were < 0.001 (Fig. 1).
DISCUSSION
The present study evaluated the diagnostic performance of NT- proBNP levels when added to ECG criteria for the detection of LVH in a Korean community-based population. This study dem- onstrated the low sensitivity and high specificity of ECG criteria.
Overall, the area under the curve (AUC) for both ECG criteria for the detection of LVH was ≤ 0.61, which severely limits the potential of using ECG as a screening tool for LVH. Addition of NT-proBNP levels to ECG criteria improved discriminating pow- er for the detection of LVH in our general population.
LVH has been shown to be an independent risk factor for ad- verse cardiovascular events (3, 27). As such, early identification of LVH patients is critical for risk stratification. Given its low cost, availability and prognostic significance, ECG is recommended to be the diagnostic screening method for evaluation of LVH (28). However, studies have shown the median sensitivity to range from 15% (range, 2%-41%) for the Cornell voltage criteria to 21% (4%-52%) for the Sokolow-Lyon index. The median spec- ificity has been reported to range from 89% (53%-100%) for the Sokolow-Lyon index to 96% (91%-100%) for the Cornell voltage criteria (29). However, data evaluating the accuracy of ECG cri- teria for the detection of LVH in Korea are limited. In a small study conducted in Korea, the sensitivity and specificity of the Sokolow-Lyon index were found to be 11.3% and 95.5% and those of the Cornell voltage criteria to be 1.4% and 100%, re- spectively (30). The present study is the first to evaluate the ac- curacy of ECG criteria in a Korean general population. We de- monstrated the low sensitivity and high specificity of ECG crite- ria. Irrespective of the index used, ECG was a poor screening tool for the diagnosis of LVH.
LVH is a compensatory response of the myocardium to main- tain normal cardiac function in response to pressure overload and other various stimuli (31). The growth and composition of the myocardium are altered by locally produced neurohormones such as noradrenaline, angiotensin II, aldosterone, endothelin and bradykinin which, in addition to their hemodynamic ef- fects, act directly as growth factors (32-34). Myocardial growth resulting from the increased size and protein content of myo- cytes is paralleled by progressive expansion of interstitial fibro- blast compartments and enhanced deposition of collagen. These adaptive responses allow the heart to withstand the increased
intracardiac pressures associated with overload, and increased interstitial collagen leads to reduced LV compliance, leading to diastolic dysfunction (31). Eventually, synthesis of ventricular natriuretic peptide is re-induced, and the activated natriuretic peptide system may act as a counter-regulatory mechanism against further hypertrophy. In the present study, LVH was as- sociated with diastolic dysfunction and NT-proBNP levels were well correlated with the LVMI and E/E´. Several authors have reported on the use of BNP for the community screening of LVH, but consensus is lacking on the diagnostic performance of BNP levels. In the Framingham Heart Study, the AUC of BNP levels for the detection of elevated LV mass was 0.72 in males and 0.57 in females (11). In the Fourth Copenhagen City Heart Study, the diagnostic performance of NT-proBNP levels for the detec- tion of LVH was 0.70 (0.66-0.74) and 0.63 (0.59-0.68) for females and males, respectively (35). In the Dallas Heart Study, investi- gators evaluated a multimarker strategy to improve the diag- nostic performance for LVH screening. They reported that bet- ter screening could be achieved by a combination of ECG as well as levels of troponin I and NT-proBNP (AUC, 0.798 [95%
CI, 0.754-0.842]), which collectively provide additional infor- mation compared with ECG alone (36). In the present study, addition of NT-proBNP level to ECG criteria improved the diag- nostic performance expressed as AUC values from ROC curves compared with ECG criteria only, but the value of AUC was < 0.7.
Thus, addition NT-proBNP levels to ECG criteria seem to be suboptimal for diagnostic LVH screening.
Our community-based cohort reduced the possibility of spec- trum bias, whereas evaluation of all subjects with both echocar- diography and NT-proBNP levels eliminated verification bias.
Nevertheless, the present study had important limitations. The sample size was relatively small compared with other cohort studies. It could be argued that echocardiography is an imper- fect “gold standard” for the diagnosis of LVH. The cutoff value of LVH was defined by recommendations from the American Society of Echocardiography, but this cutoff value may be dif- ferent in a Korean general population. Most echocardiographic data are derived from western countries but, because racial dif- ferences can influence the size and function of cardiac cham- bers, evaluation of the echocardiographic parameters in racial populations (37-39). There are limited data for the reference val- ues of cardiac geometry in Asian populations. In the Japanese Normal Values for Echocardiographic Measurements Project (JAMP) study, the reference values for the LVMI were 76 ± 16 g/m2 in males and 70 ± 14 g/m2 in females (40). According to those results, the LVMI was small in Asian populations com- pared with Western populations. Also, the present study was a cross-sectional cohort study, and the prognostic significances of LVH and NT-proBNP levels were not evaluated.
In conclusion, our community-based study demonstrated that the sensitivity of ECG criteria was low and the power to rule
in LVH was unsatisfactory, and that ECG cannot be considered a screening test for the diagnosis of LVH. Addition of NT-proB- NP levels to ECG criteria for the detection of LVH improved the discriminating power but was suboptimal, suggesting limited usefulness as a mass screening tool. Further large-scale research is needed to identify the cutoff value for the diagnosis of LVH in Korean populations, and to develop alternative diagnostic meth- ods for the assessment of LVH in community screening.
DISCLOSURE
The authors have no conflicts of interest to disclose.
AUTHOR CONTRIBUTION
Conception and coordination of the study: Yoo BS, Ahn MS.
Design of ethical issues: Park JK, Ahn SV, Kim JY. Acquisition of data: Park JK, Ahn SV. Data review: Ahn MS, Kim JY, Yoo BS.
Statistical analysis: Choi EH, Ahn MS. Manuscript preparation:
Ahn MS, Yoo BS, Lee JH, Lee JW, Youn YJ, Ahn SG, Kim JY, Lee SH, Yoon JH. Manuscript approval: all authors.
ORCID
Min-Soo Ahn http://orcid.org/0000-0001-5730-8215 Byung-Su Yoo http://orcid.org/0000-0002-3395-4279 Ji Hyun Lee http://orcid.org/0000-0002-7162-1248 Jun-Won Lee http://orcid.org/0000-0001-6206-1704 Young Jin Youn http://orcid.org/0000-0001-7066-7474 Sung Gyun Ahn http://orcid.org/0000-0002-1528-2739 Jang-Young Kim http://orcid.org/0000-0002-0813-7082 Seung-Hwan Lee http://orcid.org/0000-0002-1186-0917 Junghan Yoon http://orcid.org/0000-0002-3363-2675 Jong-ku Park http://orcid.org/0000-0002-6773-1815 Song Vogue Ahn http://orcid.org/0000-0002-2771-6792 Eunhee Choi http://orcid.org/0000-0002-3449-0672
REFERENCES
1. Kannel WB, Gordon T, Offutt D. Left ventricular hypertrophy by electro- cardiogram. Prevalence, incidence, and mortality in the Framingham study. Ann Intern Med 1969; 71: 89-105.
2. Kannel WB, Gordon T, Castelli WP, Margolis JR. Electrocardiographic left ventricular hypertrophy and risk of coronary heart disease. The Fram- ingham study. Ann Intern Med 1970; 72: 813-22.
3. Verdecchia P, Schillaci G, Borgioni C, Ciucci A, Gattobigio R, Zampi I, Porcellati C. Prognostic value of a new electrocardiographic method for diagnosis of left ventricular hypertrophy in essential hypertension. J Am Coll Cardiol 1998; 31: 383-90.
4. Sundström J, Lind L, Arnlöv J, Zethelius B, Andrén B, HO. L. Echocar- diographic and electrocardiographic diagnoses of left ventricular hyper-
trophy predict mortality independently of each other in a population of elderly men. Circulation 2001; 103: 2346-51.
5. Sever PS, Dahlöf B, Poulter NR, Wedel H, Beevers G, Caulfield M, Col- lins R, Kjeldsen SE, Kristinsson A, McInnes GT, et al.; ASCOT investiga- tors. Prevention of coronary and stroke events with atorvastatin in hy- pertensive patients who have average or lower-than-average cholesterol concentrations, in the Anglo-Scandinavian Cardiac Outcomes Trial--Lip- id Lowering Arm (ASCOT-LLA): a multicentre randomised controlled trial. Lancet 2003; 361: 1149-58.
6. Woythaler JN, Singer SL, Kwan OL, Meltzer RS, Reubner B, Bommer W, DeMaria A. Accuracy of echocardiography versus electrocardiography in detecting left ventricular hypertrophy: comparison with postmortem mass measurements. J Am Coll Cardiol 1983; 2: 305-11.
7. Soeki T, Kishimoto I, Okumura H, Tokudome T, Horio T, Mori K, Kan- gawa K. C-type natriuretic peptide, a novel antifibrotic and antihyper- trophic agent, prevents cardiac remodeling after myocardial infarction. J Am Coll Cardiol 2005; 45: 608-16.
8. Choi SY, Lee JE, Jang EH, Kim MO, Baek H, Ki CS, Park SW, Kim DJ, Huh WS, Oh HY, et al. Association between changes in N-terminal pro-brain natriuretic peptide levels and changes in left ventricular mass index in stable hemodialysis patients. Nephron Clin Pract 2008; 110: c93-100.
9. Wang AY, Lam CW, Wang M, Chan IH, Lui SF, Zhang Y, Sanderson JE.
Diagnostic potential of serum biomarkers for left ventricular abnormali- ties in chronic peritoneal dialysis patients. Nephrol Dial Transplant 2009;
24: 1962-9.
10. Luchner A, Burnett JC Jr, Jougasaki M, Hense HW, Heid IM, Muders F, Riegger GA, Schunkert H. Evaluation of brain natriuretic peptide as mark- er of left ventricular dysfunction and hypertrophy in the population. J Hypertens 2000; 18: 1121-8.
11. Vasan RS, Benjamin EJ, Larson MG, Leip EP, Wang TJ, Wilson PW, Levy D. Plasma natriuretic peptides for community screening for left ventricu- lar hypertrophy and systolic dysfunction: the Framingham heart study.
JAMA 2002; 288: 1252-9.
12. Ahn MS, Kim JY, Youn YJ, Kim SY, Koh SB, Lee K, Yoo BS, Lee SH, Yoon J, Park JK, et al. Cardiovascular parameters correlated with metabolic syn- drome in a rural community cohort of Korea: the ARIRANG study. J Ko- rean Med Sci 2010; 25: 1045-52.
13. Koh SB, Park JK, Yoon JH, Chang SJ, Oh SS, Kim JY, Ryu SY, Kim KS, Lee TY, You JS. Preliminary report: a serious link between adiponectin levels and metabolic syndrome in a Korean nondiabetic population. Metabo- lism 2010; 59: 333-7.
14. Koh SB, Yoon J, Kim JY, Yoo BS, Lee SH, Park JK, Choe KH. Relationships between serum adiponectin with metabolic syndrome and components of metabolic syndrome in non-diabetic Koreans: ARIRANG study. Yon- sei Med J 2011; 52: 234-41.
15. Lee JH, Kim JY, Kim KM, Lee JW, Youn YJ, Ahn MS, Yoo BS, Lee SH, Yoon J, Choe KH, et al. A prospective study of epicardial adipose tissue and in- cident metabolic syndrome: the ARIRANG study. J Korean Med Sci 2013;
28: 1762-7.
16. Kim JY, Ahn SV, Yoon JH, Koh SB, Yoon J, Yoo BS, Lee SH, Park JK, Choe KH, Guallar E. Prospective study of serum adiponectin and incident met- abolic syndrome: the ARIRANG study. Diabetes Care 2013; 36: 1547-53.
17. Lang RM, Bierig M, Devereux RB, Flachskampf FA, Foster E, Pellikka PA, Picard MH, Roman MJ, Seward J, Shanewise JS, et al.; Chamber Quan- tification Writing Group; American Society of Echocardiography’s Guide-
lines and Standards Committee; European Association of Echocardiog- raphy. Recommendations for chamber quantification: a report from the American Society of Echocardiography’s Guidelines and Standards Com- mittee and the Chamber Quantification Writing Group, developed in conjunction with the European Association of Echocardiography, a branch of the European Society of Cardiology. J Am Soc Echocardiogr 2005; 18:
1440-63.
18. Schiller NB, Shah PM, Crawford M, DeMaria A, Devereux R, Feigen- baum H, Gutgesell H, Reichek N, Sahn D, Schnittger I, et al. Recommen- dations for quantitation of the left ventricle by two-dimensional echo- cardiography. American Society of Echocardiography Committee on Standards, Subcommittee on Quantitation of Two-Dimensional Echo- cardiograms. J Am Soc Echocardiogr 1989; 2: 358-67.
19. Devereux RB, Alonso DR, Lutas EM, Gottlieb GJ, Campo E, Sachs I, Rei- chek N. Echocardiographic assessment of left ventricular hypertrophy:
comparison to necropsy findings. Am J Cardiol 1986; 57: 450-8.
20. Quiñones MA, Otto CM, Stoddard M, Waggoner A, Zoghbi WA; Dop- pler Quantification Task Force of the Nomenclature and Standards Com- mittee of the American Society of Echocardiography. Recommenda- tions for quantification of Doppler echocardiography: a report from the Doppler Quantification Task Force of the Nomenclature and Standards Committee of the American Society of Echocardiography. J Am Soc Echo- cardiogr 2002; 15: 167-84.
21. Dumesnil JG, Paulin C, Pibarot P, Coulombe D, Arsenault M. Mitral an- nulus velocities by Doppler tissue imaging: practical implications with regard to preload alterations, sample position, and normal values. J Am Soc Echocardiogr 2002; 15: 1226-31.
22. Sohn DW, Chai IH, Lee DJ, Kim HC, Kim HS, Oh BH, Lee MM, Park YB, Choi YS, Seo JD, et al. Assessment of mitral annulus velocity by Doppler tissue imaging in the evaluation of left ventricular diastolic function. J Am Coll Cardiol 1997; 30: 474-80.
23. Sokolow M, Lyon TP. The ventricular complex in left ventricular hyper- trophy as obtained by unipolar precordial and limb leads. Am Heart J 1949; 37: 161-86.
24. Casale PN, Devereux RB, Alonso DR, Campo E, Kligfield P. Improved sex-specific criteria of left ventricular hypertrophy for clinical and com- puter interpretation of electrocardiograms: validation with autopsy find- ings. Circulation 1987; 75: 565-72.
25. Fradley MG, Larson MG, Cheng S, McCabe E, Coglianese E, Shah RV, Levy D, Vasan RS, Wang TJ. Reference limits for N-terminal-pro-B-type natriuretic peptide in healthy individuals (from the Framingham Heart Study). Am J Cardiol 2011; 108: 1341-5.
26. Karl J, Borgya A, Gallusser A, Huber E, Krueger K, Rollinger W, Schenk J.
Development of a novel, N-terminal-proBNP (NT-proBNP) assay with a low detection limit. Scand J Clin Lab Invest Suppl 1999; 230: 177-81.
27. Jissho S, Shimada K, Taguchi H, Yoshida K, Fukuda S, Tanaka H, Yoshi- kawa J, Yoshiyama M, Ishii M, Goto Y. Impact of electrocardiographic left ventricular hypertrophy on the occurrence of cardiovascular events in elderly hypertensive patients. - The Japanese trial to assess optimal
systolic blood pressure in elderly hypertensive patients (JATOS). Circ J 2010; 74: 938-45.
28. Chobanian AV, Bakris GL, Black HR, Cushman WC, Green LA, Izzo JL Jr, Jones DW, Materson BJ, Oparil S, Wright JT Jr, et al.; National Heart, Lung, and Blood Institute Joint National Committee on Prevention, De- tection, Evaluation, and Treatment of High Blood Pressure; National High Blood Pressure Education Program Coordinating Committee. The Seventh Report of the Joint National Committee on Prevention, Detec- tion, Evaluation, and Treatment of High Blood Pressure: the JNC 7 re- port. JAMA 2003; 289: 2560-72.
29. Pewsner D, Jüni P, Egger M, Battaglia M, Sundström J, Bachmann LM.
Accuracy of electrocardiography in diagnosis of left ventricular hypertro- phy in arterial hypertension: systematic review. BMJ 2007; 335: 711.
30. Park JK, Shin JH, Kim SH, Lim YH, Kim KS, Kim SG, Kim JH, Lim HG, Shin J. A comparison of cornell and sokolow-lyon electrocardiographic criteria for left ventricular hypertrophy in korean patients. Korean Circ J 2012; 42: 606-13.
31. Frey N, Olson EN. Cardiac hypertrophy: the good, the bad, and the ugly.
Annu Rev Physiol 2003; 65: 45-79.
32. Paradis P, Dali-Youcef N, Paradis FW, Thibault G, Nemer M. Overex- pression of angiotensin II type I receptor in cardiomyocytes induces car- diac hypertrophy and remodeling. Proc Natl Acad Sci U S A 2000; 97:
931-6.
33. Kaye D, Esler M. Sympathetic neuronal regulation of the heart in aging and heart failure. Cardiovasc Res 2005; 66: 256-64.
34. Rizvi MA, Katwa L, Spadone DP, Myers PR. The effects of endothelin-1 on collagen type I and type III synthesis in cultured porcine coronary ar- tery vascular smooth muscle cells. J Mol Cell Cardiol 1996; 28: 243-52.
35. Goetze JP, Mogelvang R, Maage L, Scharling H, Schnohr P, Sogaard P, Rehfeld JF, Jensen JS. Plasma pro-B-type natriuretic peptide in the gen- eral population: screening for left ventricular hypertrophy and systolic dysfunction. Eur Heart J 2006; 27: 3004-10.
36. Martinez-Rumayor AA, de Lemos JA, Rohatgi AK, Ayers CR, Powell- Wiley TM, Lakoski SG, Berry JD, Khera A, Das SR. Addition of highly sensitive troponin T and N-terminal pro-B-type natriuretic peptide to electrocardiography for detection of left ventricular hypertrophy: results from the Dallas Heart Study. Hypertension 2013; 61: 105-11.
37. Wong CY, O’Moore-Sullivan T, Leano R, Byrne N, Beller E, Marwick TH.
Alterations of left ventricular myocardial characteristics associated with obesity. Circulation 2004; 110: 3081-7.
38. Hinderliter AL, Light KC, Willis PW 4th. Racial differences in left ventric- ular structure in healthy young adults. Am J Cardiol 1992; 69: 1196-9.
39. Harshfield GA, Koelsch DW, Pulliam DA, Alpert BS, Richey PA, Becker JA. Racial differences in the age-related increase in left ventricular mass in youths. Hypertension 1994; 24: 747-51.
40. Daimon M, Watanabe H, Abe Y, Hirata K, Hozumi T, Ishii K, Ito H, Iwaku- ra K, Izumi C, Matsuzaki M, et al. Normal values of echocardiographic parameters in relation to age in a healthy Japanese population: the JAMP study. Circ J 2008; 72: 1859-66.