J Korean Soc Radiol 2017;76(4):237-244 https://doi.org/10.3348/jksr.2017.76.4.237
INTRODUCTION
Hepatic steatosis disease affects 10–30% of the general popu- lation across all ethnicities and age groups (1-5). This condition is associated with insulin resistance, type 2 diabetes mellitus, and hyperlipidemia (1, 6). Until the last few decades, hepatic ste- atosis was considered to be a relatively benign and common con- dition (7). However, hepatic steatosis has the potential to prog- ress to fibrosis, cirrhosis, and hepatocellular carcinoma. The diagnosis may be missed in some individuals because many pa-
tients with hepatic steatosis are asymptomatic (8). The initial de- tection and precise quantification of hepatic steatosis disease is crucial for the successful management of these patients (1, 9).
The current gold standard methods for the detection and quantification of hepatic steatosis are liver biopsy and magnetic resonance spectroscopy (MRS) (10, 11). Liver biopsy has sever- al disadvantages, such as the invasiveness of the procedure, risk of infection, and potential for hemorrhage (7); therefore liver bi- opsy alone is not recommended for identifying hepatic steatosis disease. MRS measures the chemical composition of a tissue di-
Effect of Gadoxetic Acid on Quantification of Hepatic Steatosis Using Magnetic Resonance Spectroscopy: A Prospective Study
Gadoxetic Acid가 자기공명분광술을 이용한 지방간의 정량화에 미치는 영향: 전향적 분석Ju Won Kim, MD
1, Sung Mo Kim, MD
1, Sook Hee Heo, MD
1, Jin Woong Kim, MD
1,
Sang Soo Shin, MD
2, Yong Yeon Jeong, MD
1*, Gwang Woo Jeong, PhD
2, Heoung Keun Kang, MD
11Department of Radiology, Chonnam National University Hwasun Hospital, Hwasun, Korea
2Department of Radiology, Chonnam National University Hospital, Gwangju, Korea
Purpose: We prospectively evaluated whether gadoxetic acid (Gd-EOB-DTPA) admin- istration for liver magnetic resonance (MR) imaging affects the quantification of he- patic steatosis using MR spectroscopy (MRS).
Materials and Methods: A total of 155 patients were included, who underwent ga- doxetic acid-enhanced liver MR imaging and MRS during a 5-month period. Fast breath-hold high-speed T2-corrected multi-echo MRS was used before, and 20 min after, gadoxetic acid injection. The same location was maintained in the pre-contrast and post-contrast MRS. Changes in the fat fraction (FF) were compared between the pre- and post-contrast MRS using a paired t-test. The change in FF between cirrhotic and non-cirrhotic patients was compared using an independent t-test. In cirrhotic patients, the correlation between FF change and biochemical marker using Pearson’s correlation test, was evaluated.
Results: The mean FF in the post-contrast MRS (5.05 ± 5.26%) was significantly high- er than in the pre-contrast MRS (4.77 ± 0.57%) (p < 0.000). The FF change between pre-contrast and post-contrast MRS was significantly higher in non-cirrhotic patients (0.41 ± 0.77%) than in cirrhotic patients (0.14 ± 0.59) (p = 0.010). Albumin and alkaline phosphatase shows weak correlation with FF change (both p < 0.02).
Conclusion: Gadoxetic acid affects the quantification of hepatic steatosis by MRS.
Hence, MRS should be performed before gadoxetic acid injection, particularly in non- cirrhotic patients.
Index terms
Magnetic Resonance Spectroscopy Fatty Liver
Gadoxetic Acid Liver Cirrhosis
Received May 5, 2016 Revised July 12, 2016 Accepted July 30, 2016
*Corresponding author: Yong Yeon Jeong, MD Department of Radiology, Chonnam National University Hwasun Hospital, 322 Seoyang-ro, Hwasun-eup, Hwasun 58128, Korea.
Tel. 82-61-379-7102 Fax. 82-61-379-7133 E-mail: yjeong@jnu.ac.kr
This is an Open Access article distributed under the terms of the Creative Commons Attribution Non-Commercial License (http://creativecommons.org/licenses/by-nc/4.0) which permits unrestricted non-commercial use, distri- bution, and reproduction in any medium, provided the original work is properly cited.
rectly and non-invasively (12, 13). Recently, MRS showed a strong and significant correlation with lipid content, and is re- garded as the most accurate practical method for measuring liver fat in clinical practice (14).
Gadoxetic acid (Gd-EOB-DTPA), which offers an innovative option for imaging the liver, is used for improved medical diag- nosis with MR imaging. Gadoxetic acid is believed to be actively taken up in hepatocytes by a canalicular multispecific organic anion transporter 8 (15). Approximately 50% of the injected dose of gadoxetic acid is taken up by hepatocytes and subsequently excreted into the biliary canaliculi (16). Peak enhancement of ga- doxetic acid is obtained 20 minutes after injection (17), and hep- atobiliary phase imaging is performed at this time (15).
A previous study reported that gadoxetic acid does not show a significant effect on measuring fat fractions (FF) between pre- contrast MRS and post-contrast MRS (18). The study had a rela- tively small sample size and was limited by the retrospective de- sign. Since gadoxetic acid does not affect proton MRS, it could be performed during the interval of the dynamic phase to save time.
Therefore, the purpose of this study was to prospectively evaluate whether gadoxetic acid administration for liver MR imaging af- fects the hepatic steatosis quantification using MRS.
MATERIALS AND METHODS
Patients
This prospective study was approved by the institutional re- view board of Chonnam National University Hwasun Hospital.
Written informed consent was obtained from all patients. In January 2015, a pilot study including 41 patients was conducted to determine feasibility. The mean FF change was 0.27 ± 0.57%.
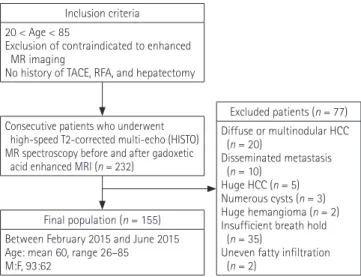
We assumed that a p < 0.01 was acceptable with a study power of 95%. The estimated sample size was 83 patients, using a one- sample design. Between February 2015 and June 2015, individ- uals who were clinically suspected of having focal hepatic lesions were evaluated (Fig. 1). Criteria for inclusion were: 1) age–be- tween 20 to 85 years; 2) exclusion of contraindications to en- hanced MR imaging (claustrophobia, metal implants, or pace- makers); and 3) absence of any history of transarterial chemo- embolization, radiofrequency ablation, and hepatectomy. After analyzing the abdominal MR images, the following patients were excluded: patients who had diffuse or disseminated hepatic le-
sions [infiltrative or multinodular hepatocellular carcinoma (HCC), n = 20; disseminated metastasis, n = 10; numerous cysts n = 3, uneven fatty infiltration, n = 2] or large lesions replacing liver parenchyma (HCC, n = 5; hemangioma, n = 2), and pa- tients (n = 35) who were not able to hold their breath sufficient- ly or for whom it was difficult to select a voxel for the analysis.
Finally, 155 patients (93 men and 62 women) were included (mean age, 61 yrs; range, 26–85 yrs). The patients had the fol- lowing underlying liver diseases: hepatitis B (n = 40), hepatitis C (n = 10), alcohol-induced liver cirrhosis (n = 22) and crypto- genic liver cirrhosis (n = 5). The patients were divided into two groups: non-cirrhotic (n = 78) and cirrhotic (n = 77). Liver cir- rhosis was diagnosed by a combination of physical findings, biochemical tests, and radiological imaging features. In the cir- rhosis group, the severity of cirrhosis was classified according to the Child-Pugh classification. Of the 77 cirrhosis patients, 70 were class A, 6 were class B, and 1 was class C. The other 78 pa- tients were grouped as non-cirrhotic. This group showed no evi- dence of liver cirrhosis in physical findings, biochemical tests, and radiological imaging features. Hepatic metastasis was de- tected in 4 patients of the non-cirrhotic group. They were not excluded due to small size and peripheral location of metastasis.
MR imaging and MRS
MR imaging and MRS were performed concomitantly using a 3.0-T unit (MAGNETOM Skyra; Siemens, Erlangen, Germa- ny). Three plain localizers were used to plan the MRS, and the
Final population (n = 155) Between February 2015 and June 2015 Age: mean 60, range 26–85
M:F, 93:62
Excluded patients (n = 77) Diffuse or multinodular HCC (n = 20)
Disseminated metastasis (n = 10)
Huge HCC (n = 5) Numerous cysts (n = 3) Huge hemangioma (n = 2) Insufficient breath hold (n = 35)
Uneven fatty infiltration (n = 2)
Consecutive patients who underwent high-speed T2-corrected multi-echo (HISTO) MR spectroscopy before and after gadoxetic acid enhanced MRI (n = 232)
Inclusion criteria 20 < Age < 85
Exclusion of contraindicated to enhanced MR imaging
No history of TACE, RFA, and hepatectomy
Fig. 1. Flow chart of patient enrollment. HCC = hepatocellular carci- noma, MR = magnetic resonance, RFA = radiofrequency ablation, TACE = transarterial chemoembolization
spectra were obtained using an 18-channel body matrix coil and table-mounted 32-channel spine matrix coil.
An experienced radiologist selected a single voxel of 27 cm3 (30 × 30 × 30 mm) within the normal liver tissue in segment VIII, VII, or VI, avoiding major vessels, bile ducts, focal hepatic lesions, and the edge of the liver (Fig. 2). MRS was performed twice, using a high-speed T2-corrected multi-echo (HISTO) MR spectroscopic technique: one before and one after contrast intravenous injection. Pre-contrast MRS was performed just before the dynamic phase, and post-contrast MRS was per- formed 20 minutes after contrast injection. All spectra were ob- tained with a stimulated echo acquisition mode sequence, set- ting the following parameters: repetition time = 3000 ms, mixing
time = 10 ms, 5 echo times = 12, 24, 36, 48, 72). A total of 2048 points were acquired at a bandwidth of 3000 Hz. Data acquisi- tion was performed within a single breath hold.
The MR data were analyzed by off-line software from the MR vendor. At the echo time, the water (4.7 ppm) and fat (0.9, 1.3, 2.1, and 2.75 ppm) peaks were measured. Each measurable peak area was individually corrected for the T2 decay using non- linear least-square fits, to determine their relative proton densi- ties. The relative proton densities of the fat peaks located under- neath the water peaks were determined according to Hamilton et al. (19). The total proton density was defined as the sum of all T2-corrected individual fat peaks. The proton density FF was calculated as the ratio of the fat proton density to the sum of the fat and water proton densities (Fig. 2).
Biochemical Studies
Common biochemical parameters were considered for serum markers, such as creatinine, urea, albumin, prothrombin time, total bilirubin, aspartate aminotransferase (AST), alanine amino- transferase, alkaline phosphatase (APH), gammaglutamyl trans- peptidase, Child–Pugh class, and Model for End Stage Liver Dis- ease (MELD) score. The MELD score was calculated using the following formula: 11.2 × loge (INR) + 9.57 × loge (creatinine, mg/dL) + 3.78 × loge (bilirubin, mg/dL) + 6.43, where INR is the international normalized ratio, the lower bound for all three vari- ables is 1, and the upper bound for creatinine is 4 mg/dL (20). In all patients, the serum markers were measured in the same labo- ratory and on the same day that the MR imaging was performed.
Statistical Analysis
The changes in the calculated FF between the pre-contrast MRS and the post-contrast MRS were compared using the paired t-test. The FF change between the cirrhotic group and the non- Table 1. The Mean FFs and the Changes in the FF between Pre-Contrast MRS and Post-Contrast MRS
Group Mean FF (Mean ± SD, %) Change of FF
(Mean ± SD, %) p-Value
Pre-Contrast MRS Post-Contrast MRS
Non-cirrhosis (n = 78) 5.47 ± 5.66 5.88 ± 5.94 0.41 ± 0.68 < 0.000
Cirrhosis (n = 77) 4.05 ± 4.31 4.20 ± 4.33 0.15 ± 0.59 0.032
Child A (n = 70) 4.08 ± 4.37 4.25 ± 4.36 0.17 ± 0.59 0.020
Child B (n = 6) 3.70 ± 4.23 3.57 ± 4.72 -0.13 ± 0.62 0.620
Child C (n = 1) 4.0 4.30 0.30
Total (n = 155) 4.77 ± 5.07 5.05 ± 5.26 0.28 ± 0.65 < 0.000
FF = fat fraction, MRS = magnetic resonance spectroscopy, SD = standard deviation Fig. 2. Hepatic steatosis spectrum of a 77-years-old female with sus- picious focal hepatic lesion. Proton of fat appears as several peaks, in- cluding a diacyl peak at 2.75 ppm (1), an α-olefinic and α-carboxyl peak at 2.1 ppm (2), a methylene peak at 1.3 ppm (3), and a methyl peak at 0.9 ppm (4). Whereas, proton in water appears as a single peak at 4.7 ppm. Fat fraction can be calculated as (Sum of fat peaks) / (Sum of fat peaks + water peak).
Water
Fat
1 2 4
3
PPM
6 5 4 3 2 1 0
cirrhotic group were compared using an independent t-test. In the cirrhotic group, the FF changes between the Child-Pugh clas- sifications were compared using the Mann Whitney U test. The correlation between the change in the FF and the blood markers were assessed using Pearson’s correlation test. A p value < 0.05 was considered significant. The SPSS version 21 software package
(SPSS, Chicago, IL, USA) and MedCalc version 15.8 (MedCalc Software Inc., Mariakerke, Belgium) were used for analysis.
RESULTS
The mean FFs of the entire study population in pre-contrast and post-contrast MRS are shown in Table 1. In the 155 patients, the mean FF was 4.77 ± 5.07% (range, 0.4–25.5%) and 5.05 ± 5.26% (range, 0.5–26.8%) on pre-contrast and post-contrast MRS, respectively. The FF values in the post-contrast MRS were significantly higher than that in the pre-contrast MRS (p <
0.000). The FF values in the post-contrast MRS were significant- ly higher than those in the pre-contrast MRS in the non-cirrhot- ic group (p < 0.000) as well as in the cirrhotic group (p = 0.032).
The FF change in the non-cirrhotic group between the pre- and post-contrast MRS was significantly higher than that in the cirrhotic group (p = 0.010). The relationship between the FF change and cirrhosis is shown in Fig. 3 (non-cirrhosis, 0.41 ± 0.77; cirrhosis, 0.14 ± 0.59). The relationship between the FF change and the Child-Pugh classification in cirrhotic group is shown in Fig. 4 (Child-Pugh A, 0.17 ± 0.58; B and C, -0.71 ± 0.59). No significant change in FF was observed between Child- Pugh classification A vs. B and C (p = 0.856). Correlation be- tween the FF change and the biochemical markers are shown in Table 2. In the liver cirrhosis group, APH and albumin show weak correlation with the FF change (Fig. 5).
DISCUSSION
The mean FF was 4.77 ± 5.07% and 5.05 ± 5.26% on pre-con- trast and post-contrast MRS, respectively. There was a signifi- cant change in the FF between the pre- and post-contrast MRS (p < 0.000). This suggests that gadoxetic acid influences the he- patic steatosis quantification using MRS. In post-contrast MRS, mean FF was more exaggerated than pre-contrast MRS by 0.28
± 0.65%. Since MRS performed after gadoxetic acid enhanced the MR sequence, overestimation of FF and resultant false-pos- itive diagnosis can be obtained. In the clinical field this can be negligible, thus making it insignificant whether hepatic quanti- fication using MRS is performed before or after gadoxetic acid administration. However, for precise examination, hepatic ste- atosis quantification using MRS should be performed before
2.0
1.0
0.0
-1.0 FF change between pre- and post-contrast MRS
A (n = 70)
Child-pugh classificationB (n = 6), C (n = 1) Fig. 4. Relationship between the changes in FF and the Child-Pugh class in the cirrhotic group (n = 77). No significant difference of FF change is observed between Child-Pugh classification A vs. B and C (Child-Pugh A, 0.17 ± 0.58; B and C, -0.71 ± 0.59) (p = 0.856). FF = fat fraction, MRS = magnetic resonance spectroscopy
2.0
1.0
0.0
-1.0 FF change between pre- and post-contrast MRS
Non-cirrhosis (n = 78) Cirrhosis (n = 77) Fig. 3. Relationship between the FF change and liver cirrhosis in the entire patient cohort. The mean value is significantly higher for pa- tients in the non-cirrhotic group (*p < 0.000). The lower edge of each box indicates the 25th percentile, and the upper edge indicates the 75th percentile. The horizontal line in the middle of the box indicates the median. Lines extending from either end of the box indicate the extent of the data beyond the 25th and 75th percentile but within 1.5-times the interquartile range. Outliers were not noted. FF = fat fraction, MRS = magnetic resonance spectroscopy
*
gadoxetic acid injection, or after a sufficient interval to allow for the excretion of gadoxetic acid.
A previous study, which used the same MR scanner with a similar protocol, showed that the mean FF was 6.50 ± 0.51% on pre-contrast MRS, and 6.70 ± 6.61% on post-contrast MRS.
However, a significant difference was not observed in the mean
FF between the pre- and post-contrast MRS (18). The mean FF changes between the pre- and post-contrast MRS showed a slight difference of 0.20% in a previous study and of 0.28% in our study. Compared to the previous study, our study differed in two points. First, the size of the cohort in our study was double than of the previous study. Second, our prospective study had stricter
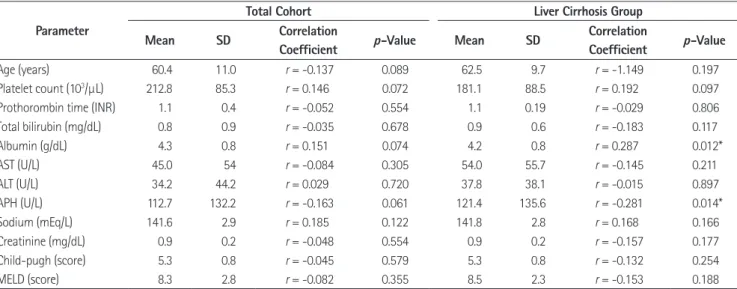
Table 2. Relationships between Clinical Factors and the Changes in the Fat Fraction between Pre-Contrast MRS and Post-Contrast MRS
Parameter
Total Cohort Liver Cirrhosis Group
Mean SD Correlation
Coefficient p-Value Mean SD Correlation
Coefficient p-Value
Age (years) 60.4 11.0 r = -0.137 0.089 62.5 9.7 r = -1.149 0.197
Platelet count (103/µL) 212.8 85.3 r = 0.146 0.072 181.1 88.5 r = 0.192 0.097
Prothorombin time (INR) 1.1 0.4 r = -0.052 0.554 1.1 0.19 r = -0.029 0.806
Total bilirubin (mg/dL) 0.8 0.9 r = -0.035 0.678 0.9 0.6 r = -0.183 0.117
Albumin (g/dL) 4.3 0.8 r = 0.151 0.074 4.2 0.8 r = 0.287 0.012*
AST (U/L) 45.0 54 r = -0.084 0.305 54.0 55.7 r = -0.145 0.211
ALT (U/L) 34.2 44.2 r = 0.029 0.720 37.8 38.1 r = -0.015 0.897
APH (U/L) 112.7 132.2 r = -0.163 0.061 121.4 135.6 r = -0.281 0.014*
Sodium (mEq/L) 141.6 2.9 r = 0.185 0.122 141.8 2.8 r = 0.168 0.166
Creatinine (mg/dL) 0.9 0.2 r = -0.048 0.554 0.9 0.2 r = -0.157 0.177
Child-pugh (score) 5.3 0.8 r = -0.045 0.579 5.3 0.8 r = -0.132 0.254
MELD (score) 8.3 2.8 r = -0.082 0.355 8.5 2.3 r = -0.153 0.188
*p-value < 0.05. ALT = alanine aminotransferase, APH = alkaline phosphatase, AST = aspartate aminotransferase, MELD = Model for End-Stage Liver Dis- ease, MRS = magnetic resonance spectroscopy, SD = standard deviation
2.0
1.0
0.0
-1.0
-2.0
2.0
1.0
0.0
-1.0
-2.0
FF change between pre- and post-contrast MRS FF change between pre- and post-contrast MRS
1.0 2.0 3.0 4.0 5.0 6.0 0 100 200 300 400 500 600
Albumin (g/dL) APH (U/L)
r = 0.287
p = 0.012 r = -0.281
p = 0.014
Fig. 5. Scatter plots of the correlation in the liver cirrhosis group.
A. The relationship between alkaline phosphatase and FF change.
B. The relationship between albumin and FF change.
APH = alkaline phosphatase, FF = fat fraction, MRS = magnetic resonance spectroscopy
A B
inclusion and exclusion criteria. Hence, our data would be more reliable due to the difference in the size of the sample and the characteristics of the cohort in our study.
As shown in Fig. 2, the MRS spectra of the liver reveals a single peak of proton in water appearing at 4.7 ppm, and multiple peaks of proton in triglyceride appear at 1.3 ppm (methylene), 0.9 ppm (methyl), 2.1 ppm (α-olefinic and α-carboxyl), and 2.75 ppm (di- acyl) (12, 19). In Fig. 6, predicted MRS spectra of gadoxetic acid shows several peaks at similar frequency at 1.3 and 2.75 ppm, by MestReNova LITE Ver. 5.2.5-5780 (Mestrelab Research S.L., San- tiago de Compostela, Spain) as the MRS processing software.
Thus, we can explain that calculated FF of liver could be overesti- mated by overlapped fat spectra of gadoxetic acid.
Impaired gadoxetic acid uptake and transport mechanisms in cirrhotic liver reduce the liver parenchymal enhancement (21).
Impaired uptake by hepatocytes in cirrhotic liver tissue may re- duce the change in FF detected between pre- and post-contrast MRS. In our study, the change in FF in the non-cirrhotic group between the pre- and post-contrast MRS was significantly high- er than that of the cirrhotic group. Although the severity of cir- rhosis can be assessed by measuring the relative enhancement of gadoxetic acid (22), our data showed that it cannot be assessed by the FF change between pre-contrast and post-contrast MRS.
We observed a non-significant difference of approximately
0.9% in the FF change between patients with mild liver cirrhosis (Child A) and those with moderate to severe liver cirrhosis (Child B and C). This result may be related to the very small pro- portion of patients with severe liver cirrhosis, in our inclusion cohort. Therefore, we expect that a future study which includes more patients with moderate to severe liver cirrhosis will demon- strate a correlation between the FF change and the severity of liv- er cirrhosis.
Several studies have investigated the clinical or histologic fac- tors that cause decreased hepatic enhancement on gadoxetic acid-enhanced MR imaging (22-26). Among various parame- ters, the indocyanine green retention rate, AST, platelet count, prothrombin activity, total bilirubin, albumin, sodium, MELD score, MELD-Na score, Child-Pugh score, and the presence of ascites are important factors correlated with liver enhancement (22-26). We expected that these parameters may be correlated with the change in the calculated FF. In total cohort, none of these biochemical markers showed a significant correlation with the FF change. However, APH shows a weak negative correla- tion, and albumin shows a weak positive correlation, with the FF change. These results support that impaired hepatocyte func- tion may reduce the FF change as well as reduce the liver paren- chymal enhancement.
Our study has several limitations. First, the proportion of pa- tients with severe liver cirrhosis was relatively small. Only 9% of cirrhosis patients are Child-Pugh classification B or C. We sus- pect that the insufficient number of patients with severe cirrho- sis prevented the detection of a significant change in FF among the Child Pugh classifications, and significant correlation of FF change with most of biochemical markers. Second, the location of the region of interest was slightly different between the pre- and post-contrast MRS. In spite of our effort to instruct the pa- tients to hold their breath to the same degree, minor differences were inevitable. To overcome this limitation, several patients with an insufficient ability to hold their breath were excluded.
Third, this study did not yield reproducible analysis . We per- formed MRS just two times in a patient, once before and once after administration of gadoxetic acid, because several recent studies demonstrated good reproducibility and feasibility of he- patic fat quantification using MRS (10, 18, 27).
In conclusion, gadoxetic acid influenced hepatic steatosis quantification using MRS. Our results suggest that there is a risk Fig. 6. Molecular structure and predicted MR spectra of gadoxetic
acid. Several peaks (*) are located in similar frequencies with triglycer- ide in hepatocyte (Fig. 2). We hypothesize that these peaks may pro- duce overestimation of fat fraction on post-contrast MRS. MRS = magnetic resonance spectroscopy
O
O
O O
OH OH
O Gd O O O O N
N N
PPM
6 5 4 3 2 1 0
*
*
*
*
of overestimation of hepatic steatosis and false-positive diagnosis when MRS is performed after gadoxetic acid injection. For pre- cise quantification of hepatic steatosis, MRS should be performed before intravenous gadoxetic acid injection or after a sufficient interval, to allow for the excretion of gadoxetic acid, particularly in non-cirrhotic patients.
REFERENCES
1. Angulo P. Nonalcoholic fatty liver disease. N Engl J Med 2002;346:1221-1231
2. Browning JD, Szczepaniak LS, Dobbins R, Nuremberg P, Hor- ton JD, Cohen JC, et al. Prevalence of hepatic steatosis in an urban population in the United States: impact of ethnicity.
Hepatology 2004;40:1387-1395
3. Farrell GC, Larter CZ. Nonalcoholic fatty liver disease: from steatosis to cirrhosis. Hepatology 2006;43(2 Suppl 1):S99- S112
4. Ong JP, Younossi ZM. Epidemiology and natural history of NAFLD and NASH. Clin Liver Dis 2007;11:1-16, vii
5. Szczepaniak LS, Nurenberg P, Leonard D, Browning JD, Re- ingold JS, Grundy S, et al. Magnetic resonance spectroscopy to measure hepatic triglyceride content: prevalence of he- patic steatosis in the general population. Am J Physiol En- docrinol Metab 2005;288:E462-E468
6. Marchesini G, Brizi M, Morselli-Labate AM, Bianchi G, Bu- gianesi E, McCullough AJ, et al. Association of nonalco- holic fatty liver disease with insulin resistance. Am J Med 1999;107:450-455
7. Mehta SR, Thomas EL, Bell JD, Johnston DG, Taylor-Robin- son SD. Non-invasive means of measuring hepatic fat content. World J Gastroenterol 2008;14:3476-3483 8. Syn WK, Nightingale P, Bateman JM. Nonalcoholic fatty
liver disease in a district general hospital: clinical presen- tation and risk factors. Hepatol Int 2008;2:190-195 9. Wieckowska A, Feldstein AE. Nonalcoholic fatty liver dis-
ease in the pediatric population: a review. Curr Opin Pedi- atr 2005;17:636-641
10. van Werven JR, Hoogduin JM, Nederveen AJ, van Vliet AA, Wajs E, Vandenberk P, et al. Reproducibility of 3.0 Tesla magnetic resonance spectroscopy for measuring hepatic fat content. J Magn Reson Imaging 2009;30:444-448
11. Roldan-Valadez E, Favila R, Martínez-López M, Uribe M, Ríos C, Méndez-Sánchez N. In vivo 3T spectroscopic quanti- fication of liver fat content in nonalcoholic fatty liver dis- ease: Correlation with biochemical method and morphom- etry. J Hepatol 2010;53:732-737
12. Lee SS, Park SH. Radiologic evaluation of nonalcoholic fat- ty liver disease. World J Gastroenterol 2014;20:7392-7402 13. Wu CH, Ho MC, Jeng YM, Hsu CY, Liang PC, Hu RH, et al.
Quantification of hepatic steatosis: a comparison of the accuracy among multiple magnetic resonance techniques.
J Gastroenterol Hepatol 2014;29:807-813
14. Bohte AE, van Werven JR, Bipat S, Stoker J. The diagnostic accuracy of US, CT, MRI and 1H-MRS for the evaluation of hepatic steatosis compared with liver biopsy: a meta-anal- ysis. Eur Radiol 2011;21:87-97
15. Frydrychowicz A, Lubner MG, Brown JJ, Merkle EM, Nagle SK, Rofsky NM, et al. Hepatobiliary MR imaging with gado- linium-based contrast agents. J Magn Reson Imaging 2012;
35:492-511
16. Jeong WK, Kim YK, Song KD, Choi D, Lim HK. The MR imag- ing diagnosis of liver diseases using gadoxetic acid: empha- sis on hepatobiliary phase. Clin Mol Hepatol 2013;19:360- 306
17. Hamm B, Staks T, Mühler A, Bollow M, Taupitz M, Frenzel T, et al. Phase I clinical evaluation of Gd-EOB-DTPA as a hepatobiliary MR contrast agent: safety, pharmacokinet- ics, and MR imaging. Radiology 1995;195:785-792 18. Park YS, Lee CH, Kim JH, Kim BH, Kim JH, Kim KA, et al. Ef-
fect of Gd-EOB-DTPA on hepatic fat quantification using high-speed T2-corrected multi-echo acquisition in (1)H MR spectroscopy. Magn Reson Imaging 2014;32:886-890 19. Hamilton G, Yokoo T, Bydder M, Cruite I, Schroeder ME,
Sirlin CB, et al. In vivo characterization of the liver fat ¹H MR spectrum. NMR Biomed 2011;24:784-790
20. Kamath PS, Wiesner RH, Malinchoc M, Kremers W, Therneau TM, Kosberg CL, et al. A model to predict survival in patients with end-stage liver disease. Hepatology 2001;33:464-470 21. van Montfoort JE, Stieger B, Meijer DK, Weinmann HJ, Mei-
er PJ, Fattinger KE. Hepatic uptake of the magnetic reso- nance imaging contrast agent gadoxetate by the organic anion transporting polypeptide Oatp1. J Pharmacol Exp Ther 1999;290:153-157
22. Feier D, Balassy C, Bastati N, Stift J, Badea R, Ba-Ssalamah A.
Liver fibrosis: histopathologic and biochemical influences on diagnostic efficacy of hepatobiliary contrast-enhanced MR imaging in staging. Radiology 2013;269:460-468 23. Tamada T, Ito K, Higaki A, Yoshida K, Kanki A, Sato T, et al.
Gd-EOB-DTPA-enhanced MR imaging: evaluation of he- patic enhancement effects in normal and cirrhotic livers.
Eur J Radiol 2011;80:e311-e316
24. Kanki A, Tamada T, Higaki A, Noda Y, Tanimoto D, Sato T, et al. Hepatic parenchymal enhancement at Gd-EOB-DTPA- enhanced MR imaging: correlation with morphological grading of severity in cirrhosis and chronic hepatitis. Magn Reson Imaging 2012;30:356-360
25. Kim HY, Choi JY, Park CH, Song MJ, Song DS, Kim CW, et al.
Clinical factors predictive of insufficient liver enhancement on the hepatocyte-phase of Gd-EOB-DTPA-enhanced mag- netic resonance imaging in patients with liver cirrhosis. J Gastroenterol 2013;48:1180-1187
26. Bastati N, Feier D, Wibmer A, Traussnigg S, Balassy C, Ta- mandl D, et al. Noninvasive differentiation of simple steato- sis and steatohepatitis by using gadoxetic acid-enhanced MR imaging in patients with nonalcoholic fatty liver disease:
a proof-of-concept study. Radiology 2014;271:739-747 27. van Werven JR, Marsman HA, Nederveen AJ, ten Kate FJ,
van Gulik TM, Stoker J. Hepatic lipid composition analysis using 3.0-T MR spectroscopy in a steatotic rat model. Magn Reson Imaging 2012;30:112-121
Gadoxetic Acid가 자기공명분광술을 이용한 지방간의 정량화에 미치는 영향: 전향적 분석
김주원
1· 김성모
1· 허숙희
1· 김진웅
1· 신상수
2· 정용연
1* · 정광우
2· 강형근
1목적: Gadoxetic acid의 사용이 자기공명분광술(magnetic resonance spectroscopy; 이하 MRS)을 이용한 지방간의 정량 화에 미치는 영향을 분석하고자 하였다.
대상과 방법: 전향적인 연구를 시행하였으며 155명의 환자가 등록되었다. Fast breath-hold high-speed T2-corrected multi-echo기법의 MRS를 이용하여, gadoxetic acid 주입 전과 주입 후 20분에 한번씩, 동일한 위치에서 지방분율을 측정 하였다. Gadoxetic acid 주입 전과 후에 지방분율의 변화가 있는지 비교하였고, 간경화 유무와 Child-Pugh classification 에 따라서 지방분율 변화에 차이가 있는지 비교하였다.
결과: Gadoxetic acid 주입 후 MRS에서 측정된 평균 지방분율(5.05 ± 5.26%)은 gadoxetic acid 주입 전 MRS에서 측정 된 평균 지방분율(4.77 ± 5.07%)과 비교하여 유의하게 높았다(p < 0.000). Gadoxetic acid 주입 전과 후의 지방분율 의 차이는 정상환자군(0.41 ± 0.77%)이 간경화환자군(0.14 ± 0.59)에 비하여 유의하게 높았다(p = 0.010). Albumin 과 alkaline phosphatase가 지방분율의 변화와 유의한 상관관계를 보였다.
결론: Gadoxetic acid는 MRS를 이용한 지방간의 정량화에 영향을 미치며, 특히 간경화가 없는 환자에서 그 영향이 더 크 다. 그러므로, MRS를 이용한 지방간의 정량화는 gadoxetic acid 주입 전에 시행되어야 한다.
1화순전남대학교병원 영상의학과, 2전남대학교병원 영상의학과