Twelve Weeks of Aerobic Exercise at the Lactate Threshold Improves Autonomic Nervous System
Function, Body Composition, and Aerobic Performance in Women with Obesity
Hun-Young Park
1,2, Won-Sang Jung
2, Jisu Kim
1,2, Hyejung Hwang
2, Kiwon Lim
1,2,3,*
1Department of Sports Medicine and Science, Graduate School, Konkuk University, Seoul; 2Physical Activity and Performance Institute and 3Department of Physical Education, Konkuk University, Seoul, Korea
Background: The present study examined the effects of a prolonged exercise intervention at the lactate threshold (LT) on body composition, aerobic performance, and the autonomic nervous system (ANS) in women with obesity.
Methods: A total of 36 obese Korean women aged 36 to 55 years (mean±standard deviation, 44.8±5.2 years) were randomly assigned to a control group (CON, n=18) or an experimental group (EXP, n=18); and EXP under- went aerobic exercise training three times a week at a heart rate corresponding to the LT (HR_LT) for 12 weeks.
All dependent variables (body composition, aerobic performance, and ANS function parameters) were evaluat- ed before and after training.
Results: Compared with the CON group, the EXP group showed significant improvement in body composition (body weight, −4.57 vs. −2.40 kg; body mass index, −1.79 vs. −0.96 kg/m2; %body fat, −4.63 vs. −1.41; fat-free mass, 3.24 vs. –0.08 kg), aerobic performance (oxygen consumption at LT, 5.74 vs. 0.12 mL/kg/min; maximal oxy- gen consumption, 5.41 vs. 2.14 mL/kg/min; treadmill speed at HR_LT, 1.40 vs. 0.29 km/hr; bicycle load at HR_LT, 18.62 vs. 4.52 w; and ANS function (mean RR, 50.83 vs. −15.04 ms; standard deviation of NN intervals, 5.08 vs.
−0.55 ms; root mean square of successive differences, 6.42 vs. 1.87 ms; total power, 0.34 vs. 0.10 ms2; high fre- quency, 0.32 vs. −0.04 ms2; low frequency/high frequency, −0.09 vs. 0.01).
Conclusion: Aerobic exercise at the LT for 12 weeks is a practical method of improving body composition, aero- bic performance, and ANS function for women with obesity.
Key words: Aerobic exercise, Body composition, Aerobic performance, Autonomic nervous system, Obesity
Received November 4, 2019 Reviewed December 9, 2019 Accepted December 18, 2019
* Corresponding author Kiwon Lim
https://orcid.org/0000-0003-3222-1783 Department of Physical Education, Konkuk University, 120 Neungdong-ro, Gwangjin-gu, Seoul 05029, Korea Tel: +82-2-450-3827
Fax: +82-2-452-6027 E-mail: [email protected]
Obesity is an accumulation of excess fat, caused by energy imbal- ance between excess food intake and the calories consumed.
1Ac- cording to a report by the World Health Organization in 2014, more than 1.9 billion people, or 39% of the world’s adult popula- tion, are overweight and 13%, or 6 million people, are obese.
2As for the prevalence of obesity in Korea, the male obesity rate de- creases with age (32% in 20s, 43.9% in 30s, 39.6% in 40s, 41.5% in
50s, 36.9% in 60s, and 24.0% in more than 70s). On the other hand, women’s obesity rate increases rapidly with age (15.0% in 20s, 18.6% in 30s, 22.3% in 40s, 29.3% in 50s, 36.6% in 60s, and 37.3% in more than 70s).
3This suggests that the obesity rate in- creases by age in women and 20 to 40 years old women who have a relatively low prevalence of obesity need long-term and continuous treatment for obesity.
Copyright © 2020 Korean Society for the Study of Obesity
This is an Open Access article distributed under the terms of the Creative Commons Attribution Non-Commercial License (https://creativecommons.org/licenses/by-nc/4.0/) which permits unrestricted non-commercial use, distribution, and reproduction in any medium, provided the original work is properly cited.
2017-03-16 https://crossmark-cdn.crossref.org/widget/v2.0/logos/CROSSMARK_Color_square.svg
Three methods of preventing and treating obesity are available:
pharmacotherapy, surgery, and combined diet and exercise. Of these, pharmacotherapy and surgery can offer instant weight loss, but due to costs and side effects, they are limited to specific patients in clinical aspects.
4,5However, a combination of dietary and exer- cise therapies has the effect of increasing basal metabolism by acti- vating fat utilization through increased fat and energy consumption as well as weight and body-fat reduction.
6The most recommended exercise modality for prevention and treatment of obesity is aerobic activity, preferably in the form of regular activities such as walking, biking, jogging, etc.
7Aerobic ex- ercise is most effective in reducing fat and body weight when per- formed three to five times a week, with an exercise intensity of 50%
to 85% of maximal oxygen consumption (VO
2max) or 60%–90% of maximal heart rate (HR
max) and an exercise time of 45–60 min- utes.
3,7A wide range of exercise intensity settings using VO
2maxor HR
maxresults in different levels of aerobic and anaerobic metabolic responses during the same exercise load according to the maxi- mum exercise performance of each individual. Menzel and Hil- berg
8recommended an anaerobic threshold (AT) intensity for each individual as the optimal exercise intensity for weight loss.
Among typical methods of determining AT are the lactate thresh- old (LT), which is based on blood lactate levels, and ventilator threshold (VT), which is measured by respiratory gas.
9The LT and VT do not typically appear at the same time, and the LT gen- erally tends to appear before the VT. In addition, the LT indicates a point of rapid change in blood lactate levels, and is considered an efficient and practical method with less subjective bias for deter- mining an AT compared with the VT.
9,10Weight loss through aerobic exercise results in reduced blood cholesterol, improved hypertension, increased insulin sensitivity, reduced risk of cardiovascular disease, and improved aerobic exer- cise capacity.
11,12Aerobic exercise also has reduced levels of leptin, insulin, cortisol, and thyroid stimulating hormone during submaxi- mal exercise,
13-15and it increases the activity of the vagus nerve, re- duces resting heart rate, activates the parasympathetic nervous sys- tem (PNS), and provides for autonomic control.
12,16-18Tests of heart rate variability (HRV) are widely used in clinical practice to examine the relationship between obesity and the auto- nomic nervous system (ANS). It is a noninvasive and reliable eval-
uation method that can quantitatively evaluate the activity of the sympathetic and PNSs.
12,19,20The ANS function is closely related to obesity; a sustained increase in sympathetic nervous system activity at rest causes a decrease in basal metabolism, an increase in body weight, and obesity.
19,21,22Salivary cortisol is also positively correlat- ed with HRV, which represents the sympathetic-parasympathetic balance.
12The ANS response, evaluated by HRV and salivary corti- sol, can be used as an important index for obesity prevention and treatment, and it is necessary to examine the relationship between physiological changes induced by aerobic exercise and ANS chang- es. Kim et al.
12reported that 12 weeks of combined aerobic and re- sistance exercise improves HRV and reduces mental stress in older women with obesity. An exercise program was found to be effective in reducing body fat in elderly women with obesity with similar body composition and cultural patterns in East Asian countries.
Park et al.
23verified that a dietary intervention of 70% of recom- mended dietary allowance and exercise training corresponding to the heart rate at the LT for 12 weeks effectively improved body composition, aerobic performance, and stress. These findings show that moderate aerobic exercise can improve ANS function and pre- vent and treat obesity.
24However, whether prolonged aerobic exer- cise at the LT affects ANS function in women with obesity remains unclear. In this study, we hypothesized that prolonged aerobic exer- cise at the LT would improve ANS function and reduce obesity in middle-aged women. We carried out a randomized trial to investi- gate the influences of aerobic exercise training at the LT for 12 weeks on body composition, aerobic performance, and ANS func- tion in women with obesity.
METHODS Participants
The study participants were 44 obese 36- to 55-year-old Korean
women (mean± standard deviation, 44.8± 5.2 years) with a body
mass index (BMI) > 25 kg/m
2and a history of participating in
only low levels of aerobic activity. Applicants’ menopausal status
was not assessed. Six participants dropped out due to health prob-
lems and personal circumstances during the training period, leav-
ing 36 active participants. The participants consented by signature,
after sufficient explanation of the experimental conditions and ac-
knowledging an understanding of the possible adverse effects, and were randomly assigned to a control group (CON; n= 18) or ex- perimental group (EXP; aerobic exercise group, n= 18) using a computerized random number generator (Table 1). Thirty-six of the participants completed the study and only their data were used in the analyses. All procedures of the study were approved by the Institutional Review Board of Konkuk University (IRB No. 7001355- 201812-HR-288) in Korea and they were conducted according to the Declaration of Helsinki.
Study design
The experimental design involved a 3-day pre-testing session, 12 weeks of intervention, and a 3-day post-testing session. On the first pre- and post-testing days, all participants fasted for more than 8 hours. After stabilization, saliva was collected between 7:00 and 9:00 AM. Body composition and HRV were then measured. On the second pre- and post-test day, a graded exercise test (GXT) was performed on a treadmill to evaluate VO
2max, VO
2corresponding to the LT (VO
2_LT), HR
max, and HR corresponding to the LT (HR_LT). On the third pre- and post-test days, all participants performed an aerobic exercise on a treadmill and a bicycle for 30 minutes each at the HR_LT, and the treadmill speed and bicycle load at the HR_LT were measured. Dietary intake and daily activi- ties were investigated once every 4 weeks to minimize the effect of extrinsic variables on dependent variables.
Participants in the EXP group carried out aerobic exercises on treadmills and bicycles for 30 minutes each (total 60 minutes) at the HR_LT. In contrast, members of the CON group did not carry out any exercise intervention. All exercises were performed three times a week at a constant temperature of 22°C and humidity of 60%, for a total of 12 weeks.
Dietary intake
All participants were requested to record their meals (i.e., type, amount, and ingredients of food) once every 4 weeks both before and during the 12-week intervention period, and nutritionists monitored their records monthly. However, we did not supply spe- cific instructions for dietary treatment because the purpose of this study was not to confirm the effect of dietary treatment. Total ca- loric intake was analyzed by selecting the records twice each week- day and once each weekend at various points throughout the study.
Nutritional analyses were performed using the Computer Applied Nutrition Analysis Program, according to Korea Nutrition Facts from the Korea Food and Drug Administration in the Ministry for Health, Welfare and Family Affairs, Republic of Korea.
Daily activity
To investigate the amount of daily activity other than the pre- scribed exercise of all the subjects, daily caloric consumption was estimated using a fitness band (Polar M400; Polar, Finland).
Height and body composition
Height and body composition parameters (body weight, free-fat mass, percent of body fat, and BMI) were measured using bioelec- trical impedance analysis equipment (Inbody 770; Inbody, Seoul, Korea).
Aerobic performance
Aerobic performance was assessed using two methods. First, it was evaluated based on changes in VO
2maxand VO
2_LT measured by GXT using an automatic breathing gas analyzer (K4B2; Cosmed, Pavona, Italy). As the subjects were obese, the protocol was initiated at 3.6 km/hr and the speed was increased by 1.2 km/hr every 2 min- utes. Second, exercises were performed on a treadmill and bicycle for 30 minutes each in accordance with the HR_LT. Mean values for the speed on the treadmill and the load on the bicycle during 30 minutes of exercise were measured.
ANS function
HRV and salivary cortisol were measured to examine changes in ANS function after 12 weeks of exercise intervention. After approx- imately 30 minutes of rest, four pads were placed on the wrists and
Table 1. Participants’ characteristicsVariable CON (n= 18) EXP (n= 18) P
Age (yr) 45.89± 5.78 44.78± 5.21 0.549
Height (cm) 158.39± 4.23 159.17± 3.45 0.550
Weight (kg) 70.62± 6.94 70.96± 3.76 0.854
BMI (kg/m2) 28.16± 2.64 28.03± 1.62 0.858
Free fat mass (kg) 42.37± 4.16 42.58± 2.26 0.854
Fat mass (%) 34.45± 2.96 35.52± 1.31 0.175
Values are presented as mean± standard deviation.
CON, control group; EXP, experimental group; BMI, body mass index.
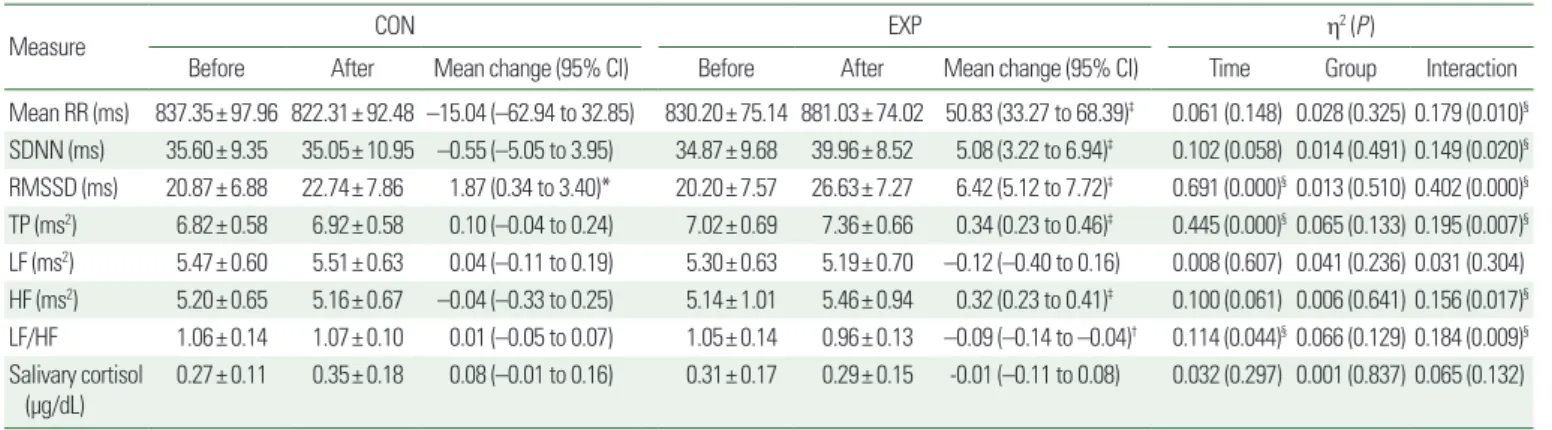
ankles using an HRV analyzer (CANS-3000; LAXTHA, Daejeon, Korea), and the participant’s HRV was measured in a resting condi- tion. The measured HRV parameters were as follows: average of all R-wave-to-R-wave intervals (mean R-wave-to-R-wave; mean RR), standard deviation of successive differences (SDNN) and root mean square of successive differences (RMSSD) were analyzed as time-domain methods, and total power (TP), low frequency (LF), high frequency (HF), and the LF/HF ratio were measured as fre- quency-domain methods. Salivary cortisol was analyzed by an en- zyme-linked immunosorbent assay using the ER HS Salivary Cor- tisol kit (Salimetrics, State College, PA, USA).
Statistical analysis
Means and standard deviations were calculated for all dependent variables. The normality of distribution of all outcome variables was verified using the Kolmogorov-Smirnov test. A two-way analy-
sis of variance with repeated measures on the “time” factor was used to analyze the effects of exercise intervention for 12 weeks on each dependent variable. Post-hoc Bonferroni testing was used to identify within-group changes over time. Clinically meaningful change was assessed by calculating the mean change and 95% con- fidence interval. All analyses were carried out using IBM SPSS ver- sion 23.0 (IBM Corp., Armonk, NY, USA). A priori, the level of significance was set at 0.05.
RESULTS
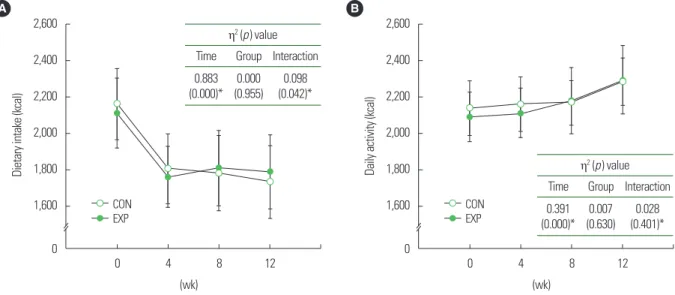
As shown in Fig. 1, a significant interaction is apparent between the two groups for dietary intake (P=0.042, η
2= 0.098). However, daily activity did not show any significant interactions between the two groups. The post-hoc analysis for the group difference at time points in dietary intake with significant interactions found no sig-
Table 2. Body composition before and after training with main analysis of variance results
Measure CON EXP η2 (P )
Before After Mean change (95% CI) Before After Mean change (95% CI) Time Group Interaction
Body weight (kg) 70.62± 6.94 68.22± 7.04 −2.40 (−3.39 to −1.41)† 70.96± 3.76 66.39± 3.56 −4.57 (−6.34 to −2.79)† 0.607 (0.000)‡ 0.005 (0.683) 0.130 (0.031)‡ BMI (kg/m2) 28.16± 2.64 27.20± 2.60 −0.96 (−1.37 to −0.56)† 28.03± 1.62 26.23± 1.69 −1.79 (−2.48 to –1.11)† 0.611 (0.000)‡ 0.017 (0.443) 0.124 (0.035)‡ Fat-free mass (kg) 42.37± 4.16 42.29± 4.36 −0.08 (−0.69 to 0.54) 42.58± 2.26 45.81± 2.46 3.24 (2.09 to 4.38)† 0.438 (0.000)‡ 0.077 (0.102) 0.461 (0.000)‡ Body fat (%) 34.45± 2.96 33.04± 3.01 −1.41 (−2.56 to −0.26)* 35.52± 1.31 30.88± 2.31 −4.63 (−5.97 to –3.30)† 0.606 (0.000)‡ 0.017 (0.453) 0.304 (0.000)‡ Values are presented as mean± standard deviation.
*P< 0.05; †P< 0.001 vs. before training; ‡Significant interaction or main effect.
CON, control group; EXP, experimental group; CI, confidence interval; BMI, body mass index.
Figure 1. Changes of dietary intake (A) and daily activity (B) during the intervention. Mean and standard deviation for dietary intake and daily activity with main analysis of variance in control group (CON) and experimental group (EXP). *Significant interaction or main effect.
A
2,600
2,400
2,200
2,000
1,800
1,600
0
Dietary intake (kcal)
0 4 8 12 CON
EXP
η2 (p ) value Time Group Interaction 0.883
(0.000)*
0.000 (0.955)
0.098 (0.042)*
(wk)
B
2,600
2,400
2,200
2,000
1,800
1,600
0
Daily activity (kcal)
0 4 8 12 CON
EXP
η2 (p ) value Time Group Interaction 0.391
(0.000)* 0.007 (0.630) 0.028
(0.401)*
(wk)
nificant difference between the groups.
A significant difference was found between the two groups for body weight (P=0.031, η
2= 0.130), BMI (P=0.035, η
2= 0.124), fat-free mass (P<0.001, η
2= 0.461), and %body fat (P<0.001, η
2= 0.304) (Table 2). Post-hoc analyses found significant decreases in bodyweight (EXP, −4.57 kg [−6.34 to −2.79 kg]; CON, −2.40 kg [−3.39 to −1.41 kg]; P<0.001), BMI (EXP, −1.79 kg/m
2[−2.48 to −1.11 kg/m
2]; CON, −0.96 kg/m
2[−1.37 to −0.56 kg/m
2]; P<
0.001), and %body fat (EXP, −4.63% [−5.97% to −3.30%]; CON,
−1.41% [−2.56% to −0.26%]; P<0.05). Fat-free mass (EXP, 3.24 kg [2.09 to 4.38 kg]; P<0.001) was significantly increased only in the EXP group. Overall, aerobic exercise at the LT was effective in im- proving body composition.
As shown in Table 3, a significant interaction was observed be- tween the two groups in VO
2_LT (P=0.001, η
2= 0.267), VO
2max(P =0.007, η
2= 0.194), treadmill speed at HR_LT (P <0.001, η
2= 0.520), and bicycle load at HR_LT (P<0.001, η
2= 0.311).
Post-hoc analyses found significantly improved VO
2max(EXP, 5.41 mL/kg/min [3.17 to 7.65 mL/kg/min]; CON, 2.14 mL/kg/min [1.27 to 3.02 mL/kg/min]; P<0.001), treadmill speed at HR_LT (EXP, 1.40 km/hr [1.08 to 1.72 km/hr]; CON, 0.29 km/hr [0.09 to 0.50 km/hr]; P<0.01), and bicycle load at HR_LT (EXP, 18.62 w [11.85 to 25.38 w]; CON, 4.52 w [1.07 to 7.97 w]; P<0.05). VO
2_LT (EXP, 5.74 mL/kg/min [3.63 to 7.85 mL/kg/min]; P<0.001) was significantly increased only in the EXP group. Overall, aerobic ex- ercise at the LT was effective in enhancing aerobic performance.
A significant interaction was found between the two groups for mean RR (P=0.010, η
2= 0.179), SDNN (P=0.020, η
2= 0.149), RMSSD (P<0.001, η
2=0.402), TP (P=0.007, η
2=0.195), LF (P=
0.031, η
2= 0.304), HF (P=0.017, η
2= 0.156), and LF/HF (P=
Table 3. Aerobic performance before and after training with main analysis of variance results Measure
CON EXP η2 (P )
Before After Mean change
(95% CI) Before After Mean change
(95% CI) Time Group Interaction
VO2_LT (mL/kg/min) 24.59± 4.50 24.72± 3.28 0.12 (–2.50 to 2.75) 23.25± 2.98 28.99± 4.00 5.74 (3.63 to 7.85)‡ 0.284 (0.001)§0.065 (0.134) 0.267 (0.001)§ VO2max (mL/kg/min) 36.59± 3.52 38.73± 3.69 2.14 (1.27 to 3.02)‡ 35.30± 2.25 40.71± 4.64 5.41 (3.17 to 7.65)‡ 0.563 (0.000)§0.003 (0.749) 0.194 (0.007)§ Treadmill speed at HR_LT
(km/hr)
5.81± 0.68 6.11± 0.80 0.29 (0.09 to 0.50)† 5.53± 0.39 6.93± 0.81 1.40 (1.08 to 1.72)‡ 0.718 (0.000)§0.046 (0.211) 0.520 (0.000)§ Bicycle load at HR_LT (w) 61.99± 13.58 66.52± 15.65 4.52 (1.07 to 7.97)* 58.22± 11.20 76.83± 14.62 18.62 (11.85 to 25.38)‡ 0.549 (0.000)§0.017 (0.448) 0.311 (0.000)§ Values are presented as mean± standard deviation.
*P< 0.05; †P< 0.01; ‡P< 0.001 vs. before training; §Significant interaction or main effect.
CON, control group; EXP, experimental group; CI, confidence interval; VO2_LT, oxygen consumption corresponding to the lactate threshold; VO2max, maximal oxygen consumption; HR_
LT, heart rate corresponding to the lactate threshold.
Table 4. Autonomic nervous system function before and after training with main analysis of variance results
Measure CON EXP η2 (P )
Before After Mean change (95% CI) Before After Mean change (95% CI) Time Group Interaction
Mean RR (ms) 837.35± 97.96 822.31± 92.48 –15.04 (–62.94 to 32.85) 830.20± 75.14 881.03± 74.02 50.83 (33.27 to 68.39)‡ 0.061 (0.148) 0.028 (0.325) 0.179 (0.010)§ SDNN (ms) 35.60± 9.35 35.05± 10.95 –0.55 (–5.05 to 3.95) 34.87± 9.68 39.96± 8.52 5.08 (3.22 to 6.94)‡ 0.102 (0.058) 0.014 (0.491) 0.149 (0.020)§ RMSSD (ms) 20.87± 6.88 22.74± 7.86 1.87 (0.34 to 3.40)* 20.20± 7.57 26.63± 7.27 6.42 (5.12 to 7.72)‡ 0.691 (0.000)§0.013 (0.510) 0.402 (0.000)§ TP (ms2) 6.82± 0.58 6.92± 0.58 0.10 (–0.04 to 0.24) 7.02± 0.69 7.36± 0.66 0.34 (0.23 to 0.46)‡ 0.445 (0.000)§0.065 (0.133) 0.195 (0.007)§ LF (ms2) 5.47± 0.60 5.51± 0.63 0.04 (–0.11 to 0.19) 5.30± 0.63 5.19± 0.70 –0.12 (–0.40 to 0.16) 0.008 (0.607) 0.041 (0.236) 0.031 (0.304) HF (ms2) 5.20± 0.65 5.16± 0.67 –0.04 (–0.33 to 0.25) 5.14± 1.01 5.46± 0.94 0.32 (0.23 to 0.41)‡ 0.100 (0.061) 0.006 (0.641) 0.156 (0.017)§ LF/HF 1.06± 0.14 1.07± 0.10 0.01 (–0.05 to 0.07) 1.05± 0.14 0.96± 0.13 –0.09 (–0.14 to –0.04)† 0.114 (0.044)§0.066 (0.129) 0.184 (0.009)§ Salivary cortisol
(μg/dL) 0.27± 0.11 0.35± 0.18 0.08 (–0.01 to 0.16) 0.31± 0.17 0.29± 0.15 -0.01 (–0.11 to 0.08) 0.032 (0.297) 0.001 (0.837) 0.065 (0.132) Values are presented as mean± standard deviation.
*P< 0.05; †P< 0.01; ‡P< 0.001 vs. before training; §Significant interaction or main effect.
CON, control group; EXP, experimental group; CI, confidence interval; SDNN, standard deviation of NN intervals; RMSSD, root mean square of successive differences; TP, total pow- er; LF, low frequency; HF, high frequency.