D I A B E T E S & M E T A B O L I S M J O U R N A L
This is an Open Access article distributed under the terms of the Creative Commons At- tribution Non-Commercial License (http://creativecommons.org/licenses/by-nc/3.0/) which permits unrestricted non-commercial use, distribution, and reproduction in any medium, provided the original work is properly cited.
Effects of Aerobic Exercise vs. Resistance Training on Endothelial Function in Women with Type 2 Diabetes Mellitus
Hwi Ryun Kwon1,*, Kyung Wan Min2,*, Hee Jung Ahn1, Hee Geum Seok1, Jae Hyuk Lee1, Gang Seo Park2, Kyung Ah Han2
1Diabetes Center, Eulji Hospital,
2Department of Internal Medicine, Eulji University College of Medicine, Seoul, Korea
Background: There is controversy over whether aerobic or resistance exercise is more effective for improving endothelial func- tion in type 2 diabetes mellitus (T2DM). This study was aimed to investigate the effects of an aerobic and resistance training pro- gram on endothelial function, and the influences of glycemic control, body weight changes, and aerobic capacity in T2DM.
Methods: Total 40 overweight women with T2DM were assigned into 3 groups: an aerobic exercise group (AEG, n=13), resis- tance exercise group (REG, n=12), and control group (CG, n=15), and followed either brisk walking for the AEG or resistance band training for the REG, 60 minutes per day, 5 days per week for 12 weeks with monitoring daily activity using accelerometers.
We assessed endothelial function by flow-mediated dilation (FMD), and aerobic capacity by oxygen uptake at anaerobic thresh- old (AT_VO2) at baseline and following training program.
Results: The mean participants’ age was 57.0±6.8 years, and body mass index (BMI) was 27.0±2.3 kg/m2. After intervention, FMD increased by 2.2±1.9% in AEG, which differed from REG and CG (P=0.002), despite of decreased body weight (BW) in both AG and RG (2.8±2.5%, P=0.002; 1.6±2.0%, P=0.017, respectively). A significant increased AT_VO2 and decreased HbA1c were found only in AEG. In all participants, FMD was changed with the significant relations to the AT_VO2 (r=0.348, P=0.035), but not to HbA1c levels or BW.
Conclusion: Aerobic exercise appears to be more beneficial than resistance exercise for improving endothelial function in T2DM.
In addition, aerobic capacity could be a better predictor of changes in FMD than BW and glycemic control.
Keywords: Aerobic exercise; Diabetes mellitus, type 2; Endothelial function; Resistance training
Corresponding author: Kyung Ah Han
Diabetes Center, Eulji Hospital, 280-1 Hagye 1-dong, Nowon-gu, Seoul 139-711, Korea
E-mail: [email protected]
Received: Sep. 3, 2010; Accepted: Jan. 25, 2011
INTRODUCTION
The endothelium is a thin layer of cells at the internal surface of blood vessels; it also regulates vascular tension and main- tains structure. The function of the vessel walls and interac- tions with adjacent blood components are included, and are endocrine organs that play important physiological roles [1].
Endothelial dysfunction has been recognized as the early event and the common feature of chronic disorders associated with increased risk for atherosclerotic heart diseases [2]. As nitric oxide bioavailability, crucial for maintaining vascular endo- thelial health and function, decrease, the endothelial dysfunc- tion that is measured by flow-mediated dilation (FMD) ac- companies a number of cardiovascular disease states including pISSN 2233-6079 · eISSN 2233-6087
hypertension, diabetes, chronic heart failure, and atheroscle- rosis. Regular exercise increases the numbers of smooth mus- cle cells and endothelial cells, expands aortic vessels, and in- creases arterial diameter. Smooth muscle cells and endothelial cells promote differentiation, and increases in the number of capillaries contribute to favorable outcomes in vasculature [3].
Evidence is emerging to support a role for improved nitric ox- ide bioavailability with training as a result of enhanced synthe- sis and reduced oxidative stress-mediated destruction [4].
Xiang and Wang [5] conducted a 6-month study on subjects with impaired fasting glucose (IFG). Their subjects performed aerobic exercise 4 to 6 times per week for 40 to 45 minutes at an intensity of 70% to 75% of maximum heart rate (HRmax), which resulted in significant improvements to endothelial func- tion. When Cohen et al. [6] studied the effects of a 14-month progressive resistance exercise program (75% to 85% 1RM, 3 sets, 8 reps) on obese subjects with T2DM, they also reported improvements in endothelial function. In addition to these studies, numerous other studies that have reported the im- provements on endothelial cell function that result from exer- cise [7-9]. In contrast, Ostergard et al. [10] conducted a 10- week study on the effects of aerobic exercise on obese T2DM subjects, and reported no change in FMD. Wycherley et al.
[11] performed a 12-week study involving a combination of ex- ercise and dietary therapy on T2DM subjects, and also report- ed no change in endothelial function. Middlebrooke et al. [12]
also conducted a 6-month aerobic exercise study on T2DM subjects, and reported no significant change in vascular endo- thelial function. Thus, the results of studies on the effects of exercise on endothelial function in T2DM subjects are varied.
Similar studies that compare the effectiveness of different ex- ercise modalities endothelial cell function in Korean T2DM subjects are still lacking, as are studies on the factors associat- ed with endothelial cell function.
In the current study, the effects of aerobic exercise and resis- tance exercise on endothelial cell function, vascular on endo- thelial cell function, body weight, glycated hemoglobin levels, and their relationships with cardiorespiratory fitness were as- sessed in Korean women with T2DM.
METHODS
Study subjects
Forty female subjects with T2DM who visited the Diabetes Center at Eulji Hospital participated in this study. This clinical
study was approved by the judging panel of the Hospital Stud- ies Board (approval number: EMCIRB 10-107). The study sample consisted of type 2 diabetic women between the ages of 45 and 65 years. Women with body mass indexes (BMIs) over 23 kg/m2 were classified as overweight, and those with low risk for hypoglycemia were treated with metformin mono- therapy. To reduce drug effects, we selected subjects with gly- cated hemoglobin values under 9% who received over 1,000 mg of metformin per day, and drug dosages were maintained throughout the study. The administration and dosages of anti- hypertensive agents was also maintained (angiotensin receptor blocker, ARB; angiotensin converting enzyme inhibitor, ACEI;
calcium channel blockers, CCB) in participants (aerobic exer- cise group, 8 subjects; resistance exercise group, 7 subjects;
control group, 10 subjects). Subjects with type 1 diabetes mel- litus, congestive heart failure, uncontrollable cardiac arrhyth- mias, severe valvular heart disease, uncontrolled high blood pressure, and severe illness that precluded them from exercis- ing were excluded from this study. The numbers of subjects taking antihypertensive agents in the three groups did not dif- fer. The subjects were investigated for family history of coro- nary artery disease, ischemic heart disease, stroke, and arterial stiffness, and no significant differences were found between the three groups. In addition, pulse wave conduction velocity tests showed no significant differences between the three groups.
Exercise methods
During the 2-week screening period, we tracked regular phys- ical activity and dietary calories consumed by the study sub- jects, and then randomly assigned the subjects to one of three groups: a moderately intense exercise group (n=13), a resis- tance exercise group (n=12), or a control group (n=15). For the 12 weeks that followed, each group performed the corre- sponding exercise therapy program.
For the aerobic exercise group, the subjects were assigned to walk for 60 minutes per session, 5 times per week at a moder- ate intensity, as recorded by a multi-record accelerometer. An accelerometer reading of 4 to 6 (3.6 to 6.0 METs) was estab- lished as the correct intensity. During the first 4 weeks, the subjects visited the hospital once per week; for the remaining 8 weeks, the subjects visited the hospital every two weeks.
The resistance exercise group used resistance bands (Thera- band; Hygenic Co., Akron, OH, USA) in their exercise pro- grams. The amount of resistance in the band is dependent on
the band length. When the bands are stretched 50/75/100%, red bands provide 1.2/1.5/1.8 kg of resistance, green bands provide 1/5/1.9/2.3 kg of resistance, and blue bands provide 2.1/2.7/3.2 kg of resistance, respectively. To elicit the proper adaptations in connective tissue, the resistance was set at its minimum setting for the first two weeks, and strength was gradually increased by up to 40-50% over the 12-week study period. Three sets of 10 to 15 exercises were performed per ex- ercise session. Exercise frequency was 3 sessions per week, and the sessions were conducted in groups. The subjects were in- structed to start with a 10-minute warm-up, perform 40 min- utes of resistance training, and cool-down for 10 minutes.
The resistance training program was based on a method used by Dean et al. [13]. Upper body exercises included bicep curls, tricep extensions, upright rows, shoulder chest press, and seated rows. Core exercises included trunk side bends, and lower body exercises included a leg press, hip flexions, leg flex- ions, and leg extensions.
During the 12-week study period, the control group main- tained usual activities and was not required to exercise.
Metrics and measurement methods
Anthropometric measurements and biochemical tests Before the study, and after the 12-week study period, the height and weight of the subjects were measured with the subjects wearing only thin gowns. BMI was then calculated by dividing weight (kg) by height squared (m2). Waist circumference was measured at the narrowest point between the bottom of the ribs and the top of the iliac crest using a tape measure after the subject had exhaled comfortably. Blood pressure was measured after 10 minutes of rest in a seated position, and using a mer- cury sphygmomanometer (Yamasu, Tokyo, Japan).
Venous blood samples were collected for biochemical test- ing following a 10-hour fast, and were separated via centrifuge at 3,000 rpm for 10 minutes. The samples were then stored at -70°C until used for analysis. Fasting blood glucose levels were measured by glucose oxidation, and glycated hemoglobin val- ues were measured using high-performance liquid chroma- tography (HPLC). Fasting blood glucose, total cholesterol, tri- glycerides, high density lipoprotein cholesterol, and low den- sity lipoprotein cholesterol levels were measured using an en- zymatic reaction measuring kit, and were analyzed using an automatic biochemical analyzer (Hitachi 7170; Hitachi, Tokyo, Japan). Fasting insulin levels were measured using the Inmy- life 2000 (Siemens, Mountain View, CA, USA) electrochemi-
cal luminescence immunoassay.
Physical activity caloric expenditure and dietary caloric in- take survey
A multi-record accelerometer was used to monitor the physi- cal activity of the study participants (Lifecorder; Suzuken Co., Nagoya, Japan) [14,15]. The multi-record accelerometer is able to store data and vertical movements of the body are recorded at 4-second intervals. There were 11 levels of exercise intensity, 0 representing no exercise at all. Activity level was determined by the intensities as follows: 0.5, micro-activity; 1-3, low inten- sity exercise; 4-6, moderate exercise; 7-9, high intensity exer- cise; and 11, maximum intensity exercise performed for at least 2 minutes following high intensity exercise. Prior to experi- ments, age, sex, height, and weight measurements were taken, and after inputting activity durations, and excluding sleep and bath times when the accelerometer could not be worn, levels of normal physical activity were investigated for 2 weeks. Basal metabolic rate, total energy consumed vs. body weight, daily average energy expenditure from activity, average time spent walking, average energy used during maximum energy burn- ing activity and the intensity of that physical activity, were all estimated. The intensity of each activity was then analyzed based on time. Data were re-input every 2 weeks based on changes in body weight.
A 3-day dietary caloric intake survey was completed by the three groups that covered 2 weekdays, and 1 weekend day. The subjects recorded their dietary intakes on recording forms, and had the details of their dietary consumption reviewed during a biweekly visit. To record meals, the subjects were giv- en simple dietary record-keeping pre-training, and the amounts of food consumed and the ingredients of every meal consumed were recorded on the dietary consumption investigation form, along with nutritional supplements, snacks, and other intake.
To improve the accuracy of the dietary records that were col- lected, a dietician used full-scale food models (Korea Mirage Model), measuring cups, measuring spoons, photos of food, and visual estimates (The Korean Dietetic Association, 1999) during direct interviews with the subjects while reviewing the details of their records. The computer-aided nutritional analy- sis program CAN-Pro version 2.0 (Korean Nutrition Society, Seoul, Korea) was used to analyze dietary record data and to convert data to nutritional intake values.
Graded exercise test
The graded exercise test was performed using a stationary bi- cycle (ER 900, D-72475 Bits; JAGER, Wuerzburg, Germany).
During rest and during incremental exercise tests, blood pres- sure and heart rates were taken. We increased power output by 20 W every 2 minutes (as measured using respiratory gas anal- ysis) until the subjects were no longer able to continue exercis- ing. The criterion for stopping the exercise test was the subject absolutely quitting exercising during the exercise test [16]. We recorded and analyzed respiratory gas data that were collected every 15 seconds before exercise, during exercise, and during recovery; heart rate, oxygen consumption, work-load, respira- tory rate, and other parameters were recorded and graphed automatically. Blood pressure was measured every 2 minutes using an automatic blood pressure monitor. During the bicy- cle exercise, pedaling speed was maintained at 50 to 60 rpm.
Anabolic threshold (AT) was calculated based on carbon di- oxide emissions, displayed on a screen every 15 seconds on an X and Y axis graph, and was later analyzed using a regression analysis program.
Endothelial cell function test
To confirm endothelial cell function, we measured endotheli- um-dependent vasodilation response (FMD) in the brachial arteries, and endothelium independent vasodilation (EID) us- ing the 11 MHz transducer of a high-resolution B-mode ultra- sound device (LOGIC 400 CL PRO; GE Medical Systems, Milwaukee, WI, USA). To eliminate effects from the tests, the subjects maintained a fasting state for 10 hours during the ex- amination, and were also instructed not to consume alcohol, caffeine, or smoke. Measurements were made based on the ex- amination method recommended by Celermajer et al. [17].
First, 10 minutes after measuring baseline FMD, and following subglossal administration of 0.6 mg nitroglycerin, EID was measured using vascular smooth muscle sensitivity to exoge- nous nitric oxide, particularly to see organic diseases in the vascular smooth muscle. Subjects were stabilized in the supine position on a bed, and using high-resolution B-mode echocar- diography, the diameter of the left brachial artery was mea- sured twice, and the average of the two readings was defined as baseline. We located the upper 5 to 10 cm of the brachial ar- tery by probing the antecubital fossa, and the center of the brachial artery was set as the reference point of the brachial artery. Using the B-mode ultrasound device, the vessel diame- ter was measured as the distance from the intima/vascular
media interface (m-line) on one side of the vessel to the same interface on the opposite side of the vessel. We took our mea- surements immediately before the end of the diastole and the origin of electrocardiogram R, to reduce variability in the measurement. Following the baseline vessel diameter mea- surement, and after removing the probe, a brachial cuff was applied and the pressure in the cuff was raised to 250 mm Hg and maintained for 5 minutes. The pressure reading on the sphygmomanometer was then lowered to 0 mm Hg, and the probes were repositioned after removing the sphygmoma- nometer cuff. The rate of blood flow was recorded for 50 sec- onds following cuff removal and the maximum stretch diame- ter of the brachial artery was calculated based on the blood flow rate.
Increases in vessel diameter were calculated as a percentage change from baseline in a hyperglycemic state, and represent the FMD response. To measure EID, the subjects were instruct- ed to relax in a supine position for 10 minutes following the FMD measurement. After re-measuring the baseline brachial artery diameter, 0.6 mg of nitroglycerine was administered hypoglossally. During 4 minutes of observation with a probe, when the brachial artery diameter had increased to its maxi- mum size, the increased diameter was calculated as a percent- age, and expressed as the EID response.
Statistical analysis
We used the statistical analysis program SPSS for Windows version 15.0 (SPSS Inc., Chicago, IL, USA) to calculate the means and standard deviations of the values collected. For val- ues that did not follow a normal distribution, analysis was performed after log transformation. To compare each group, a one-way ANOVA was performed, and the before and after comparisons within group were performed using paired t-tests.
A partial correlation analysis was used to adjust the correla- tion analysis of FMD, glycated hemoglobin, weight, age, rela- tionship with cardiorespiratory fitness, and duration of diabe- tes. P values under 0.05 were considered statistically significant in the interpretation of the results.
RESULTS
General characteristics of the study subjects
The 40 participants were divided into 3 groups: the aerobic ex- ercise group (13 subjects), resistance exercise group (12 sub- jects), and control group (15 subjects). The overall mean age
was 57.0±6.8 years and the mean duration of diabetes mellitus was 5.4±4.9 years. Mean BMI was 27.0±2.3 kg/m2, mean gly- cated hemoglobin was 7.4±0.8%, and age, duration of diabetes mellitus, BMI, and glycated hemoglobin were not significantly different between the groups. Insulin and cholesterol levels were not significantly different among three groups. The mean flow-mediated, endothelium-dependent vasodilation (FMD), endothelium-independent vasodilation (EID) were 4.6±2.0%
and 18.0±5.7%, respectively, and the values were not signifi- cantly different among three groups. The anaerobic ventilation threshold for the aerobic exercise, resistance exercise, and con- trol groups were 8.8±2.7 mL/min/kg, 10.2±3.6 mL/min/kg, and 9.7±4.1 mL/min/kg, respectively, and there was no signif- icant difference between the groups. Mean daily caloric expen- diture from aerobic or resistance exercise and total calories ex- pended were 273.9±70.1 kcal/day and 1,849.7±181.6 kcal/
day, respectively, and mean daily dietary caloric intake was 1,884.3±142.8 kcal/day. There were no significant differences in these results between groups (Table 1).
Changes in anthropometric measurements and biochemical markers
After 12 weeks of exercise, the aerobic exercise group de- creased their mean body weight by 2.8±2.5%, which was a significant reduction compared to baseline and the control group (P=0.002, P=0.003, respectively). There was also a sig- nificant difference between the groups (P=0.045). In addition, the resistance exercise group showed a reduction of 1.6±2.0%
(P=0.017) compared to baseline, and the control group a 0.9±
1.6% weight loss compared to baseline; however neither change was statistically significant (P=0.055). Glycated hemoglobin levels in the aerobic exercise group decreased by 6.6±9.8%, and compared to baseline and the control group, this was a significant change (P=0.027, P=0.015, respectively); however, there was no significant difference between the groups (P=
0.122). Resistance exercise caused a 4.4±9.9% reduction in glycated hemoglobin levels; however, compared to baseline and the control group, this was not a significant change. The control group increased their glycated hemoglobin levels by Table 1. Clinical characteristics of study subjects at baseline
Characteristic AEG (n=13) REG (n=12) CG (n=15) P value
Age, yr 55.5±8.6 56.3±6.1 58.9±5.7 0.720
DM duration, yr 6.6±6.7 4.6±2.7 4.9±4.7 0.889
Weight, kg 66.2±7.3 66.3±4.6 65.2±5.6 0.639
BMI, kg/m2 26.7±2.6 27.4±2.1 27.0±2.3 0.407
Waist, cm 88.4±6.0 90.8±4.8 90.4±5.5 0.480
HbA1c, % 7.6±0.8 7.4±0.9 7.1±0.7 0.770
Insulin, μIU/mL 3.3±2.5 5.8±5.9 4.9±3.8 0.249
Fasting C-peptide, ng/mL 1.7±0.5 1.9±0.8 1.6±0.5 0.731
Total cholesterol, mg/dL 171.8±45.3 157.8±25.4 173.1±51.0 0.357
Triglyceride, mg/dL 145.2±65.9 193.0±114.3 168.0±161.0 0.745
HDL-C, mg/dL 42.6±9.8 42.8±8.5 44.4±18.6 0.337
LDL-C, mg/dL 114.8±41.1 89.7±26.8 102.1±40.2 0.248
FMD, % 4.0±1.9 4.9±2.5 4.8±1.6 0.964
EID, % 17.0±5.6 18.4±7.3 18.6±4.3 0.272
AT_VO2, mL/min/kg 8.8±2.7 10.2±3.6 9.7±4.1 0.210
AEE, kcal/day 289.2±30.2 291.1±105.2 246.8±54.3 0.638
TEE, kcal/day 1,898.1±165.0 1,842.9±203.1 1,813.1±180.2 0.591
DEI, kcal/day 1,917.9±151.9 1,863.0±169.0 1,872.2±114.0
Values are presented as mean±standard deviation. P values were calculated from ANOVA test among 3 groups.
AEG, aerobic exercise group; REG, resistance exercise group; CG, control group; DM, diabetes mellitus; BMI, body mass index; HbA1c, glyco- sylated hemoglobin; HDL-C, high density lipoprotein cholesterol; LDL-C, low density lipoprotein cholesterol; FMD, flow-mediated vasodila- tion; EID, endothelium independent vasodilation; AT_VO2, oxygen uptake at anaerobic threshold; AEE, activity energy expenditure; TEE, total energy expenditure; DEI, dietary energy intake.
0.1±6.4%, but this, too, was not a statistically significant dif- ference. Insulin and cholesterol levels did not change signifi- cantly in the aerobic exercise, resistance exercise, or control groups (Table 2).
Changes in calories consumed vs. changes in calories expended for physical activity
After 12 weeks, the calories burned by the aerobic exercise
group increased by 125.9 kcal/day from baseline; however, this was significantly different from the resistance exercise group or control group (P=0.001, P<0.001, respectively). There was no significant change in this regard in the resistance group or the control group.
The caloric intake of the aerobic exercise group, resistance exercise group, and control group all decreased significantly from baseline by 137.4±166.1 kcal/day, 124.8±128.9 kcal/day, and 131.7±126.4 kcal/day, respectively (P=0.001, P<0.001, P=0.001, respectively), but there was no significance among three groups (P=0.164) (Table 3).
Changes in cardiorespiratory fitness
The oxygen consumption at the anaerobic threshold values was used to assess cardiorespiratory fitness, which increased from baseline by 7.1±5.1 mL/min/kg in the aerobic exercise group, and it was a significant difference compared to the re- sistance exercise group and the control group (P=0.022, Table 2. Changes in anthropometric and biochemical vari-
ables
Variable Group Baseline Post-interven- tion P value Weight, kg AEG 65.3±7.2 63.5±6.8a,b 0.045
REG 66.3±4.6 65.2±4.8a CG 65.9±5.7 65.4±5.8
HbA1c, % AEG 7.5±0.7 7.0±0.7a,b 0.122
REG 7.4±0.9 7.0±0.9
CG 7.2±0.8 7.2±0.8
Insulin, μIU/mL AEG 3.8±2.5 3.4±2.2 0.874
REG 5.8±5.9 4.3±3.7
CG 4.4±3.9 3.8±3.2
Fasting C-peptide,
ng/mL AEG 1.8±0.5 1.5±0.4 0.739
REG 1.9±0.8 1.8±0.7
CG 1.6±0.5 1.5±0.5
Total cholesterol,
mg/dL AEG 174.5±42.9 169.9±45.8 0.773
REG 157.8±25.4 159.4±30.0 CG 170.7±52.6 173.0±49.3 Triglyceride, mg/dL AEG 139.9±65.8 125.8±62.8 0.623
REG 193.0±114.3 151.3±81.5 CG 172.5±160.2 139.9±63.0
HDL-C, mg/dL AEG 43.5±8.9 43.6±8.2 0.464 REG 42.8±8.5 44.1±6.3
CG 43.7±19.0 45.5±13.1
LDL-C, mg/dL AEG 114.8±41.1 106.8±43.2 0.629 REG 89.7±26.8 87.9±28.8
CG 102.1±10.2 104.0±43.5
Values are presented as mean±standard deviation. P values were cal- culated from ANOVA test between 3 group at the time of 12 week.
AEG, aerobic exercise group; REG, resistance exercise group; CG, control group; HbA1c, glycosylated hemoglobin; HDL-C, high den- sity lipoprotein cholesterol; LDL-C, low density lipoprotein choles- terol.
aComparison between baseline and intervention within group, bSig- nificantly different compared to control group.
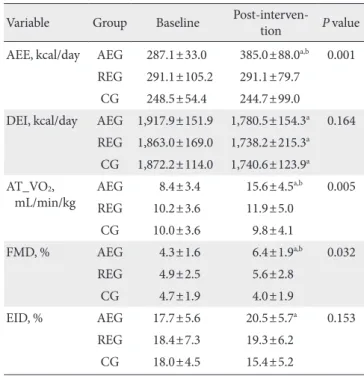
Table 3. Changes in activity energy expenditure (AEE), di- etary energy intake (DEI), and endothelial function
Variable Group Baseline Post-interven-
tion P value AEE, kcal/day AEG 287.1±33.0 385.0±88.0a,b 0.001
REG 291.1±105.2 291.1±79.7 CG 248.5±54.4 244.7±99.0
DEI, kcal/day AEG 1,917.9±151.9 1,780.5±154.3a 0.164 REG 1,863.0±169.0 1,738.2±215.3a
CG 1,872.2±114.0 1,740.6±123.9a AT_VO2,
mL/min/kg AEG 8.4±3.4 15.6±4.5a,b 0.005
REG 10.2±3.6 11.9±5.0
CG 10.0±3.6 9.8±4.1
FMD, % AEG 4.3±1.6 6.4±1.9a,b 0.032
REG 4.9±2.5 5.6±2.8
CG 4.7±1.9 4.0±1.9
EID, % AEG 17.7±5.6 20.5±5.7a 0.153
REG 18.4±7.3 19.3±6.2
CG 18.0±4.5 15.4±5.2
Values are presented as mean±standard deviation. P values were cal- culated from ANOVA test among 3 groups at the time of 12 week.
AEG, aerobic exercise group; REG, resistance exercise group; CG, control group; AT_VO2, uptake oxygen at anaerobic threshold; FMD, flow-mediated vasodilation; EID, endothelium independent vasodi- lation.
aComparison between baseline and intervention within group, bSig- nificantly different compared to control group.
P=0.002, respectively). There were also significant differences between all three groups (P=0.006). There was no significant change between the resistance exercise group and the control group (Table 3).
Changes in endothelial function
In the aerobic exercise group, FMD, which reflects endothelial cell function, was enhanced by 2.2±1.9%. This is a significant difference from the control group and baseline (P=0.002, P=0.005, respectively), and there were significant differences between groups, as well (P=0.002). The resistance group im- proved by 0.7±3.6% from baseline, but the change was not sta- tistically significant (P=0.535), and the control group showed a reduction of 0.7±2.8% (P=0.365) from baseline. EID in the aerobic exercise group increased significantly from baseline, but there were no significant differences between groups, and the resistance group and the control group showed no statisti- cally significant changes in EID (Table 3).
Relationships between endothelial cell function and glycated hemoglobin, and body weight and
cardiorespiratory fitness
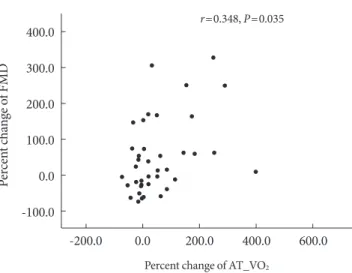
After 12 weeks of exercise, and after adjusting for age, body weight, and duration of diabetes mellitus, changes in glycated hemoglobin and endothelial cell function were shown to have no correlation (r=-0.042, P=0.806). Changes in body weight and in endothelial function were also shown to have no corre- lation (r=-0.240, P=0.146) (Table 4). However, changes in cardiorespiratory fitness and FMD, an indicator for endotheli- al cell function, had a statistically significant correlation (r=0.348, P=0.035) (Fig. 1).
DISCUSSION
Cardiorespiratory fitness improves through regular exercise,
and the risk of cardiovascular disease is reduced [18]. Meta- bolic syndrome and cardiorespiratory fitness have a significant inverse relationship [19,20]. The decline in cardiorespiratory fitness is closely related to abdominal obesity [21,22], and the prevalence of metabolic syndrome that accompanies insulin resistance [23] and hypercholesterolemia [24] are factors that increase premature mortality from cardiovascular disease [25].
Gan et al. [26] conducted an experiment in which obese T2DM subjects performed aerobic exercise (55% to 70% VO2max, 40 minutes, 4 to 5 days per week), and increased their cardiore- spiratory fitness. An et al. [27] reported that non-obese sub- jects with T2DM who walked at a moderate intensity (at an- aerobic threshold) for 40 to 65 minutes, 5 times per week for 12 weeks, had significant increases in their cardiorespiratory fitness. In general, aerobic exercise is recommended for in- creasing cardiorespiratory fitness; however, some studies have shown that resistance exercise may also increase cardiorespi- ratory fitness [28]. In this study, the aerobic exercise group (moderate intensity walking, 5 times per week, for 60 minutes) showed significant improvements in oxygen uptake at the an- aerobic ventilation threshold, and the resistance exercise group (40% to 50% 1RM, 10 to 15 exercises, using a resistance band, 3 sets, 5 days per week, for 60 minutes) showed an increasing trend, although it was not statistically significant, which is consistent with the results of previous studies.
Plasma volume in muscle increases during exercise and the nitric oxide produced in endothelial cells plays an important role in vasodilation. Leukocytes and monocytes prevent things Table 4. Correlations between percent change of endothelial
function, HbA1c, weight, and aerobic capacity
Variable FMD
r P value
HbA1c -0.042 0.806
Weight -0.240 0.146
AT_VO2 0.348 0.035
HbA1c, glycosylated hemoglobin; AT_VO2, oxygen uptake at anaero- bic threshold. Percent change of FMD
400.0 300.0 200.0 100.0 0.0
-100.0
-200.0 0.0 200.0 400.0 600.0 Percent change of AT_VO2
r=0.348, P=0.035
Fig. 1. Correlations between percent change of uptake oxygen at anaerobic threshold (AT_VO2) and percent change of flow- mediated dilation (FMD) (n=40).
from attaching to the blood vessel walls and interfering with the interaction between platelets and the blood vessel walls.
The permeability of endothelial cells is then reduced, and the proliferation of vascular smooth muscle cells is blocked, caus- ing a reduction in intensity from the blood vessels. Endothelial cell dysfunction accompanies aging, and as cardiovascular disease risk factors become accelerated and physical activity decreases, atherosclerosis is exacerbated. Aging is also accom- panied by T2DM, dyslipidemia, hypertension, and endothelial cell dysfunction in obese subjects [29,30]. In this study, chang- es in endothelial cell function were seen as a result of aerobic and resistance exercise. In a 6-month study on obese T2DM subjects who performed aerobic exercise (50% to 70% HRR, 60 minutes/session, 2 times per week), Zoppini et al. [31] re- ported that vascular endothelial cell function improved. Ham- dy et al. [7] performed a 6-month study on T2DM subjects with impaired glucose tolerance in which participants per- formed aerobic exercise (60% to 80% HRmax, 30 minutes, 3 times per week, or at least 150 minutes per week) and reported a significant improvement in endothelial cell function. The current study had a higher frequency of aerobic exercise per week than the study conducted by Zoppini et al., and the exer- cise periods and overall frequency were higher than in the study performed by Hamdy et al. Despite our short study period (12 weeks), the exercise programs appear to have had an effect on vascular endothelial cell function. When we examine studies where no change in endothelial cell function was observed, such as the 10-week aerobic exercise study performed by Os- tergard et al. [12], we note that their study period was shorter than the current study, and that the exercise was less frequent.
A study performed by Wycherley et al. [10] had the same du- ration and frequency of aerobic exercise as the current study, but also implemented dietary measures, resulting in an 8.8%
weight loss; however, they reported that the endothelial cell function of the study subjects was too low, and the effective- ness of exercise was not attributed to improvements in FMD.
Cohen et al. [6] conducted a resistance exercise study on obese T2DM subjects in which progressive resistance exercise (75%
to 85% 1RM, 3 sets, 8 reps) was employed. No significant change in endothelial cell function was observed after 2 months; however, after 14 months they reported an improve- ment in endothelial cell function. The resistance exercises in the current study were performed for 12 weeks at a maximum intensity of 40% to 50% 1RM, and resulted in some improve- ment to endothelial cell function; however, we feel that the du-
ration of the study was too short to yield statistically signifi- cant changes. Thus, due to the short duration of this exercise study, aerobic exercise was more effective than resistance exer- cise in improving endothelial cell function. In a short term ex- ercise program, it appears that a higher frequency of exercise, less baseline damage to endothelial cell function, and a shorter duration of diabetes mellitus, all lead to improved effects on vascular endothelial function.
There is a significant inverse relationship between cardiore- spiratory fitness and metabolic syndrome [19,20,32]. Moder- ate physical activity alone can reduce the incidence of meta- bolic syndrome [33]. The mechanism that imparts the arterial elasticity that determines arterial conductivity, which increas- es cardiac output and, thus, affects skeletal muscle, is very im- portant [34]. At rest, the amount of blood supplied to skeletal muscle is only 15% to 20% of total cardiac output. However, during exercise that induces nearly-maximum oxygen uptake, the skeletal muscle blood supply increases to 85% of total car- diac output. This is because the blood vessels that distribute blood to skeletal muscles play an important role in the regula- tion of the cardiovascular system during exercise [35]. In a 6-month study conducted by Hambrecht et al. [36], subjects with chronic heart failure performed aerobic exercise (70%
HRmax, 40 minutes, 5 times per week). In their results, they reported that maximum oxygen uptake and vascular endothe- lial cell function improved significantly, and that changes in maximum oxygen uptake and vascular endothelial cell func- tion were significantly correlated. In this study, we found that cardiorespiratory fitness and endothelial cell function were significantly correlated. If cardiorespiratory fitness improves through exercise, a positive effect on endothelial cell function can be seen. Weight loss reduces many of the risks of cardio- vascular disease, and in obese subjects weight loss yields an improvement in endothelial cell function [37,38]. Blood glu- cose levels can induce the suppression of endothelial cell de- pendent vasodilation, and reportedly can cause atherosclerosis [39]. In this study, however, changes in body weight and gly- cated hemoglobin levels had no correlation with endothelial cell function.
This study was performed in a sample of T2DM subjects, and although it was shorter in duration than the study con- ducted by Hambrecht et al., the results were similar. We con- clude that to improve endothelial cell function through exer- cise, aerobic exercise that improves cardiovascular fitness ap- pears to be necessary.
There are some limitations of the present study. The effects of aerobic exercise and resistance exercise on endothelial cells may not be adequately elucidated in a study of older female di- abetes patients, especially through a short 12 week study. We infer that the period of the study was too short to observe the full effects of aerobic and resistance exercise on endothelial cell function.
To yield an effect on endothelial cell function through exer- cise, the intensity and frequency of exercise are important, as is the duration of the exercise program. Future studies involv- ing Korean T2DM subjects that are based on intensity of aero- bic exercise might be needed, as are more follow-up studies regarding the effects of a combination of aerobic and resis- tance exercise.
CONFLICTS OF INTEREST
No potential conflict of interest relevant to this article was re- ported.
REFERENCES
1. Ross R. The pathogenesis of atherosclerosis: a perspective for the 1990s. Nature 1993;362:801-9.
2. Perticone F, Ceravolo R, Pujia A, Ventura G, Iacopino S, Scoz- zafava A, Ferraro A, Chello M, Mastroroberto P, Verdecchia P, Schillaci G. Prognostic significance of endothelial dysfunction in hypertensive patients. Circulation 2001;104:191-6.
3. Bloor CM. Angiogenesis during exercise and training. Angio- genesis 2005;8:263-71.
4. Franzoni F, Ghiadoni L, Galetta F, Plantinga Y, Lubrano V, Huang Y, Salvetti G, Regoli F, Taddei S, Santoro G, Salvetti A.
Physical activity, plasma antioxidant capacity, and endotheli- um-dependent vasodilation in young and older men. Am J Hypertens 2005;18(4 Pt 1):510-6.
5. Xiang GD, Wang YL. Regular aerobic exercise training im- proves endothelium-dependent arterial dilation in patients with impaired fasting glucose. Diabetes Care 2004;27:801-2.
6. Cohen ND, Dunstan DW, Robinson C, Vulikh E, Zimmet PZ, Shaw JE. Improved endothelial function following a 14-month resistance exercise training program in adults with type 2 dia- betes. Diabetes Res Clin Pract 2008;79:405-11.
7. Hamdy O, Ledbury S, Mullooly C, Jarema C, Porter S, Ovalle K, Moussa A, Caselli A, Caballero AE, Economides PA, Veves A, Horton ES. Lifestyle modification improves endothelial
function in obese subjects with the insulin resistance syndrome.
Diabetes Care 2003;26:2119-25.
8. Schmidt A, Pleiner J, Bayerle-Eder M, Wiesinger GF, Rodler S, Quittan M, Mayer G, Wolzt M. Regular physical exercise im- proves endothelial function in heart transplant recipients. Clin Transplant 2002;16:137-43.
9. Maiorana A, O’Driscoll G, Cheetham C, Dembo L, Stanton K, Goodman C, Taylor R, Green D. The effect of combined aero- bic and resistance exercise training on vascular function in type 2 diabetes. J Am Coll Cardiol 2001;38:860-6.
10. Ostergard T, Nyholm B, Hansen TK, Rasmussen LM, Ingerslev J, Sorensen KE, Botker HE, Saltin B, Schmitz O. Endothelial function and biochemical vascular markers in first-degree rel- atives of type 2 diabetic patients: the effect of exercise training.
Metabolism 2006;55:1508-15.
11. Wycherley TP, Brinkworth GD, Noakes M, Buckley JD, Clifton PM. Effect of caloric restriction with and without exercise training on oxidative stress and endothelial function in obese subjects with type 2 diabetes. Diabetes Obes Metab 2008;10:
1062-73.
12. Middlebrooke AR, Elston LM, Macleod KM, Mawson DM, Ball CI, Shore AC, Tooke JE. Six months of aerobic exercise does not improve microvascular function in type 2 diabetes mellitus. Diabetologia 2006;49:2263-71.
13. Dean CM, Richards CL, Malouin F. Task-related circuit train- ing improves performance of locomotor tasks in chronic stroke:
a randomized, controlled pilot trial. Arch Phys Med Rehabil 2000;81:409-17.
14. Cooper AR, Page A, Fox KR, Misson J. Physical activity pat- terns in normal, overweight and obese individuals using min- ute-by-minute accelerometry. Eur J Clin Nutr 2000;54:887-94.
15. Kumahara H, Schutz Y, Ayabe M, Yoshioka M, Yoshitake Y, Shindo M, Ishii K, Tanaka H. The use of uniaxial accelerome- try for the assessment of physical-activity-related energy ex- penditure: a validation study against whole-body indirect calo- rimetry. Br J Nutr 2004;91:235-43.
16. American College of Sports Medicine. ACSM’s Guidelines for exercise testing and prescription. 7th ed. New York: Lippincott Williams & Wilkins; 2006. p49-54.
17. Celermajer DS, Sorensen KE, Gooch VM, Spiegelhalter DJ, Miller OI, Sullivan ID, Lloyd JK, Deanfield JE. Non-invasive detection of endothelial dysfunction in children and adults at risk of atherosclerosis. Lancet 1992;340:1111-5.
18. Kemi OJ, Haram PM, Loennechen JP, Osnes JB, Skomedal T, Wisloff U, Ellingsen O. Moderate vs. high exercise intensity:
differential effects on aerobic fitness, cardiomyocyte contrac- tility, and endothelial function. Cardiovasc Res 2005;67:161-72.
19. Whaley MH, Kampert JB, Kohl HW 3rd, Blair SN. Physical fit- ness and clustering of risk factors associated with the metabol- ic syndrome. Med Sci Sports Exerc 1999;31:287-93.
20. Kullo IJ, Hensrud DD, Allison TG. Relation of low cardiore- spiratory fitness to the metabolic syndrome in middle-aged men. Am J Cardiol 2002;90:795-7.
21. Nagano M, Sasaki H, Kumagai S. Cardiorespiratory fitness and visceral fat impact the relationship between psychological fit- ness and metabolic syndrome in Japanese males with type 2 diabetes mellitus. Metab Syndr Relat Disord 2004;2:172-9.
22. Arsenault BJ, Lachance D, Lemieux I, Almeras N, Tremblay A, Bouchard C, Perusse L, Despres JP. Visceral adipose tissue ac- cumulation, cardiorespiratory fitness, and features of the met- abolic syndrome. Arch Intern Med 2007;167:1518-25.
23. Chen CN, Chuang LM, Wu YT. Clinical measures of physical fitness predict insulin resistance in people at risk for diabetes.
Phys Ther 2008;88:1355-64.
24. Bertoli A, Di Daniele N, Ceccobelli M, Ficara A, Girasoli C, De Lorenzo A. Lipid profile, BMI, body fat distribution, and aerobic fitness in men with metabolic syndrome. Acta Diabe- tol 2003;40 Suppl 1:S130-3.
25. Wessel TR, Arant CB, Olson MB, Johnson BD, Reis SE, Sharaf BL, Shaw LJ, Handberg E, Sopko G, Kelsey SF, Pepine CJ, Merz NB. Relationship of physical fitness vs body mass index with coronary artery disease and cardiovascular events in women.
JAMA 2004;292:1179-87.
26. Gan SK, Kriketos AD, Ellis BA, Thompson CH, Kraegen EW, Chisholm DJ. Changes in aerobic capacity and visceral fat but not myocyte lipid levels predict increased insulin action after exercise in overweight and obese men. Diabetes Care 2003;26:
1706-13.
27. An KH, Min KW, Han KA. The Effects of aerobic training ver- sus resistance training in non-obese type 2 diabetics. J Korean Diabetes Assoc 2005;29:486-94.
28. Frontera WR, Meredith CN, O’Reilly KP, Evans WJ. Strength training and determinants of VO2max in older men. J Appl Physiol 1990;68:329-33.
29. Sorensen KE, Celermajer DS, Georgakopoulos D, Hatcher G, Betteridge DJ, Deanfield JE. Impairment of endothelium-de- pendent dilation is an early event in children with familial hy-
percholesterolemia and is related to the lipoprotein(a) level. J Clin Invest 1994;93:50-5.
30. Caballero AE. Endothelial dysfunction in obesity and insulin resistance: a road to diabetes and heart disease. Obes Res 2003;
11:1278-89.
31. Zoppini G, Targher G, Zamboni C, Venturi C, Cacciatori V, Moghetti P, Muggeo M. Effects of moderate-intensity exercise training on plasma biomarkers of inflammation and endothe- lial dysfunction in older patients with type 2 diabetes. Nutr Metab Cardiovasc Dis 2006;16:543-9.
32. Carroll S, Cooke CB, Butterly RJ. Metabolic clustering, physi- cal activity and fitness in nonsmoking, middle-aged men. Med Sci Sports Exerc 2000;32:2079-86.
33. Laaksonen DE, Lakka HM, Salonen JT, Niskanen LK, Raura- maa R, Lakka TA. Low levels of leisure-time physical activity and cardiorespiratory fitness predict development of the meta- bolic syndrome. Diabetes Care 2002;25:1612-8.
34. Richardson RS. What governs skeletal muscle VO2max? New evidence. Med Sci Sports Exerc 2000;32:100-7.
35. Green DJ, O’Driscoll G, Blanksby BA, Taylor RR. Control of skeletal muscle blood flow during dynamic exercise: contribu- tion of endothelium-derived nitric oxide. Sports Med 1996;
21:119-46.
36. Hambrecht R, Fiehn E, Weigl C, Gielen S, Hamann C, Kaiser R, Yu J, Adams V, Niebauer J, Schuler G. Regular physical exercise corrects endothelial dysfunction and improves exercise capac- ity in patients with chronic heart failure. Circulation 1998;98:
2709-15.
37. Bergholm R, Tiikkainen M, Vehkavaara S, Tamminen M, Teramo K, Rissanen A, Yki-Jarvinen H. Lowering of LDL cho- lesterol rather than moderate weight loss improves endotheli- um-dependent vasodilatation in obese women with previous gestational diabetes. Diabetes Care 2003;26:1667-72.
38. Sasaki S, Higashi Y, Nakagawa K, Kimura M, Noma K, Sasaki S, Hara K, Matsuura H, Goto C, Oshima T, Chayama K. A low-calorie diet improves endothelium-dependent vasodila- tion in obese patients with essential hypertension. Am J Hy- pertens 2002;15(4 Pt 1):302-9.
39. Lee SJ, Lee DW, Lee IK. The effect of acute hyperglycemia on endothelial function in type 2 diabetes. J Korean Diabetes As- soc 2000;24:574-86.