Korean J Intern Med 2012;27:397-406
http://dx.doi.org/10.3904/kjim.2012.27.4.397 pISSN 1226-3303 eISSN 2005-6648
http://www.kjim.org
Comparison of Drug-Eluting Stents in Acute Myocardial Infarction Patients with Chronic Kidney Disease
Daisuke Hachinohe
1,2, Myung Ho Jeong
1, Shigeru Saito
2, Min Chol Kim
1, Kyung Hoon Cho
1, Khurshid Ahmed
1, Seung Hwan Hwang
1, Min Goo Lee
1, Doo Sun Sim
1, Keun-Ho Park
1, Ju Han Kim
1, Young Joon Hong
1, Youngkeun Ahn
1, Jung Chaee Kang
1, Jong Hyun Kim
3, Shung Chull Chae
4, Young Jo Kim
5, Seung Ho Hur
6, In Whan Seong
7, Taek Jong Hong
8, Donghoon Choi
9,
Myeong Chan Cho
10, Chong Jin Kim
11, Ki Bae Seung
12, Wook Sung Chung
12, Yang Soo Jang
9,
Seung Woon Rha
13, Jang Ho Bae
14, Seung Jung Park
15, and Korea Acute Myocardial Infarction Registry Investigators
Department of Internal Medicine,
1Chonnam National University Hospital, Gwangju, Korea;
2Sapporo Higashi Tokushukai Hospital, Sapporo, Japan;
3Pusan Hanseo Hospital, Busan;
4Kyungpook National University Hospital, Daegu;
5Yeungnam University Medical Center, Daegu;
6Keimyung University Dongsan Medical Center, Daegu;
7
Chungnam National University Hospital, Daejeon;
8Pusan National University Hospital, Busan;
9Severance Hospital, Yonsei University College of Medicine, Seoul;
10Chungbuk National University Hospital, Cheongju;
11
Kyung Hee University Medical Center, Seoul;
12Seoul St. Mary’s Hospital, The Catholic University of Korea College of Medicine, Seoul;
13Korea University Guro Hospital, Seoul;
14Konyang University Hospital, Daejeon;
15
Asan Medical Center, University of Ulsan College of Medicine, Seoul, Korea
Background/Aims: To determine which drug-eluting stents are more effective in acute myocardial infarction (MI) patients with chronic kidney disease (CKD).
Methods: This study included a total of 3,566 acute MI survivors with CKD from the Korea Acute Myocardial Infarction Registry who were treated with stenting and followed up for 12 months: 1,845 patients who received sirolimus-eluting stents (SES), 1,356 who received paclitaxel-eluting stents (PES), and 365 who received zotarolimus-eluting stents (ZES). CKD was defined as an estimated glomerular filtration rate < 60 mL/min/1.73 m
2calculated by the modification of diet in renal disease method.
Results: At the 12-month follow-up, patients receiving ZES demonstrated a higher incidence (14.8%) of major adverse cardiac events (MACEs) compared to those receiving SES (10.1%) and PES (12%, p = 0.019). The ZES patients also had a higher incidence (3.9%) of target lesion revascularization (TLR) compared to those receiving SES (1.5%) and PES (2.4%, p = 0.011). After adjusting for confounding factors, ZES was associated with a higher incidence of MACE and TLR than SES (adjusted hazard ratio [HR], 0.623; 95% confidence interval [CI], 0.442 to 0.879; p = 0.007; adjusted HR, 0.350; 95% CI, 0.165 to 0.743; p = 0.006, respectively), and with a higher rate of TLR than PES (adjusted HR, 0.471; 95% CI, 0.223 to 0.997; p = 0.049).
Conclusions: Our findings suggest that ZES is less effective than SES and PES in terms of 12-month TLR, and has a higher incidence of MACE due to a higher TLR rate compared with SES, in acute MI patients with CKD.
Keywords: Myocardial infarction; Renal insufficiency; Chronic; Stents
Received : August 16, 2011 Revised : October 12, 2011 Accepted : January 9, 2012
Correspondence to Myung Ho Jeong, M.D.
Department of Internal Medicine, Chonnam National University Hospital, 42 Jebong-ro, Dong-gu, Gwangju 501-757, Korea Tel: 82-62-220-6243, Fax: 82-62-227-3105, E-mail: [email protected]
INTRODUCTION
Primary percutaneous coronary intervention (PCI) with stent implantation is considered the standard treatment strategy in patients with acute myocardial infarction (MI) [1]. Compared with bare-metal stents (BMS), drug-eluting stents (DES) decrease late luminal loss and angiographic restenosis by reducing neointi- mal hyperplasia. Although recent studies have demon- strated that use of DES in acute MI is safe and effective [2-4], vessel healing at the primary pathological site in patients treated with DES for acute MI is delayed com- pared with in patients receiving DES for stable angina [5]. However, second-generation DES, such as zotaro- limus-eluting stent (ZES), may improve vessel healing and endothelial function as well as biologic compatibil- ity [6-8].
Chronic kidney disease (CKD) patients are known to be at high risk of developing coronary artery disease, and CKD is significantly associated with increased mor- tality, MI, and restenosis [9,10]. In these patients, DES has also been shown to be superior to BMS in terms of reduction of clinical and angiographic restenosis [11,12].
There have been many comparative studies of DES [13- 15], but little data are available on the relative effective- ness of particular DES in acute MI patients with CKD.
This issue has important implications for the selection of the most effective treatment strategy in these high- risk patients. Hence, the objective of this study was to determine which DES are more effective in acute MI patients with CKD.
METHODS
Korea Acute Myocardial Infarction Registry (KAMIR)
The KAMIR is a prospective multicenter online regis- try designed to describe the characteristics and clinical outcomes of Korean patients with acute MI and reflect current patient management practice. The registry in- cluded 52 community and university hospitals capable of primary PCI, and data on 13,133 patients with a 12-month clinical follow-up at the time of this study [16].
Data were collected at each site by an experienced study coordinator based on a standardized protocol. The
study protocol was approved by the ethics committee of each participating institution.
Study population
A total of 3,566 acute MI survivors with CKD from the KAMIR who were treated with DES between November 2005 and January 2008 were included: 1,845 patients with sirolimus-eluting stents (SES; Cypher Stent, Cor- dis Co./Johnson and Johnson, Warren, NJ, USA), 1,356 with paclitaxel-eluting stents (PES; Taxus Express Ⅱ Stent, Boston Scientific Co., Natick, MA, USA), and 365 with ZES (Endeavor Sprint Stent, Medtronic CardioVas- cular, Minneapolis, MN, USA). Data were collected for analysis during a 12-month period. CKD was defined as estimated glomerular filtration rate (eGFR) < 60 mL/
min/1.73 m
2calculated using the modification of diet in renal disease (MDRD) method [17].
Definitions and clinical endpoints
Renal function was assessed by eGFR, calculated using the MDRD method [17], based on the serum cre- atinine level upon admission. Acute MI was defined by clinical signs or symptoms, including increased car- diac biomarkers (creatine kinase-MB, troponin-I, or troponin-T), and 12-lead electrocardiographic findings.
ST-segment elevation MI (STEMI) was defined by the presence of new ST-segment elevation of at least 1 mm (0.1 mV) in two or more contiguous leads or new left bundle-branch block on the index electrocardiogram.
Left ventricular ejection fraction was checked by two- dimensional echocardiography. Left main (LM) com- plex lesion was defined as significant stenosis of the LM trunk artery with the presence of other epicardial coronary artery stenosis. The morphology of lesion in coronary angiography was classified using criteria es- tablished by the American College of Cardiology/Ameri- can Heart Association [18]. The degree of coronary flow was classified according to Thrombolysis in MI (TIMI) flow grade [19].
Clinical follow-up was performed at 12 months after
the commencement of the study. Major adverse cardiac
events (MACE) included all-cause death, MI, and target
lesion revascularization (TLR). TLR was defined as a re-
peat stent implantation at the initial site or within 5 mm
proximal or distal to the stent [3].
Statistical analysis
All analyses were performed using SPSS version 17.0 (SPSS Inc., Chicago, IL, USA). Continuous variables are presented as means ± standard deviation and were analyzed by one-way analysis of variance. Categorical variables are expressed as percentages and were com- pared using chi-square contingency table tests or Fisher’s 2 × 2 exact tests. All statistical tests were two-tailed, with statistical significance defined as a p < 0.05. The crude survival curves were constructed using Kaplan- Meier analysis to assess the incidence of outcomes, and log-rank tests were applied to evaluate differences among the treatment groups. Adjusted survival curves were calculated using Cox regression models. To adjust for confounding factors in Cox regression models, we
included variables as covariates with a p < 0.1 in uni- variate regression analysis, as well as other variables that have predicted prognosis of patients with acute MI.
Included variables were age ≥ 65 years, male gender, body mass index (BMI), history of hypertension, history of diabetes mellitus, history of hyperlipidemia, history of coronary artery disease, smoking, eGFR < 30 mL/
min/1.73 m
2, use of cilostazol and glycoprotein (GP) IIb/
IIIa inhibitor, LM complex lesion, multivessel disease, type B2/C lesion, achievement of post-TIMI flow [3], stent length ≥ 25 mm, stent diameter ≤ 2.75 mm, total stent number, and STEMI patients. The results are pre- sented as adjusted hazard ratios (HRs) with 95% confi- dence intervals (CIs).
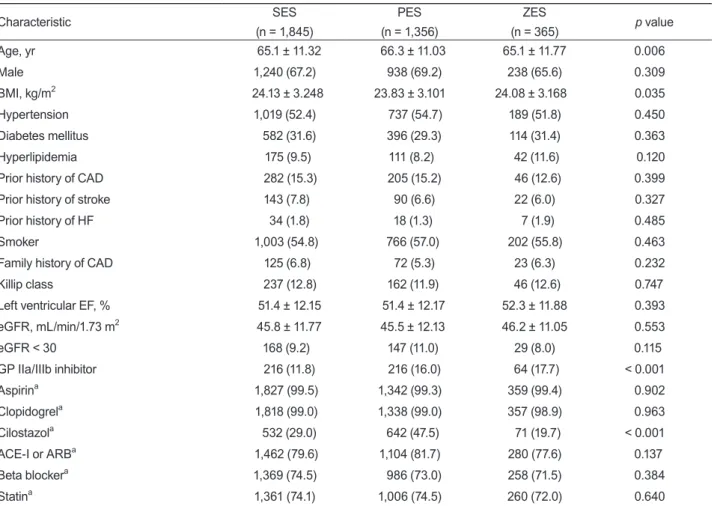
Table 1. Baseline clinical characteristics
Characteristic SES
(n = 1,845)
PES (n = 1,356)
ZES
(n = 365)
p valueAge, yr 65.1 ± 11.32 66.3 ± 11.03 65.1 ± 11.77 0.006
Male 1,240 (67.2) 938 (69.2) 238 (65.6) 0.309
BMI, kg/m
224.13 ± 3.248 23.83 ± 3.101 24.08 ± 3.168 0.035
Hypertension 1,019 (52.4) 737 (54.7) 189 (51.8) 0.450
Diabetes mellitus 582 (31.6) 396 (29.3) 114 (31.4) 0.363
Hyperlipidemia 175 (9.5) 111 (8.2) 42 (11.6) 0.120
Prior history of CAD 282 (15.3) 205 (15.2) 46 (12.6) 0.399
Prior history of stroke 143 (7.8) 90 (6.6) 22 (6.0) 0.327
Prior history of HF 34 (1.8) 18 (1.3) 7 (1.9) 0.485
Smoker 1,003 (54.8) 766 (57.0) 202 (55.8) 0.463
Family history of CAD 125 (6.8) 72 (5.3) 23 (6.3) 0.232
Killip class 237 (12.8) 162 (11.9) 46 (12.6) 0.747
Left ventricular EF, % 51.4 ± 12.15 51.4 ± 12.17 52.3 ± 11.88 0.393
eGFR, mL/min/1.73 m
245.8 ± 11.77 45.5 ± 12.13 46.2 ± 11.05 0.553
eGFR < 30 168 (9.2) 147 (11.0) 29 (8.0) 0.115
GP IIa/IIIb inhibitor 216 (11.8) 216 (16.0) 64 (17.7) < 0.001
Aspirin
a1,827 (99.5) 1,342 (99.3) 359 (99.4) 0.902
Clopidogrel
a1,818 (99.0) 1,338 (99.0) 357 (98.9) 0.963
Cilostazol
a532 (29.0) 642 (47.5) 71 (19.7) < 0.001
ACE-I or ARB
a1,462 (79.6) 1,104 (81.7) 280 (77.6) 0.137
Beta blocker
a1,369 (74.5) 986 (73.0) 258 (71.5) 0.384
Statin
a1,361 (74.1) 1,006 (74.5) 260 (72.0) 0.640
Values are presented as mean ± SD or number (%).
SES, sirolimus-eluting stent; PES, paclitaxel-eluting stent; ZES, zotarolimus-eluting stent; BMI, body mass index; CAD, coronary artery disease; HF, heart failure; EF, ejection fraction; eGFR, estimated glomerular filtration rate; GP, glycoprotein; ACE-I, angiotensin- converting enzyme inhibitor; ARB, angiotensin II receptor blocker.
a
Medication at discharge.
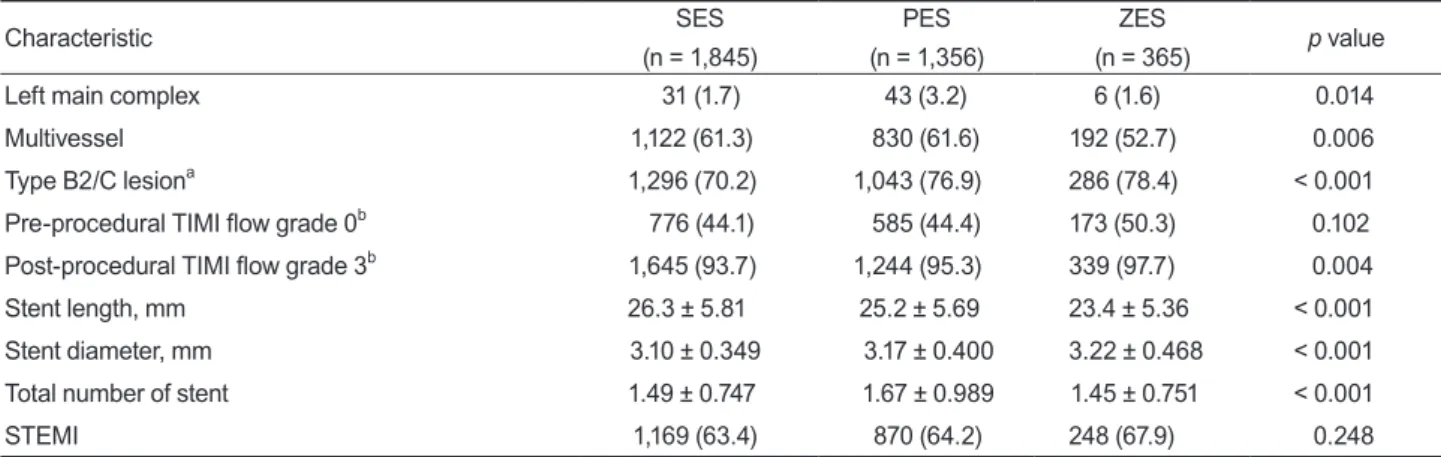
Table 2. Coronary angiographic and procedural characteristics
Characteristic SES
(n = 1,845)
PES (n = 1,356)
ZES
(n = 365)
p valueLeft main complex 31 (1.7) 43 (3.2) 6 (1.6) 0.014
Multivessel 1,122 (61.3) 830 (61.6) 192 (52.7) 0.006
Type B2/C lesion
a1,296 (70.2) 1,043 (76.9) 286 (78.4) < 0.001
Pre-procedural TIMI flow grade 0
b776 (44.1) 585 (44.4) 173 (50.3) 0.102 Post-procedural TIMI flow grade 3
b1,645 (93.7) 1,244 (95.3) 339 (97.7) 0.004
Stent length, mm 26.3 ± 5.81 25.2 ± 5.69 23.4 ± 5.36 < 0.001
Stent diameter, mm 3.10 ± 0.349 3.17 ± 0.400 3.22 ± 0.468 < 0.001
Total number of stent 1.49 ± 0.747 1.67 ± 0.989 1.45 ± 0.751 < 0.001
STEMI 1,169 (63.4) 870 (64.2) 248 (67.9) 0.248
Values are presented as number (%) or mean ± SD.
SES, sirolimus-eluting stent; PES, paclitaxel-eluting stent; ZES, zotarolimus-eluting stent; TIMI, Thrombolysis in Myocardial Infarction;
STEMI, ST-segment elevation myocardial infarction.
a
Type B2/C, the morphology of lesion in coronary angiography was classified according to the criteria of The American College of Cardiology/American Heart Association.
b
Classified according to the TIMI flow grade.
SES vs. ZES: logrank p = 0.188 PES vs. ZES: logrank p = 0.517 SES vs. PES: logrank p = 0.336
SES PES ZES
Time, day 1.00
0.98
0.96
0.94
0.92
0.90
0.88
0.86
0 100 200 300
Death/MI free survival, %
SES vs. ZES: logrank p = 0.008 PES vs. ZES: logrank p = 0.162 SES vs. PES: logrank p = 0.083
SES PES
ZES
Time, day 1.00
0.98
0.96
0.94
0.92
0.90
0.88
0.86
0 100 200 300
MACE free survival, %
SES vs. ZES: logrank p = 0.002 PES vs. ZES: logrank p = 0.114 SES vs. PES: logrank p = 0.077
SES PES ZES
Time, day 1.00
0.98
0.96
0.94
0.92
0.90
0.88
0.86
0 100 200 300
TLR free survival, %
Figure 1. Unadjusted 12-month Kaplan-Meier survival analysis
stratified according to stent type. (A) The composite of major adverse cardiac events (MACEs), including all-cause of deaths, myocardial infarction (MI), and target lesion revascularization (TLR). (B) The composite of death or MI. (C) TLR. PES, paclitaxel- eluting stent; SES, sirolimus-eluting stent; ZES, zotarolimus- eluting stent.
A
C
B
RESULTS
Baseline clinical and procedural characteristics A comparison of the clinical characteristics among the three DES groups suggested that age was greater in the PES group, BMI was higher and usage rate of GP IIb/IIIa inhibitor during the procedure lower in the SES group, and usage rate of cilostazol was lower in the ZES group (Table 1). A comparison of the procedural characteristics demonstrated that the incidence of LM complex lesion and multivessel disease were higher and the total number of stents was greater in the PES group.
Stent length was longer, stent diameter was smaller, and achievement rate of post-procedural TIMI 3 flow was
lower in the SES group. The incidence of complex le- sions was also higher in the ZES group (Table 2).
Twelve-month clinical outcomes
The cumulative MACE rate after 12 months was significantly higher in the ZES group than in the SES group (SES, 10.1%; PES, 12.0%; ZES, 14.8%; p = 0.019).
All causes of death and MI were similar among the three groups (SES, 3.7%; PES, 4.4%; ZES, 5.2%; p = 0.357). The TLR rate was significantly higher in the ZES group than in the SES group (SES, 1.5%; PES, 2.4%;
ZES, 3.9%; p = 0.002). Kaplan-Meier analysis was used to construct crude survival curves during the 12-month follow-up period and the pair-wise long-rank test re- Table 3. Univariate and multivariate analyses of variables associated with major adverse cardiac events
Variable Univariate analysis Multivariate analysis
HR (95% CI)
p valueHR (95% CI)
p valueAge ≥ 65 yr 1.268 (1.023–1.571) 0.030 1.079 (0.841–1.385) 0.551
Male 0.847 (0.691–1.038) 0.110 1.173 (0.886–1.554) 0.265
BMI ≥ 25 kg/m
20.840 (0.684–1.031) 0.096 0.965 (0.932–1.000) 0.051
Hypertension 1.279 (1.048–1.562) 0.016 1.044 (0.828–1.316) 0.715
Diabetes mellitus 1.468 (1.201–1.794) < 0.001 1.302 (1.032–1.643) 0.026
Hyperlipidemia 1.051 (0.755–1.463) 0.767 0.922 (0.625–1.362) 0.684
Prior history of CAD 1.177 (0.907–1.528) 0.220 1.005 (0.741–1.364) 0.973
Smoker 0.794 (0.652–0.966) 0.021 0.831 (0.640–1.079) 0.164
eGFR < 30 mL/min/1.73 m
21.851 (1.417–2.419) < 0.001 1.491 (1.082–2.054) 0.015
Cilostazol 0.962 (0.780–1.188) 0.722 0.909 (0.718–1.152) 0.432
GP IIa/IIIb inhibitor 0.881 (0.658–1.179) 0.393 0.909 (0.656–1.258) 0.563
Left main complex 2.656 (1.726–4.088) < 0.001 2.521 (1.558–4.079) < 0.001
Multivessel 2.051 (1.637–2.570) < 0.001 1.906 (1.464–2.483) < 0.001
Type B2/C lesion
a1.237 (0.978–1.565) 0.076 1.165 (0.886–1.530) 0.274
Post-procedural TIMI flow grade 3
b1.234 (0.816–1.867) 0.319 0.754 (0.481–1.184) 0.220
Stent length ≥ 25 mm 1.131 (0.926–1.379) 0.227 1.125 (0.899–1.408) 0.305
Stent diameter ≤ 2.75 mm 1.143 (0.913–1.432) 0.244 1.023 (0.792–1.320) 0.863
STEMI 1.039 (0.847–1.275) 0.714 1.343 (1.056–1.708) 0.016
SES Reference Reference
PES 1.204 (0.975–1.485) 0.084 1.204 (0.947–1.531) 0.129
ZES 1.498 (1.100–2.028) 0.009 1.604 (1.137–2.262) 0.007
HR, hazard ratio; CI, confidence interval; BMI, body mass index; CAD, coronary artery disease; eGFR, estimated glomerular filtration rate; GP, glycoprotein; TIMI, Thrombolysis in Myocardial Infarction; STEMI, ST-segment elevation myocardial infarction; SES, sirolimus- eluting stent; PES, paclitaxel-eluting stent; ZES, zotarolimus-eluting stent.
a
Type B2/C, the morphology of lesion in coronary angiography was classified according to the criteria of The American College of Cardiology/American Heart Association.
b
Classified according to the TIMI flow grade.
sults for all comparisons are shown in Fig. 1.
Multivariate analysis
In the multivariate analysis, diabetes mellitus, LM complex lesion, multivessel disease, eGFR < 30 mL/
min/1.73 m
2, and STEMI and use of ZES were identified as independent predictors of 12-month MACE (Table 3). In contrast, independent predictors of death after 12 months or MI were age ≥ 65 years, BMI, LM complex lesion, and eGFR < 30 mL/min/1.73 m
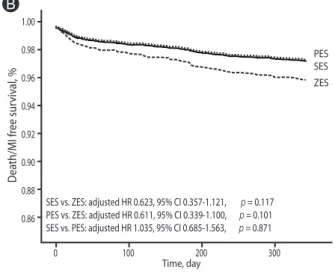
2(Table 4). The independent predictors of 12-month TLR included use of ZES (Table 5). Adjusted survival curves are shown in Fig. 2. The ZES group was associated with a higher incidence of MACE (adjusted HR, 0.623; 95% CI, 0.442 to 0.879; p = 0.007) and TLR than the SES group (ad-
justed HR, 0.350; 95% CI, 0.165 to 0.743; p = 0.006). In addition, being in the ZES group was associated with a higher incidence of TLR than in the PES group (adjusted HR for TLR, 0.471; 95% CI, 0.223 to 0.997; p = 0.049).
DISCUSSION
This study was designed to compare the 12-month clinical outcomes among ZES, SES, and PES in acute MI patients with CKD. Multivariate analyses and Cox regression models showed that ZES was associated with a higher incidence of MACE than SES, and a higher rate of TLR than SES and PES.
In patients with acute MI, primary PCI with stent Table 4. Univariate and multivariate analyses of variables associated with death and myocardial infarction
Variable Univariate analysis Multivariate analysis
HR (95% CI)
p valueHR (95% CI)
p valueAge ≥ 65 yr 3.381 (2.144–5.334) < 0.001 2.761 (1.623–4.696) < 0.001
Male 0.753 (0.541–1.049) 0.093 1.273 (0.790–2.053) 0.322
BMI ≥ 25, kg/m
20.528 (0.364–0.767) 0.001 0.905 (0.850–0.962) 0.002
Hypertension 1.601 (1.141–2.248) 0.006 1.116 (0.744–1.674) 0.595
Diabetes mellitus 1.694 (1.190–2.286) 0.003 1.213 (0.815–1.806) 0.341
Hyperlipidemia 1.644 (1.036–2.610) 0.035 1.456 (0.816–2.600) 0.204
Prior history of CAD 1.474 (0.987–2.202) 0.058 0.915 (0.548–1.527) 0.734
Smoker 0.845 (0.611–1.167) 0.307 1.140 (0.724–1.796) 0.571
eGFR < 30 mL/min/1.73 m
24.132 (2.903–5.881) < 0.001 3.369 (2.177–5.213) < 0.001
Cilostazol 1.120 (0.797–1.574) 0.514 1.164 (0.786–1.723) 0.449
GP IIa/IIIb inhibitor 0.881 (0.544–1.428) 0.607 1.089 (0.625–1.897) 0.763
Left main complex 4.329 (2.444–7.668) < 0.001 3.234 (1.609–6.499) 0.001
Multivessel 1.930 (1.334–2.792) < 0.001 1.410 (0.908–2.189) 0.126
Type B2/C lesion
a1.672 (1.094–2.555) 0.018 1.606 (0.969–2.660) 0.066
Post-procedural TIMI flow grade3
b0.817 (0.480–1.389) 0.732 0.912 (0.396–2.101) 0.829
Stent length ≥ 25 mm 1.124 (0.808–1.563) 0.489 1.041 (0.709–1.527) 0.839
Stent diameter ≤ 2.75 mm 1.531 (1.080–2.172) 0.017 1.283 (0.852–1.931) 0.233
STEMI 0.815 (0.587–1.132) 0.222 1.185 (0.791–1.774) 0.411
SES Reference Reference
PES 1.185 (0.838–1.675) 0.337 0.966 (0.640–1.460) 0.871
ZES 1.404 (0.845–2.334) 0.190 1.581 (0.892–2.802) 0.117
HR, hazard ratio; CI, confidence interval; BMI, body mass index; CAD, coronary artery disease; eGFR, estimated glomerular filtration rate; GP, glycoprotein; TIMI, Thrombolysis in Myocardial Infarction; STEMI, ST-segment elevation myocardial infarction; SES, sirolimus- eluting stent; PES, paclitaxel-eluting stent; ZES, zotarolimus-eluting stent.
a
Type B2/C, the morphology of lesion in coronary angiography was classified according to the criteria of The American College of Cardiology/American Heart Association.
b
Classified according to the TIMI flow grade.
implantation is considered to be the gold standard in treatment for acute MI [1]. Although PCI with stent implantation is performed in increasing numbers of pa- tients, in-stent restenosis is an important complication.
Studies of patients with acute MI treated with BMS have reported the incidence of repeated revascularization to be about 10% [2,3]. Most suggested that DES was as- sociated with a lower restenosis and TLR rate compared with BMS [2-4]. The data reported here support the use of DES in acute MI since the TLR rate for all types of DES was 2.1%.
CKD patients are known to be a high-risk popula- tion for coronary artery disease. Cardiovascular events, especially related to coronary artery disease, remain the main cause of mortality among patients with CKD
[9,10]. Furthermore, the presence of CKD increases the risk of mortality after PCI even before end-stage renal disease and dialysis dependency have developed [20].
In support of this, an eGFR < 30 mL/min/1.73 m
2in the current study was a significant independent predictor of MACE, MI, or death after 12 months.
A concern following DES implantation in acute MI pa- tients is that vessel healing at the primary pathological site is delayed compared with in stable angina patients, which results in an increased risk of thrombotic compli- cations [5]. ZES, which is second-generation DES and is based on a different type of polymer, is closer to BMS than first-generation DES. ZES implantation is associ- ated with less inflammation and greater endothelializa- tion [8], and preserved endothelial vasomotor response Table 5. Univariate and multivariate analyses of variables associated with target lesion revascularization
Variable Univariate analysis Multivariate analysis
HR (95% CI)
p valueHR (95% CI)
p valueAge ≥ 65 yr 0.823 (0.632–1.070) 0.146 0.809 (0.452–1.447) 0.475
Male 0.951 (0.728–1.243) 0.713 1.095 (0.533–2.249) 0.806
BMI ≥ 25, kg/m
21.100 (0.853–1.420) 0.462 0.941 (0.859–1.030) 0.185
Hypertension 1.186 (0.918–1.531) 0.191 1.088 (0.621–1.906) 0.768
Diabetes mellitus 1.376 (1.060–1.785) 0.017 1.578 (0.905–2.751) 0.108
Hyperlipidemia 0.800 (0.495–1.294) 0.363 0.992 (0.387–2.539) 0.986
Prior history of CAD 1.045 (0.736–1.483) 0.807 0.826 (0.366–1.864) 0.645
Smoker 0.798 (0.619–1.027) 0.080 1.076 (0.562–2.058) 0.826
eGFR < 30 mL/min/1.73 m
20.859 (0.538–1.373) 0.526 0.489 (0.147–1.619) 0.241
Cilostazol 0.896 (0.681–1.178) 0.430 0.968 (0.549–1.705) 0.910
GP IIa/IIIb inhibitor 0.915 (0.630–1.328) 0.640 1.441 (0.756–2.746) 0.267
Left main complex 1.647 (0.813–3.337) 0.166 2.044 (0.613–6.815) 0.244
Multivessel 2.060 (1.538–2.759) < 0.001 1.058 (0.564–1.984) 0.860
Type B2/C lesion
a1.024 (0.767–1.368) 0.871 0.630 (0.354–1.121) 0.116
Post-procedural TIMI flow grade 3
b0.801 (0.474–1.353) 0.407 0.578 (0.204–1.637) 0.302
Stent length ≥ 25 mm 1.145 (0.886–1.478) 0.300 1.244 (0.717–2.159) 0.437
Stent diameter ≤ 2.75 mm 0.971 (0.717–1.314) 0.850 0.936 (0.586–1.802) 0.843
STEMI 1.164 (0.889–1.524) 0.270 0.929 (0.529–1.630) 0.797
SES Reference Reference
PES 1.280 (0.978–1.675) 0.073 1.346 (0.730–2.480) 0.341
ZES 1.472 (0.988–2.192) 0.057 2.875 (1.346–6.065) 0.006
HR, hazard ratio; CI, confidence interval; BMI, body mass index; CAD, coronary artery disease; eGFR, estimated glomerular filtration rate; GP, glycoprotein; TIMI, Thrombolysis in Myocardial Infarction; STEMI, ST-segment elevation myocardial infarction; SES, sirolimus- eluting stent; PES, paclitaxel-eluting stent; ZES, zotarolimus-eluting stent.
a
Type B2/C, the morphology of lesion in coronary angiography was classified according to the criteria of The American College of Cardiology/American Heart Association.
b
Classified according to the TIMI flow grade.
compared with first-generation DES [7]. The clinical outcomes of ZES treatment in acute MI patients are not significantly different than those of first-generation DES [21-23], and the use of ZES results in a lower risk of stent thrombosis [21]. In patients with CKD, DES significantly reduces clinical, angiographic restenosis compared with BMS [11,12], but there is no data com- paring the different types of DES. In this study, we have determined that ZES promotes vessel healing and en- dothelial function compared to first-generation DES in acute MI. However, excessive neointimal proliferation might increase the TLR rate of ZES patients compared with first-generation DES. When taken together, par- ticularly in acute MI patients who have CKD as comor- bid disease, the disadvantages of ZES may outweigh the advantages. In fact, the present data demonstrate that the higher incidence of MACE in the ZES group, as
compared with the SES and PES groups, is due mainly to a higher incidence of TLR and not to death or MI.
However, TLR rates were around 2% and much lower than before, even though ZES was statistically inferior to the other stents in terms of TLR. Thus, the biological applicability of this result remains to be established.
Limitations
This is the first study based on observational registry data. We used Cox regression analysis to correct for confounding factors, but the results may be influenced by the nonrandomized assignment. Additionally, this registry does not record information concerning hemo- dialysis, so it was not possible to separate hemodialysis from non-hemodialysis patients. Recent studies have also shown that DES may be associated with increased rates of stent thrombosis, as compared with BMS
SES vs. ZES: adjusted HR 0.623, 95% CI 0.357-1.121, p = 0.117 PES vs. ZES: adjusted HR 0.611, 95% CI 0.339-1.100, p = 0.101 SES vs. PES: adjusted HR 1.035, 95% CI 0.685-1.563, p = 0.871
SES PES
ZES
Time, day 1.00
0.98
0.96
0.94
0.92
0.90
0.88
0.86
0 100 200 300
Death/MI free survival, %
SES vs. ZES: adjusted HR 0.623, 95% CI 0.442-0.879, p = 0.007 PES vs. ZES: adjusted HR 0.751, 95% CI 0.529-1.065, p = 0.109 SES vs. PES: adjusted HR 0.831, 95% CI 0.632-1.056, p = 0.129
SES PES
ZES
Time, day 1.00
0.98
0.96 0.94
0.92 0.90
0.88 0.86
0 100 200 300
MACE free survival, %
SES vs. ZES: adjusted HR 0.350, 95% CI 0.165-0.743, p = 0.006 PES vs. ZES: adjusted HR 0.471, 95% CI 0.223-0.997, p = 0.049 SES vs. PES: adjusted HR 0.743, 95% CI 0.403-1/370, p = 0.341
SES PES
ZES
Time, day 1.00
0.98
0.96
0.94
0.92
0.90
0.88
0.86
0 100 200 300
TLR free survival, %
Figure 2. Adjusted 12-month Kaplan-Meier survival analysis