Print ISSN: 2288-4637 / Online ISSN 2288-4645 doi:10.13106/jafeb.2021.vol8.no1.385
Factors Impacting Tourism Demand: An Analysis of 10 ASEAN Countries
Lien Phuong NGUYEN1, Ha Thu NGUYEN2
Received: September 30, 2020 Revised: November 22, 2020 Accepted: December 05, 2020
Abstract
This study investigates the effect of infrastructure, economic sectors and its status, foreign direct investment and private investment, as well as the role of political stability in enhancing the tourism demand in the ASEAN region. The research collected the secondary data from the World Bank database and the UNWTO website of 10 ASEAN countries over 17 years from 2000 to 2016. Applying the generalized method of moments, this research found that, “private investment”, “economic sectors”, “exchange rate and infrastructure measured by “using of the internet” can increase the tourism demand of a country in the ASEAN region. This research provided evidence indicating that the “foreign direct investment”
and “inflation” are two detrimental factors for tourist attraction. The major finding confirmed the positive role of “political stability” in increasing tourist arrivals. First, attracting tourists to a country always poses many challenges to its government. It has been observed in the past decades that though there were many documents, which confirmed that industry can help in promoting tourism, very few studies investigated the role of both agriculture and manufacturing sectors in tourism promotion. Secondly, there are only a few studies which verifies the stability of the political system to the tourism demand in the ASEAN region and that this variable (political stability) has the strongest impact.
Keywords: Tourism, ASEAN, GMM Model JEL Classification Code: Z30, R00, C23
that leads the economic growth, thus this topic attracts researchers around the world.
We know that tourism is a crucial sector for developing countries, which enhances their economic outcome (see Figure 1). Abel and Roux (2017) argue that tourism could help government expand business opportunities, maintain stable employment, and provide a better condition of communication with their residents. Most of the previous researchers have investigated how tourism affects an economy; only a few studies show the ways to increase tourism capacity. At that moment, the determinants of tourism demand were a big challenge for researchers.
Furthermore, forecasting is essential for all industries, including the tourism industry. For developing economic policies, governments require information related to determinants of tourism demand (Li et al., 2020). Tourism is a complex industry that relates to different industries (Foris, 2014). As there is little literature available which explore the factors that leads to an increase in tourism demand in ASEAN countries since 2000s, this paper aims to investigate the factors that contribute to tourists attraction in ASEAN countries. Unlike the previous papers, this study determines the tourism demand depends on variables of macroeconomic factors and political stability.
1 First Author and Corresponding Author. Lecturer, Department of Business Administration, Van Lang University, Ho Chi Minh City, Viet Nam [Postal Address: 45 Nguyen Khac Nhu Street, Co Giang Ward, District 1, Ho Chi Minh City, 70000, Viet Nam]
Email: [email protected]
2 Lecturer, Department of Business Administration, Van Lang University, Ho Chi Minh City, Viet Nam. Email: [email protected]
© Copyright: The Author(s)
This is an Open Access article distributed under the terms of the Creative Commons Attribution Non-Commercial License (https://creativecommons.org/licenses/by-nc/4.0/) which permits unrestricted non-commercial use, distribution, and reproduction in any medium, provided the original work is properly cited.
1. Introduction
To define the impact factors on tourism demand plays
an important part in the promotion of its economic outcome
owing to the following reasons: Firstly, tourism is an
industry that can support poverty reduction in the developing
countries and bring opportunities for enhancing the image
of the country (World Bank, 2006). Secondly, tourism can
generate a higher benefit than trade in developing countries
(Culiuc, 2014). UNWTO (2019) reports tourism contributes
29 per cent of the global service export in 2019. Furthermore,
Ribeiro and Wang, (2020) confirm that tourism is an engine
The meanings of these variables and the reasons for choosing them will be presented in the methodology section.
Besides, in the introduction part, this study is structured by four remain sections, such as brief of literature review, methods and data, empirical findings and discussion and the last section-a conclusion, limitation and future research.
Figure 1 illustrates that there is a close linear relationship between tourism and economic growth in the first group of ASEAN countries, which gains the GDP per capita under the 10 thousand US dollars per year. The second group of these countries, which retains the higher income and raises a non- linear relationship with tourism.
2. Literature Review
Cengizci et al. (2020) provide the evidence of the motivation factors that results in 13 percent more demand for tourism, such as hotel service, natural and cultural attractions and accessibility and security, etc. Ranasinghe and Li (2017) confirmed that the Government has to invest in developing tourism service and facilities as well as in education to attract tourist arrivals.
Li et al. (2020) apply the case study to develop the tourism demand forecasting model and confirm that tourism demand prediction is an important task for its complex decision- making. A few previous researchers noted that the weather conditions, the seasons and the type of the day work as proxies on the intention of tourism. O’Lemmon (2017) also notes that tourism brings much needed dollars for Vietnam’s developing society. The factors that can accelerate tourism demand in the country are Vietnamese food, beaches, and shopping.
Some previous authors noted that demographic variables include characteristics such as unemployment status and diseases. These two vulnerable factors prevent tourists when choosing a travel destination by two reasons. Firstly, almost all tourists fear diseases and pandemic, and secondly, the Government allows only tourists who have received vaccine or safety certification can arrive in their countries (Reno et al., 2020). While Rohman (2020) states that in Indonesia, the demography does not influence tourists’ loyalty. Tatem et al.
(2006) have also highlighted that the Government should be aware of the seriousness of infectious diseases that may enter through the global transportation network to effectively prevent them in, this is important to easily attract growing global tourists. Wamboye et al. (2020) studied the case in Tanzania and suggested that the Government and stakeholders in this country should focus on enhancing the infrastructure, reducing living cost as well as controlling exchange rate to promote tourism demand. To sum up, the summary of determinants of tourism and its impact on the economies can be divided into several groups as seen below:
Firstly, some previous researchers argue that macro- economic factors have both positive and negative impact on tourism demand. The following variables such as “exchange rate” (Chi, 2020; Irandoust, 2019; Dincer et al., 2015),
“foreign direct investment” (Snieška et al., 2014; Endo, 2006), “economic sector” (Agiomirgianakis et al., 2018;
Hüller et al., 2017),“household debt and household income”, (Yap & Allen, 2011; Allen et al., 2009),“transportation cost”,
“consumer price index”, and “cost of accommodation” are unfavourable and favourable factors relevant in attracting tourists while microeconomic factors such as: food, beaches, and shopping opportunities are beneficial factors that impact the decision making of tourists (Wamboye et al., 2020;
O’Lemmon, 2017; Macneill & Wozniak, 2018; Markus et al., 2019). Prayag (2020) has also noted the necessary role of macroeconomics factors for tourism resilience research. Furthermore, Alegre et al. (2018) confirm that unemployment in European countries negatively affects an individual’s probability to make a decision for a vacation.
Secondly, some previous authors have confirmed the supply-side proxies that always have a positive effect on tourism demand and re-visiting of destination, some of these are infrastructure, information technology, means of transportation, tourism and health care services, and tourism facilities (Agiomirgianakis et al., 2018; Navío-marco et al., 2018; Ranasinghe & Li, 2017; Xiang et al., 2015).
Thirdly, some researchers have confirmed that the government and political stability is an important factor in attracting tourist arrivals. Foris (2014) verifies that a political-administrative analysis provides a new approach that considers the relationship between Government policy and tourism. Political ecology is a dominant factor that drives tourism demand because of its relationship with
Figure 1: The linkage between tourism’s demand andeconomic growth
Source: Author’s illustration from World Bank’s database
social and economic variables (Knowles, 2019). Kim et al.
(2007) note that the Government in Korea imposes and commands the people’s views and perspective, that leads to a decease in the demand of tourism. Furthermore, Ghalia et al. (2019) have shown that the political instability is one of the reasons that poses difficulty in attracting tourists.
While Than et al. (2020) indicate that socioeconomic stability has a high positive relation with destination choice of tourists. Moreover, residents of a county act when the Government promptly issues some policies in order to respond quickly with the disease or an epidemic, which results in tourists going ahead with booking their tours (Fong et al., 2020; Nunkoo & Smith, 2013; Veréb et al., 2020).
To sum up literature review, we learn that most of the previous studies focus on the OECD region and African countries, and a few studies in the ASEAN region. The previous findings can be summarized in Table 1 (See
Table 1). Table 1 indicates that previous studies confirm the complex role of “exchange rate”, and “political stability” in attracting travelers from all over the world. These findings raise the need to further examine the effect of this variable on tourism demand in ASEAN countries.
Table 2 shows that most of the authors apply the survey questionnaire, and then analyze it through the CFA or SEM model to verify the relationship between impact factors and tourism demand. Some researchers use the secondary data and measure the effect on tourists’ choice by using the PLS, OLS, and FGLS model. Furthermore, of all these studies, only one study applies to the dynamic panel data to estimate coefficients of factors affecting tourism demand. Some researchers apply the qualitative method to conduct their studies through focus group discussion or expert interview in a single country. Some researchers apply co-integration test or Granger test to explore the relationship between economic factors and tourism (See Table 2).
Table 1: Summary of tourism determination
Levels of Effect Macroeconomic factors Microeconomic factors Government stability
Negative - Exchange rate
- Inflation - CPI
Positive
- Exchange rate
- Using internet of traveler - Agri-food products - FDI
- Trade openness - Private investment - Socioeconomic stability
-Tourism facilities -Tourism service - Low cost of living
- Government policies - Government expenditure - Political ecology
- Political administrative
Neutral -Exchange rate Geographic - Political and Government stability
Table 2: Summary of applied method to determine tourism demand
Research Method or model Authors applied
Primary data In-depth interview Survey
Kim, Timothy, and Han (2007); Nunkoo and Smith (2013);
O’Lemmon (2017); Ranasinghe and Li (2017)
Kim Macneill and Wozniak (2018); Markus et al (2019); Than et al.
(2020); Cengizci et al (2020); Veréb et al. (2020)
Review Foris (2014); Xiang et al (2015); Nawaz and Hassan (2016);
Knowles, (2019) - Secondary data
- Granger causality model, - Fixed effects (FE) model, - MA / ARIMA model - Gravity model,
- Haussmann- Taylor model - GARCH Model
- Generalized methods of moment model (GMM)
Yap and Allen (2011); Culiuc (2014); Dincer et al (2015); Endo (2016); Hüller et al (2017); Irandoust (2019); Ghalia, Fidrmuc, Samargandi, and Sohag (2019); Wamboye et al. (2020); Li et al.
(2020); Chi (2020)
3. Methodology 3.1. Research Method
To define the tourism demand, Lim (1997) makes a critical review from 56 previous articles, positing that most of the previous researchers applied the specific model, and then confirmed that tourism demand depends on exchange rate, transportation costs, the stability of market prices, and the income of a country. Wamboye et al. (2020) expanded this model by complementing ‘infrastructure’ and ‘consumer price index’ which provided evidence and then certified that a country’s infrastructure plays an important role in tourism enhancing in Tanzania. Ghalia et al. (2019) applied the expanded Gravity model to test the role of political and Government stability in tourism demand. To achieve the research objectives, this paper summarizes the previous models as seen below:
, = 0 + , , + ', , + ,,... , ≠0
i t i t i t i t i t i t i t
Y β β MI β X ε β
, (1)
Where Y
i,tdenotes the international tourism demand; MA
i,tand MI
i,trepresent the macroeconomic and microeconomic vectors. X
i,tpresents the control proxiers.
To follow the models of Prayag, (2020) as well as Wamboye et al. (2020), Ghalia, et al. (2019) and Culiuc (2014), the paper designs the research model (see eq. 2)
, 0 1 , 2 , 3 ,
4 , 5 , 6 ,
7 , 8 , ,
= + + +
+ + +
+ + +
i t i t i t i t
i t i t i t
i t i t i t
ITA FDI PI EXR
IFR MFA AGR
IUI PS
γ γ γ γ
γ γ γ
γ γ µ
(2)
2; ; ; ;3 5 7 8 >0;
γ γ γ γ γ
and:
γ γ γ1; ;4 6 < 0- ITA
i,t= International tourists refer to the number of arrivals of country i at time t.
- FDI
i,t= Foreign direct investment, net inflows (% of GDP) of country i at time t.
“FDI” and “PI” are two factors that indicate the capability of an economy.
- PI
i,t= Private investment (% of GDP at current market prices) of country i at time t.
- EXR
i,t= Exchange rate - Average of the period of country i at time t. This variable presents the stability of the country’s forex market.
- IFR
i,t= Inflation, consumer prices (% annually) of country i at time t. The variable represents the status of the economy.
- MFA
i,t= Manufacturing value added (% of GDP) of country i at time t.
- AGR= Agriculture value added (% of GDP)
“AGR” and “MFA” are two variables that represent the economic structure.
- IUI
i,t= Individuals using the Internet (% of population) of country i at time t. The variable represents infrastructure of the economy.
- PS = Political Stability and Absence of Violence (PS) (Index, range from -2.5 to 2.5)
This paper uses the secondary panel data from 10 ASEAN countries over 17-year period from 2000 to 2016 and collects the “exchange rate” data from the ADB library, the data of “International tourists’ arrivals” from the UNWTO’s database, and the other data from the World Bank’s database (See Table 3).
3.2. Research Data
Table 3 shows that Thailand is the country that attracts the most number of tourists. However, Singapore is the country with the highest foreign direct investment as well as domestic investment. Brunei is the country with the highest percentage of internet users but it is in the lowest position for other indicators, including tourist attraction, exchange rate, private investment, and inflation. Table 3 further shows us that it is necessary to consider how macroeconomic variables affect the tourism demand in countries of this region.
The panel data with small N and short T, as well as endogeneity cause inconsistency of the usual OLS estimates, and thus requires instrumental variable (IV) methods like two-stage least squares (2SLS) to obtain consistent parameter estimates (Baltagi, 2005). This study applies the panel 2SLS model that is concerned with small and short panel for evaluating the determinants of tourism in ASEAN countries with endogenous phenomenon. To clarify the empirical model’s certainty, this study continues to conduct the Cross-sectional time-series regression by The Feasible Generalized Least Square (FGLS) as well as Generalized Method of Moments (GMM) regression for checking the results of estimation (Greene, 2012). For the least bias from regression, this study also takes logarithm of the factor “ITA- International tourists refer to the number of arrivals”; The empirical equation will be:
, 0 1 , 2 , 3 ,
4 , 5 , 6 ,
7 , 8 , ,,
= + + +
+ + +
+ + +
i t i t i t i t
i t i t i t
i t i t i t
Lita FDI PI EXR
IFR MFA AGR
IUI PS
γ γ γ γ
γ γ γ
γ γ µ
(3)
3.3. Hypotheses
Based on the above argument, this study develops the below hypotheses:
H1: γ γ γ γ γ2; ; ; ;3 5 7 8>0
:
The following variables:Private investment, exchange rate, manufacturing value, infrastrucutre and political stability are positive factors that affect tourism demand.
H2: γ γ γ1; ;4 6<0
: The foreign direct investment,
Inflation rate, and agricultural sector have a negative impact on Tourism demand.4. Empirical Results and Discussion
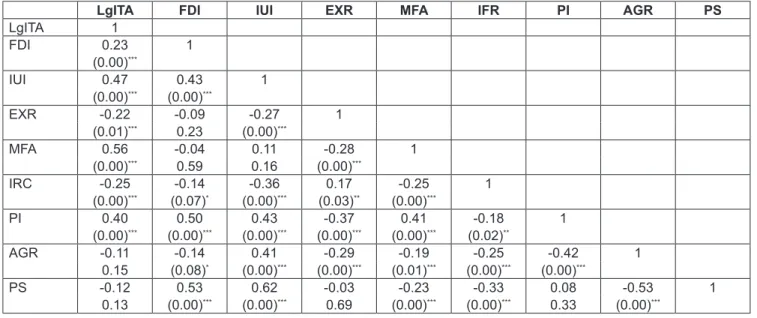
Before processing the equation 3, this study checks the correlation between the dependent variable and the independent variables (see Table 4).
Sources: World Development Indicators, Worldwide Governance Indicators, and Paying Taxes index
Table 4 shows the close linkage between tourism and other remaining variables. To protect the bias from autocorrelation, this study runs the VIF test and obtains the results that support the confirmation of no autocorrelations among independent factors. In this case, the VIF should be 1/( 1-0.952 ) = 10.256. A rule of thumb is that if VIF>10, then the multicollinearity is high (Hair et al., 2014; Nguyen
& Pham, 2020). The mean VIF coefficient in the model is 2.43 and it is smaller than 10. The VIF test result provides an evidence to confirm that there does not exist the multicorelation.
Table 5 shows the evidence of positive role of only three factors: the average exchange rate (EXR); infrastructure:
individual using internet (IUI), and both the economic sectors: a part of major economic structure is manufacturing (MFA) and the agricultural sector (AGR). This table also
provides the evidence that foreign direct investment inflow and inflation rate represent the stability of a market and are detrimental factors for raising tourism demand. While private investment can attract the tourists’ arrivals, the most important finding is the role of political stablity that has the highest positive effect on tourism.
Unlike Tanzania and African countries, in ASEAN region, the exchange rate is a beneficial factor in increasing tourism. This finding also supports the recommendation from Wamboye et al., (2020). Infrastructure and the major components of economic sectors are both manufacturing and agriculture can increase the tourism demand. Two major factors: private investment and stability of the politic system have a strong positive effect on tourism. The paper summarizes the supporting hypotheses as seen as below:
The hypothesis H1: γ γ γ γ γ2; ; ; ; >3 5 7 8 0
- PI (γ
2) = 0.12> 0 significance at 1% → Accepted - EXR (γ
3) = = 0.0001 > 0 significance
at 1% → Accepted
- MFA (γ
5) = 0.17 > 0 significance at 1% → Accepted - IUI (γ
7) = 0.03 >0 significance at 1% → Accepted - PS (γ
8) = 0.63 >0 significance at 10% → Accepted
The hypothesis H2: γ γ γ1; ; >4 6 0- FDI (γ
1) = – 0.20 <0 significance at 5% → Accepted - IFR (γ
4) = – 0.02 < 0 not significance → Accepted - AGR (γ
6) = 0.1 > 0 significance at 1% → Rejected
Table 3: Summary Description of VariablesVariable Obs Mean Std. Dev. Min Max
International Tourist (ITA –
number of arrivals) 170 6651553.00 7382374.00 119,000.00
Brunei (2004) 33,000,000.00 Thailand (2016) Foreign direct investment net
inflows (FDI ) (% of GDP) 170 5.07 5.55 -2.76
Indonesia (2000) 26.33
Singapore (2006) Individuals using the Internet
(IUI) (% of population) 170 24.94 24.78 0.0002
Myanmar (2001) 90.00
Brunei (2006) Exchange rate - Average of
period(EXR) 170 4115.86 5968.22 1.25
Brunei and Singapore (2012-13)
21,935.00 Viet Nam (2016) Private Investment (PI) (% of
GDP at current market prices) 170 45.62 10.25 25.25
Brunei (2008) 70.76
Singapore (2013) Inflation, consumer prices
(IFR) (annual %) 170 5.13 7.23 -2.31
Brunei (2002) 57.07
Myanmar (2002) Manufacturing, value added
(% of GDP) (MFA) 170 19.72 6.46 7.16
Myanmar (2000) 31.95
Indonesia (2002) Agriculture, value added (% of
GDP) (AGR) 170 16.31 12.99 0.03
Singapore (2016) 57.24
Myanmar (2000) Political Stability and Absence
of Violence (PS) (Index, range
from -2.5 to 2.5) 170 -0.20 0.95 -2.09
Indonesia (2003) 1.50
Singapore (2016) Sources: World Development Indicators, ADB’s database, and UNWTO.
Table 4: Correlation Matrix
LgITA FDI IUI EXR MFA IFR PI AGR PS
LgITA 1
FDI 0.23 1
(0.00)***
IUI 0.47 0.43 1
(0.00)*** (0.00)***
EXR -0.22 -0.09 -0.27 1
(0.01)*** 0.23 (0.00)***
MFA 0.56 -0.04 0.11 -0.28 1
(0.00)*** 0.59 0.16 (0.00)***
IRC -0.25 -0.14 -0.36 0.17 -0.25 1
(0.00)*** (0.07)* (0.00)*** (0.03)** (0.00)***
PI 0.40 0.50 0.43 -0.37 0.41 -0.18 1
(0.00)*** (0.00)*** (0.00)*** (0.00)*** (0.00)*** (0.02)**
AGR -0.11 -0.14 0.41 -0.29 -0.19 -0.25 -0.42 1
0.15 (0.08)* (0.00)*** (0.00)*** (0.01)*** (0.00)*** (0.00)***
PS -0.12 0.53 0.62 -0.03 -0.23 -0.33 0.08 -0.53 1
0.13 (0.00)*** (0.00)*** 0.69 (0.00)*** (0.00)*** 0.33 (0.00)***
Note: * p <0., ** p < 0.05 and *** p < 0.01.
Table 5: analysis results
Variables 2SLS GMM FGLS
Coef.
Std. Err. Computed z
Statistic* Coef.
Std. Err. Computed t
statistic* Coef.
Std. Err. Computed t statistic* Dependent variable: ITA Dependent variable: ITA Dependent variable: ITA
FDI – 0.20
(0.09) –2.30
(0.02)** – 0.21
(0.11) –1.92
(0.06)** – 0.02
(0.08) –2.37
(0.02)**
PI 0.12
(0.03) 4.09
(0.00)*** 0.12
(0.04) 3.40
(0.00)*** 0.12
(0.03) 4.21
(0.00)***
EXR 0.0001
(0.00) 5.92
(0.00)*** 0.0001
(0.00) 5.92
(0.00)*** 0.0001
(0.00) 6.10
(0.00)***
IFR – 0.02
(0.02) –1.08
(0.28) – 0.02
(0.02) –1.05
(0.29) – 0.02
(0.02) –1.11
(0.27)
MFA 0.17
(0.02) 8.52
(0.00)*** 0.17
(0.02) 8.40
(0.00)*** 0.17
(0.02) 8.77
(0.00)***
AGR 0.10
(0.02) 4.13
(0.00)*** 0.10
(0.03) 3.58
(0.00)*** 0.10
(0.02) 4.25
(0.00)***
IUI 0.03
(0.01) 5.67
(0.00)*** 0.03
(0.01) 5.54
(0.00)*** 0.03
(0.01) 5.84
(0.00)***
PS 0.63
(0.37) 1.70
(0.09)* 0.68
(0.46) 1.48
(0.14)* 0.63
(0.36) 1.75
(0.08)*
_cons 4.47
(1.38) 3.23
(0.00)*** 4.29
(1.68) 2.56
(0.01)*** 4.47
(1.34) 3.33
(0.01)***
Number of
observation 162 162 162
R2
Adj R-squared
0.48 0.45
0.47 NA
0.47 Root MSE/ NA
Wald chi2(8) 1.09
NA 1.07
352.09 1.07
235.69
Prob>chi2 0.000 0.000 0.000
Z statistics in parentheses: *p< 0.1, **p< 0.05, ***p< 0.01
Unlike recommendation of Wamboye et al. (2020) for Tanzania, this study provides the evidence of three useful factors that are being strength of tourism in ASEAN countries such as exchange rate, using internet and major components of economic structure is both manufacturing and agricultural.
Nevertheless, inflation rate has the same coefficient of effect on tourism as stated above researchers. The study confirms that other harmful effect of the foreign direct investment on demand for tourist.
5. Conclusions
There are two major limitations of this paper: Firstly, this study does not investigate the reason why both manufacturing and agriculture sectors can attract more tourists. Secondly, due to the limitation of the collected data, this research does not compare the travelers of the origin countries with the destinations. For future research, this study should try to find out the answer for the positive role of both MFA and AGR variables. In future, the study should expand the collection of data to compare the origin countries with the destination countries and investigate more deeply the drivers that lead to an increase in tourism in the region.
Tourism is a crucial proxy that promotes each economy all over the world. The paper applies 2SLS model and performs robustness check by GMM and FGLS methods to measure the factors affecting tourism. The findings show that the success factors that drive the tourism in ASEAN region are control of financial market: (EXR) exchange rate and private investment (PI). The following factors also attract more tourists: infrastructure factor: (IUI) “using internet”
variable, both economic sectors such as “manufacturing”
(MFA) and producing agricultural products (AGR) and
“Political stability” variables.
However, the unstable economic condition represented by inflation rate (IFR) and foreign direct investment (FDI) that are two harmful factors, which reduce the number of tourists visiting countries. To increase tourism capability, the Governments in ASEAN countries should reduce the slight value of their domestic currency by increasing the exchange rate, promptly issue appropriate policies that promote private investment. Besides that, they should encourage their residents using internet popularly, every day to raise the ratio of individuals using internet with appropriate costs as well as develop manufacturing and producing agricultural goods in their economies. The most important thing is that these Governments attempt to maintain the stability of political system to attract more tourists. At the same time, the Government in ASEAN countries should also control inflation rate and handle foreign direct investment.
References
Abel, S., & Roux, P. L. (2017). Tourism an engine of wealth creation in Zimbabwe. International Journal of Economics and Financial Issues, 7(2), 129–137.
Agiomirgianakis, G., Bertsatos, G., & Tsounis, N. (2018).
Asymmetric responses in the tourism demand function. The Journal of Economic Asymmetries, 18(2018), e00103. https://
doi.org/10.1016/j.jeca.2018.e00103
Allen, D., Yap, G., & Shareef, R. (2009). Modelling interstate tourism demand in Australia : A cointegration approach.
Mathematics and Computers in Simulation, 79(2009), 2733–2740. https://doi.org/10.1016/j.matcom.2008.10.006.
Baltagi, B. H. (2005). Econometric Analysis of Panel Data (3rd ed.). West Sussex, UK: John Wiley & Sons, Ltd.
Cengizci, A. D., BaŞer, G., & Karasakal, S. (2020). Exploring push and pull motivations of Russian tourists to Turkey. Tourism Review International, 24(2), 127-141. https://doi.org/10.3727 /154427220X15912253254419.
Chi, J. (2020). The impact of third-country exchange rate risk on international air travel flows : The case of Korean outbound tourism demand. Transport Policy, (January). https://doi.
org/10.1016/j.tranpol.2020.01.012
Culiuc, A. (2014). Determinants of International Tourism. IMF Working Paper No. WP/14/82. https://doi.org/10.5089/978148 4383032.001.
Dincer, Z. M., Dincer, I. F., & Ustaoglu, M. (2015). Reel effective exchange rate volatilities impact on tourism sector in Turkey : An empirical analysis of 2003-2014. In: 2nd GlobalConfrence on Business, Economics, management and Tourism (Vol.
23, pp. 1000–1008). 30-31 October 2014, Prague, Czech Republic. Prague: Elsevier B.V. https://doi.org/10.1016/S2212- 5671(15)00352-4.
Donohoe, H., Pennington-Gray, L., & Omodior, O. (2015). Lyme disease: Current issues, implications, and recommendations for tourism management. Tourism Management, 46(2015), 408–418. https://doi.org/10.1016/j.tourman.2014.07.006.
Endo, K. (2006). Foreign direct investment in tourism — flows and volumes. Tourism Management, 27(2006), 600–614. https://
doi.org/10.1016/j.tourman.2005.02.004
Fong, L. H. N., Law, R., & Ye, B. H. (2020). Outlook of tourism recovery amid an epidemic: Importance of outbreak control by the government. Annals of Tourism Research, 102951. https://
doi.org/10.1016/j.annals.2020.102951.
Foris, D. (2014). Study regarding a new dimension of tourism phenomenon – the political - administrative dimension.
Procedia - Social and Behavioral Sciences, 143, 1078–1082.
https://doi.org/10.1016/j.sbspro.2014.07.559.
Ghalia, T., Fidrmuc, J., Samargandi, N., & Sohag, K. (2019).
Institutional quality , political risk and tourism. Tourism Management Perspectives, 32(2019), 100576. https://doi.
org/10.1016/j.tmp.2019.100576.
Greene, W. H. (2012). Econometric Analysis (7th ed.). Upper Saddle River, NJ: Prentice Hall.
Hair, J. F., Black, B., Babin, B. J., & Anderson, R. E. (2014).
Multivariate Data Analysis. London, UK: Pearson Education Hüller, S., Heiny, J., & Leonh€auser, I.-U. (2017). Linking
agricultural food production and rural tourism in the Kazbegi district - A qualitative study. Annals of Agrarian Science, 15(2017), 40–48. https://doi.org/10.1016/j.aasci.2017.02.004.
Irandoust, M. (2019). On the relation between exchange rates and tourism demand : A nonlinear and asymmetric analysis. The Journal of Economic Asymmetries, 20(2019), 1–10. https://doi.
org/10.1016/j.jeca.2019.e00123
Joaquín Alegre, LlorençPou& Maria Sard (2018): High unemployment and tourism participation. Current Issues in Tourism, https://doi.org/10.1080/13683500.2018.1464550.
Kim, S. S., Timothy, D. J., & Han, H. C. (2007). Tourism and political ideologies: A case of tourism in North Korea. Tourism Management, 28(2007), 1031–1043. https://doi.org/10.1016/j.
tourman.2006.08.005.
Knowles, N. L. B. (2019). Targeting sustainable outcomes with adventure tourism : A political ecology approach.
Annals of Tourism Research. https://doi.org/10.1016/j.
annals.2019.102809.
Li, C., Ge, P., Liu, Z., & Zheng, W. (2020). Forecasting tourist arrivals using denoising and potential factors. Annals of Tourism Research, 83(2020), 102943. https://doi.org/10.1016/j.
annals.2020.102943.
Lim, C. (1997). Review of international tourism demand models.
Annals of Tourism Research, 24(4), 835–849.
Macneill, T., & Wozniak, D. (2018). The economic, social, and environmental impacts of cruise tourism. Tourism Management, 66(2018), 387–404. https://doi.org/10.1016/j.
tourman.2017.11.002.
Markus, Z., Perovic, D., Pekovic, S., & Popovic, S. (2019).
Assessing tourist revisit intention through the sports and recreational services offered. Business Systems Research, 10(2), 141–150. https://doi.org/10.2478/bsrj-2019-023.
Navío-marco, J., Ruiz-gómez, L. M., & Sevilla-sevilla, C. (2018).
Progress in information technology and tourism management : 30 years on and 20 years after the internet - revisiting Buhalis & Law’s landmark study about eTourism. Tourism Management, 69(2018), 460–470. https://doi.org/10.1016/j.
tourman.2018.06.002.
Nawaz, M. A., & Hassan. (2016). Investment and tourism : Insights from the literature. International Journal of Economic Perspectives, 10(4), 581–590.
Nguyen, L. P., & Pham, V. H. T. (2020). Trade of ICT products, government , and economic growth : Evidence from East Asia- Pacific region. Journal of Asian Finance, Economics and Business, 7(8), 175–183. https://doi.org/10.13106/jafeb.2020.vol7.no8.175.
O’Lemmon, M. (2017). Analysis of the legacy of conflict among international tourists in Vietnam. International Journal of Tourism Anthropology, 6(1), 1–17.
Petrescu, R. M. (2011). The involvement of the public and private sector–Elements with influence on travel & tourism demand during the crisis period. Tourism and Hospitality Management, 17(2), 217-230.
Prayag, G. (2020). Time for reset? Covid-19 and tourism resilience.
Tourism Review International, 24(2), 179-184. https://doi.org/1 0.3727/154427220X15926147793595.
Ranasinghe, R., & Li, C. (2017). Dimensions of mobilities, tourism and transition of cultural hegemony: A qualitative inquiry from Sri Lanka. International Journal of Tourism Anthropology, 6(1), 21–40.
Reno, E., Quan, N. G., Franco-Paredes, C., Chastain, D. B., Chauhan, L., Rodriguez-Morales, A. J., & Henao-Martínez, A. F. (2020). Prevention of yellow fever in travellers: an update. The Lancet Infectious Diseases, May, 1–9. https://doi.
org/10.1016/S1473-3099(20)30170-5.
Ribeiro, E. da C., & Wang, B. (2020). Tourism led growth hypothesis: Has the tourism industry an impact on the economic growth of Sao Tome and Principe? International Journal of Economics and Financial Issues, 10(1), 180–185. https://doi.
org/10.32479/ijefi.9105.
Rohman, F. (2020). Determining adventure tourist loyalty:
meadiating role of touristsatisfaction and quality of life. Journal of Asian Finance, Economics and Bisiness, 7(10), 255-265.
https://doi:10.13106/jafeb.2020.vol7.n10.255.
Snieška, V., Barkauskiene, K., & Barkauskas, V. (2014). The impact of economic factors on the development of rural tourism : Lithuanian case. In: 19th International Scientific Conference;
Economics and Management 2014, ICEM 2014, 23-25 April 2014, Riga, Latvia (Vol. 156, pp. 280–285). Riga: Elservier.
https://doi.org/10.1016/j.sbspro.2014.11.189
Tabash, M. I. (2017). The Role of tourism sector in economic growth: An empirical evidence from Palestine.
Inter national Journal of Economics and Financial Issues, 7(2), 103–108.
Tatem, A. J., Rogers, D. J., & Hay, S. I. (2006). Global transport networks and infectious disease spread. Advances in Parasitology, 62(05), 293–343. https://doi.org/10.1016/S0065- 308X(05)62009-X.
Than, T. T., Kieu, T. P. H., Pham, T. A. D., Hoang, T. C. V., Tran, T. H., Nguyen, H. D., & Dao, T. K. (2020). Impact of community attachment and resident’s support on destination sustainability: Evidence from spiritual and community destination in Viet Nam. Journal of Asian Finance, Economics and Bisiness, 7(8), 361-369. https://doi.org/10.13106/
jafeb.2020.vol7.no8.361
The ASEAN Secretariat. (2019). ASEAN key figures 2019. Jakarta, Indonesia.
United Nations Conferences of Trade and Development (UNCTAD). (2020). COVID-19 and tourism: Assessing the economic consequences. Geneva, Switzerland.
Veréb, V., Nobre, H., & Farhangmehr, M. (2020). Cosmopolitan tourists : The resilient segment in the face of terrorism. Tourism Management Perspectives, 33(2020), 100620. https://doi.
org/10.1016/j.tmp.2019.100620
Xiang, Z., Magnini, V. P., & Fesenmaier, D. R. (2015). Information technology and consumer behavior in travel and tourism : Insights from travel planning using the internet. Journal of Retailing and Consumer Services, 22(2015), 244–249. https://
doi.org/10.1016/j.jretconser.2014.08.005.
Yap, G., & Allen, D. (2011). Investigating other leading indicators influencing Australian domestic tourism demand. Mathematics
and Computers in Simulation, 81(7), 1365–1374. https://doi.
org/10.1016/j.matcom.2010.05.005.
World Travel Organization (UNWTO). (2019). International tourism highlights. UNWTO. Madrid, Spain. https://doi.
org/https://www.e-unwto.org/doi/pdf/10.18111/9789284 421152?download=true.
Wamboye, E. F., Nyaronga, P. J., & Sergi, B. S. (2020). What are the determinant of international tourism in Tanzania? World Development Perspectives, 17(2020), 100175. https://doi.
org/10.1016/j.wdp.2020.100175.
World Bank. (2006). Ethiopia: Towards a strategy for pro-poor tourism development. Prepared for the Government of Ethiopia by the World Bank. Africa Region.