ANALYSIS OF METHOD FOR SAR RADIOMETRIC CALIBRATION ACCURACY WITH POINT TARGET
Tae-Bong Oh, Chul-Ho Jung, Ho-Ryung Jeong and Hyo-suk Lim
Satellite Data Cal/Val Department
Satellite Information Research Institute, Korea Aerospace Research Institute [email protected]
ABSTRACT In the paper, two methods are evaluated for performance assessment of Synthetic Aperture Radar (SAR) image. The peak estimation method and the integral method are the efficient extraction methods of Radar Cross Section (RCS) from a point target such as corner reflector or active transponder on the ground. Since the peak estimation method requires knowledge of the equivalent rectangle system resolution which is sensitive to image focusing, the integral method is usually recommended. However the integral method is sometimes inaccurate, due to the sidelobes of strong speckle and background contribution around the point target. For the practical case of SAR image, the integrated energy is estimated by simple summation of the mainlobe area of a point target. The two methods are compared for performance analysis in which the impulse response function of the point target is affected by interference. And the radiometric performance variation is presented in detail for calibration accuracy analysis.
KEY WORDS: radiometric calibration accuracy, RCS, integral method, peak estimation method
1. INTRODUCTION
A synthetic aperture radar (SAR) system is of great interest in many fields of civil and military applications because of all-weather and luminance free imaging capability. In order to maintain the specific design requirement of the SAR system, a certain level of the SAR image quality is required to keep during the whole period of the life cycle. All error factors in the design, testing and operational phase have to be taken into account in order to assess the exact performance prediction of the system, there is a need to calibrate and characterize the total SAR system.
The calibration process transforms the image magnitude or power into the required physical units, which are assumed to be those of radar cross section (RCS) or back-scattering coefficient. Hence, the quality of these RCS maps is essentially defined by the capability to determine the radiometric characteristics of the system.
The calibration factors and image quality parameters for SAR data are usually derived from the impulse response function (IRF) of a point target such as corner reflectors (CR) or active transponders on the ground test site. The peak estimation method and the integral method are efficient technique to calculate radiometric calibration accuracy. In this paper, radiometric calibration accuracy are evaluated from the point target of a simulated X-band SAR image, and the parameter variation is analyzed in detail.
2. CALIBRATION METHODS OF RADIOMETRIC ACCURACY
The act of calibration is that required to determine the transfer function between the SAR system output and a predefined reference system. In case of the radiometric calibration, it is the conversion of the SAR digital data
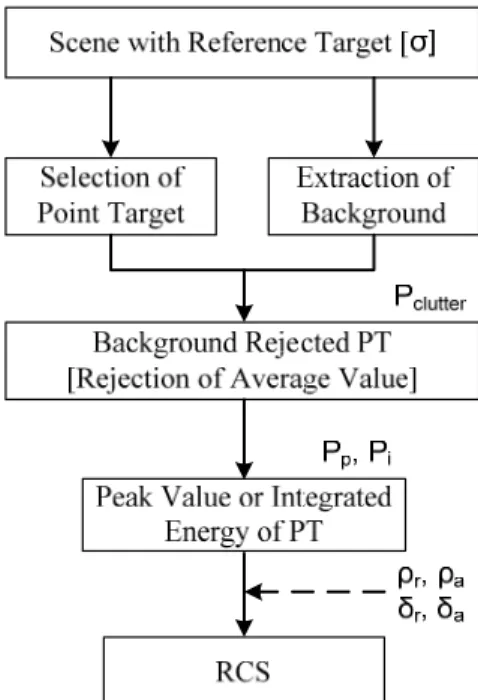
stream into the radar cross section. The peak estimation method obtains the energy of a point target by multiplying the peak response with the equivalent rectangle resolution of the system obtaining after exchanging the order of integration and summation. The integral method, on the other hand, integrates the impulse response to obtain the energy. Both methods provide the means to obtain the energy from the point target as Fig. 1.
Figure 1. Flowchart of Calibration Methods It is first necessary to remove the background scattering contribution clutter from the area around the impulse response of point target. The clutter intensity is calculated by summing the pixel intensities of up two
areas which avoid the azimuth and range sidelobe structure of the IRF. After background rejection, peak value and integrated energy of each method are calculated.
2.1 Peak Estimation Method
This method uses estimates of the peak pixel value of the impulse response of a known radar reflector to derive the backscatter coefficient of adjacent clutter areas. This leads to the calculation of
u u a r p
P ⋅ ⋅P
⋅
= ⋅ θ
ρ ρσ
σ0 sin (1)
Where σ is the RCS of the known point target, Pp is the peak reflector estimate, ρ and a ρr are the azimuth and slant range resolutions respectively, and θ is the u local incidence angle of the uniform distributed target with the average pixel value Pu . In this equation the factor
σ ρ ρr a p p
C P ⋅ ⋅
= (2)
is only depending on the calibration device and not on the distributed target. Hence, it can be regarded as the general calibration factor for the peak estimation method.
The shape and peak value of a point reflector impulse response depends on how well the linear FM rates are matched and on the form of the reference function weighting used to reduce the sidelobes. The average pixel value Pu for a uniform clutter area is independent of focus, but the peak impulse value Pp is not.
2.2 Integral Method
This method integrates the power of the calibration device in an area around it. This calculation includes the sum of the point target power as well as the power received from the background of the area. Therefore the background contribution has to be subtracted. This can be done by averaging the background power over an area without dominant point targets to estimate the background in the integration area. The calculation of the integrated reflector energy Pi is done on the cross-shaped integration area N around the point target. The back- ground contribution is estimated by the 4 square areas M in the corners of the cross. Thus, the background corrected integrated power can be calculated as
clutter total
i P
M P N
P ⋅
− ⋅
= 4 (3)
This leads to the calculation of
u u a r i
P ⋅ ⋅P
⋅
= ⋅ θ
δ δσ
σ0 sin (4)
Where σ is the RCS of the known point target, Pi is the integrated reflector energy, δ and a δr are the image azimuth and slant range pixel spacing respectively, and θ is the local incidence angle of the uniform distributed u
target with the average pixel value Pu. In this equation the factor
σ δ δr a i i
C = P⋅ ⋅ (5)
is only depending on the calibration device and not on the distributed target. Hence, it can be regarded as the general calibration factor for the integrated method on pixel values. This integration method has major advantage to be independent of processor focus or actual resolution.
3. SIGNAL MODEL
The procedure of the SAR image calibration starts with modeling and generation of SAR raw signal for a hypothetical point scatterer as an ideal reference. The system parameters for the generation of a SAR point target signal include the complete geometry of the spaceborne SAR and the SAR sensor parameters such as altitude, platform velocity, operational frequency, PRF, FM rate, and so on. The two-dimensional point target signal can be modeled as (6)
] ) / ) ( 2 ( exp[
] / ) ( 4 exp[
) ( ) / ) ( 2 ( ) , (
c 2
u R t K j u
R j
u u r c u R t r u t
g r a c
−
−
×
−
−
=
π λ
π (6)
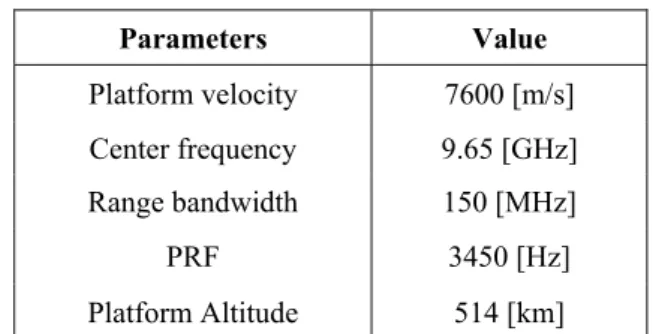
Where, t is fast time, u is slow time in flight path, R(u) is slant range, uc is the closest approach time to a point scatterer, λ is wavelength, and K is the frequency modulation rate of the transmitted signal. X-band spaceborne SAR is assumed in this simulation and the key system parameters are listed in Table 1.
Table 1. System Parameters for Point Target
Parameters Value Platform velocity 7600 [m/s]
Center frequency 9.65 [GHz]
Range bandwidth 150 [MHz]
PRF 3450 [Hz]
Platform Altitude 514 [km]
The amplitude response of point target is modelled as a trihedral corner reflector composed of three orthogonal triangular plates. The ideal radar cross section (RCS) of corner reflector can be easily computed based on its mechanical dimension according to
) 3 /(
4π 4 λ2
σRCS = l (7) In (7), l is the inner leg length. The inner leg length of 1.65 m, which leads the peak response of 45.07 dBsm, is assumed in this paper.
4. SIMULATION
Firstly, point target with ideal background and speckle noise background are simulate as shown Figure 2, which show each case of point target ((a) ideal case PT (b) PT with noise background).
(a) (b)
Figure 2. Simulated Point Target
Table 2 show image quality parameters of ideal case of PT (Figure 2(a)). The RCS is extracted 44.733 dBsm which is similar to target model value.
Table 2. Image Quality Parameters of IRF
Parameters Value Azimuth Resolution 3.307 [m]
Range Resolution 2.914 [m]
RCS 44.733 [dBsm]
Figure 2(b) is nominal case of point target with white Gaussian noise. RCS variations by background noise level are simulated to analysis the effect of noise.
Extracted RCS have slight variations in high background level, But to no serious effect on the radiometric calibration accuracy, as shown Figure 3.
Figure 3. RCS Variations by Noise Fluctuation
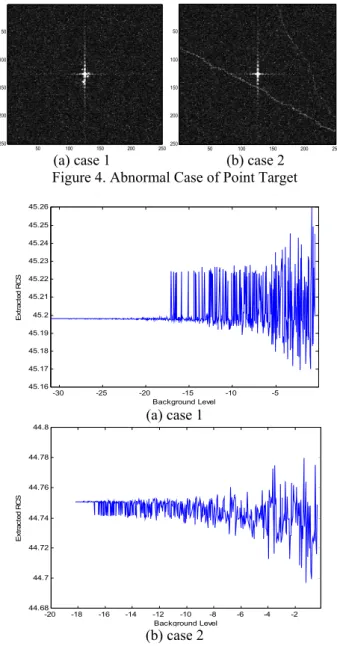
And it is analyzed two abnormal cases such as background level is constant, but strong impulse effect on sidelobes of IRF (case 1), and artificial structure does (case 2).
(a) case 1 (b) case 2 Figure 4. Abnormal Case of Point Target
(a) case 1
(b) case 2
Figure 5. RCS Variations for Abnormal Case Two cases of background with strong impulse and artificial structure (road) are simulated as shown Figure 4.
In order to examine the characteristic of RCS variations, and curve with respect to background level are shown in Figure 5. The mean value of RCS of the case 1 show about 45.2 dBsm, which is about 0.5 dBsm higher than the reference RCS of 44.733 dBsm which is the nominal case of point target. The mean value of RCS of the case 2 show about 44.75 dBsm, which is similar to the reference one. The deviations of RCS variations of the each case are stable, which compare to the deviations of RCS variations for nominal case.
Integral method is the best method for arriving at an accurate prediction of the RCS, however is not in abnormal case of PT analysis. The result of Integral method, due to the sidelobes of strong speckle and
50 100 150 200 250
50
100
150
200
250 50 100 150 200 250
50
100
150
200
250
-30 -25 -20 -15 -10 -5
44.66 44.68 44.7 44.72 44.74 44.76 44.78
Background Level
Extracted RCS
50 100 150 200 250
50
100
150
200
250 50 100 150 200 250
50
100
150
200
250
-30 -25 -20 -15 -10 -5
45.16 45.17 45.18 45.19 45.2 45.21 45.22 45.23 45.24 45.25 45.26
Background Level
Extracted RCS
-20 -18 -16 -14 -12 -10 -8 -6 -4 -2
44.68 44.7 44.72 44.74 44.76 44.78 44.8
Background Level
Extracted RCS
background contribution around the point target, is sometimes inaccurate.
5. CONCLUSION
In this study, radiometric calibration accuracy are evaluated from the point target of a simulated X-band SAR image. Integral method is analyzed by point target with speckle noise, abnormal strong impulse noise and background. The simulation result shows the mean RCS of strong impulse background varies about 45.16 to 45.26 dBsm, which is about 0.5 dB higher than the reference RCS of 44.733 dBsm. It is unstable compare to absolute radiometric accuracy of spaceborne SAR, which regularly have to satisfy within 0.6~1 dB. For the purpose of providing the practical background effect on the point target image, radiometric calibration accuracy analysis of real SAR data of abnormal case is needed.
Reference:
A. L. Gray, P. W. Vachon, C. E. Livingstone, and T. I.
Lukowski, 1998, ‘Synthetic Aperture Radar Calibration using Reference Reflectors”, IEE Transaction on GRS, 38(3), pp. 374-383
I. M. H. Ulander, 1991, “Accuracy of using Point Targets for SAR Calibration”, IEE Transcation on AAES, 27(1), pp. 139-148
E. F. Knott, 1993, Radar Cross Section, Artech House, Bostion-London
C. Buck, 2002, “ASAR External Calibration”, Proceeding of the ENVISAT Calibration Review, sp 520
C. Jung, J. Jung, T. Oh, Y. Kwag, 2008, “SAR image quality assessment in Real Clutter Environment”, in Proc.
of EUSAR conference 2008, Vol 3, pp. 383- 386