Genetic Variability of mtDNA D-loop Region in Korean Native Chickens
Md. Rashedul Hoque
1, Kie Chul Jung
2, Byung Kwon Park
3, Kang Duk Choi
4and Jun Heon Lee
1,†1
Department of Animal Science and Biotechnology, Chungnam National University, Daejeon 305-764, Korea
2
Poultry Science Division, National Institute of Animal Science, RDA, Cheonan 331-801, Korea
3
Department of Companion & Laboratory Animal Science, Kongju National University, Yesan 340-702, Korea
4
The Graduate School of Bio & Information Technology, Hankyong National University, Ansung 456-749, Korea
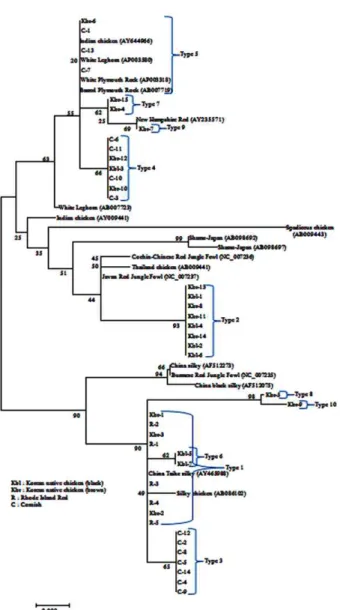
ABSTRACT In order to determine the origin and genetic diversity among chicken breeds, mitochondrial (mt) DNA D-loop sequences have been widely used. In this study, 41 individuals from four breeds (Korean native chicken (Black and Brown) and two imported breeds, Rhode Island Red and Cornish) were used for identifying genetic relationships with other chicken breeds. We obtained ten haplotypes and the highest number of haplotype was represented by eight individuals each from haplotype 1 and ha- plotype 2. Neighbor-joining phylogenetic tree indicates that the black and brown Korean native chicken breeds were mixed in haplotype 2 and they were closely related with the red jungle fowl (Gallus gallus). We also investigated whether the D-loop hypervariable region in chicken mtDNA can be used for the breed identification marker. The results indicated that the combination of the SNPs in the D-loop region can be possibly used for the breed discriminating markers. The results obtained in this study can be used for designing proper breeding and conservation strategies for Korean native chicken, as well as development of breed identification markers.
(Key words : breed identification marker, Korean native chickens, phylogenetic analysis, SNP)
†
To whom correspondence should be addressed : [email protected]
INTRODUCTION
Chicken is known to be domesticated from a single ancestor, mainly contributed by red jungle fowl (Gallus gallus), which originated in Southeast Asia (Akishinonomiya et al., 1994, 1996).
However, the current chicken is formed from several Gallus sub- species (Crawford, 1990) and the number of subspecies which has contributed to the origin of chicken is still controversial and remains uncertainty. The total number of breeds is now de- creasing because of low productivities of native chicken breeds and the concentrated demands for the high productive strains.
Recently, conservation of farm animal genetic resources has been focused on maintaining minimum number of animals for each breeds/species and there is some progress for this (http://www.
fao.org/dad-is/). In recent development of mtDNA sequence tag or bar-code can give the guideline for selection of animals for the breeding purpose (Hebert et al., 2003).
Mitochondrial DNA has been continuously used for the popu- lation, biogeographic and phylogenetic studies. Chicken mtDNA is 16,775 base pair long (Desjardins and Morais, 1990) and the mitochondrial genome is maternally inherited in most species
and does not undergo recombination (Hayashi et al., 1985). The D (displacement)-loop is the major control region for mtDNA expression and highly polymorphic compared with the nuclear DNA. The evolutionary rate is five to ten times higher than that of the nuclear genome (Brown et al., 1982). This makes D-loop in mtDNA use for phylogeographic analysis (Avise, 1994) which has been largely applied to understand phylogenetic relation- ships in many animal species, including cattle (Loftus et al., 1994;
Bradley et al., 1996; Mannen et al., 1998; Troy et al., 2001 Mannen et al., 2004; Bhuiyan et al., 2007), water buffalos (Lei et al., 2007), pig (Giuffra et al., 2000), sheep (Hiendleder et al., 1998, 2002), horse (Vila et al., 2001), goat (Luikart et al., 2001;
Mannen et al., 2001; Sultana et al., 2003; Joshi et al., 2004;
Sultana et al., 2004; Chen et al., 2005; Odahara et al., 2006) and chicken (Niu et al., 2002; Lui et al., 2004; Lui et al., 2006). There- fore, this hypervariable D-loop region of mtDNA can be used to detect ancient population structures, interspecies variability, archaeological inference about the origins and relationships between populations or species, identification of maternal lineages and post natal growth (Bradley et al., 1998; Troy et al., 2001;
Lui et al., 2004; Malau-Aduli et al., 2004; Yoon et al., 2005;
Odahara et al., 2006; Lei et al., 2007; Lee et al., 2007). Along with hypervariable D-loop nucleotide substitutions in mtDNA, breed specific markers were also investigated in chicken for de- lineating the breed structures and phylogenetic relationships with other breeds for the conservation perspectives (Hillel et al., 2003).
In our study, the D-loop hypervariable region of mtDNA has been used for determining the relationships between Korean na- tive chicken and other chicken breeds. Also, the possibility of using mtDNA markers has been investigated for the breed iden- tification.
MATERIALS AND METHODS
1. Experimental Animals and Sampling
A total of 41 blood samples were collected from Poultry Science Division, National Institute of Animal Science (NIAS) in Korea, which were composed of seven black Korean native chickens, fifteen brown Korean native chickens, five Rhode Island Red and fourteen Cornish breeds.
2. DNA Purification, PCR Amplification and Se- quencing
DNAs were extracted by using the procedures described by the manufacturer’s standard procedure of G-Dex
TMGenomic DNA Extraction Kit (iNtRON Biotechnology, Inc). Polymerase chain reaction (PCR) was used for amplifying the chicken mt- DNA D-loop region. The primer pair (Forward: 5'-AGGACTAC- GGCTTGAAAAGC-3' and Reverse: 5'-ATGTGCCTGACCGAG- GAACCAG-3') was used to amplify about 600 bp of the D-loop hypervariable region from the mtDNA. The PCR reactions were included approximately 100 ng of genomic DNA, 2.5 μL of 10×
buffer [contains Tris-HCl (pH 9.0), PCR enhancers, (NH
4)
2SO
4, 20 mM MgCl
2], 2.0 μL of 10 mM dNTPs mixture (2.5 mM each of dATP, dCTP, dGTP and dTTP), 1 μL of 10 pM of each primer and 1 U HS Prime Taq (GeNet Bio, Korea) in a 25 μL reaction volume. The PCR reaction was performed in a My- Genie96 Thermal Block (Bioneer, Korea) with an initial dena- turation step at 94℃ for 10 min followed by 35 cycles of 30 sec at 94℃, 30 sec at 61℃, 40 sec at 72℃ and a final extension step at 72 ℃ for 10 min. Purification of PCR products was per-
formed using Accuprep
ⓇPCR purification kit (Bioneer, Korea) according to the manufacturer’s instructions. All the PCR pro- ducts were run on 1.5% agarose gels stained with ethidium bro- mide and DNA bands were visualized under UV light. Purified PCR products were sequenced by Genotech (www.genotech.co.kr).
3. Data Analyses
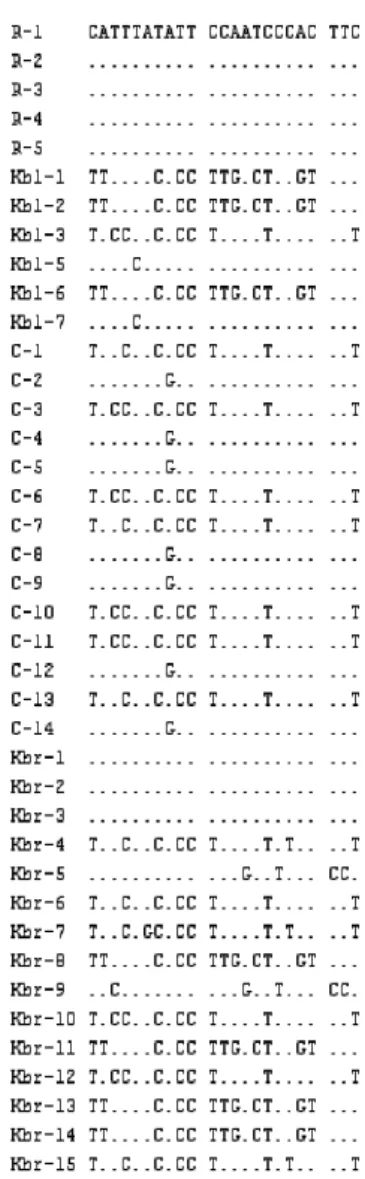
The chicken mtDNA D-loop nucleotide sequences obtained in this study were aligned using the ClustalW program (Thomp- son et al., 1994) and saved as bioedit format. Nucleotide replace- ment export data (Fig. 1) were carried out in haplotype sequences
Fig. 1. Sequence variations observed from Rhode Island Red
(R), black Korean native chicken (Kbl), Cornish (C) and
brown Korean native chicken (Kbr) for the D-loop hy-
pervariable region in mtDNA.
and identical sequences were considered as the same haplotypes by using MEGA software version 4.0.2 (Kumar et al., 2008).
The published complete and partial mtDNA sequence data of domestic chicken populations from National Center for Biotech- nology Information (NCBI) were also included in the analysis (GenBank accession numbers- AP003318, AP003580, AY235571, NC_007235, NC_007236, NC_007237, AB086102-AB007723, AB007719, AB098692, AB098697-AB009441, AB009443, AY 704710, AY644966, AY465988, AF512273, AF512075). Neigh- bor-joining phylogenetic tree was estimated by 1,000 random bootstrap resampling of the data (Kumar et al., 2008).
RESULTS AND DISCUSSION
1. MtDNA D-loop Sequence Variations in Chicken
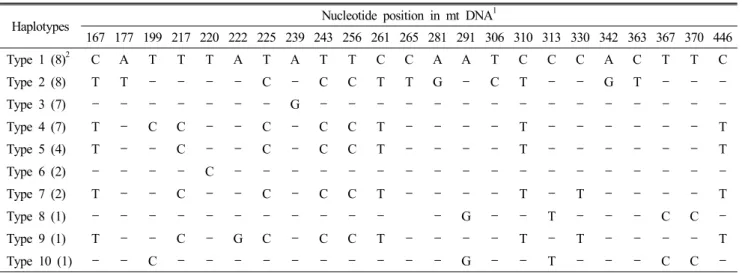
Analysis of sequences from D-loop hypervariable region in chicken mtDNA identified a total of 23 nucleotide substitutions, which were classified as ten haplotypes (Table 1). The highest common haplotype group contains eight individuals for both haplotype 1 and haplotype 2. The 2
ndcommon haplotype groups contain seven individuals in haplotype 3 and haplotype 4. Only one haplotype group comprised of four individuals in type 5, and the haplotype 6 and 7 contained 2 individuals, respectively.
The remaining three haplotypes (haplotype 8, 9, 10) were repre-
Table 1. Mitochondrial D-loop sequence polymorphisms identified in four breeds of chickens
Haplotypes Nucleotide position in mt DNA
1167 177 199 217 220 222 225 239 243 256 261 265 281 291 306 310 313 330 342 363 367 370 446
Type 1 (8)
2C A T T T A T A T T C C A A T C C C A C T T C
Type 2 (8) T T - - - - C - C C T T G - C T - - G T - - -
Type 3 (7) - - - - - - - G - - - - - - - - - - - - - - -
Type 4 (7) T - C C - - C - C C T - - - - T - - - - - - T
Type 5 (4) T - - C - - C - C C T - - - - T - - - - - - T
Type 6 (2) - - - - C - - - - - - - - - - - - - - - - - -
Type 7 (2) T - - C - - C - C C T - - - - T - T - - - - T
Type 8 (1) - - - - - - - - - - - - G - - T - - - C C -
Type 9 (1) T - - C - G C - C C T - - - - T - T - - - - T
Type 10 (1) - - C - - - - - - - - - - G - - T - - - C C -
1
Numbers indicate nucleotide base position in mitochondrial D-loop region and hypen represents the identical nucleotide with the type 1 sequence.
2