Citation: Cho HM, Wickramasuriya SS, Shin TK, Kim E, Heo JM, Yi YJ. 2017.
Determination of growth performance of crossbred Korean native chickens for twelve weeks after hatching. Korean Journal of Agricultural Science 44:566-573.
DOI: https://doi.org/10.7744/kjoas.20170053
Editor: Woo Kyun Kim, University of Georgia, USA
Received: August 14, 2017
Revised: October 16, 2017
Accepted: October 18, 2017 Copyright: © 2017 Korean Journal of Agricultural Science.
This is an Open Access article distributed under the terms of the Creative Com- mons Attribution Non-Commercial License (http:
//creativecommons.org/licenses/by-nc/4.0/) which permits unrestricted non-commercial use, distribution, and reproduction in any medium, provided the original work is properly cited.
OPEN ACCESS
ANIMAL
Determination of growth performance of crossbred Korean native chickens for twelve weeks after
hatching
Hyun Min Cho
1, Samiru Sudharaka Wickramasuriya
1, Taeg Kyun Shin
1, Eunjoo Kim
1, Jung Min Heo
1*, Young-Joo Yi
2*1
Department of Animal Science and Biotechnology, Chungnam National University, Daejeon 34134, Korea
2
Division of Biotechnology, Safety, Environment and Life Science Institute, Chonbuk National University, Iksan 54596, Korea
*Corresponding author: [email protected], [email protected]
Abstract
The study was conducted to evaluate the growth performance, viability, and uniformity of female crossbred Korean native chickens (KNC) for the first twelve weeks after hatching.
Six crossbreed lines of chickens (1B, 2B, 3B, 4B, 5B, and 6B) bred from 1 paternal line and 6 maternal lines of KNC were compared in this study. Sixty newly hatched 1-day old chicks from each crossbreed, for a total of 360 chickens, were allocated into 6 replicates (10 birds per replicate) in a complete randomized design. Experimental diets used in this study consisted of 3 phases: 1) week 0 to 5, crude protein 20.3% and metabolizable energy 3,059 kcal/kg; 2) week 5 to 8, crude protein 18.6% and metabolizable energy 3,123 kcal/kg; and 3) week 8 to 12, crude protein 16.7% and metabolizable energy 3,187 kcal/kg. Body weight and feed intake were measured bi-weekly during the experiment. The 4B crossbreed had a higher body weight, average daily gain, and average daily feed intake on week 12 (p < 0.05) than the other groups. The 4B crossbreed had a lower (p < 0.05) uniformity during weeks 10 to 12 than crossbreeds 1B and 5B. However, a lower viability was observed (p > 0.05) in 4B in weeks 2 to 12 than those in the other groups. Results of the current study indicate that the 4B crossbreed had a higher growth performance in week 12 but had a lower viability for weeks 2 to 12 than the other crossbreeds.
Keywords: body weight, crossbreed, Korean native chickens, uniformity, viability
Introduction
자유무역협정(Free Trade Agreement)과 세계무역기구(World Trade Organization)로 인한 수
입 개방으로 값이 저렴한 축산물이 국내로 다량 유입되면서 축산농가는 경제적 부가가치생산의
어려움에 직면해 있다. 또한 수입된 축산물은 국내 축산물 보다 가격뿐만 아니라 품질에서도
차별화가 되어 있는 것으로 알려져 축산농가들의 어려움은 더욱 가중 될 것으로 예측된다. 한편
으로 가계소득이 증가함에 따라 축산물은 양적인 소비 패턴에서 안전과 품질이 보장 된 단백질
식품원으로서의 소비 패턴이 지속적으로 높아지고 있는 실정이다. 국내 토종닭은 도입종 육계와는 다르게 차별화 된 풍미로 인한 소비자들의 꾸준한 수요가 있는 것으로 알려져 있다(Ryu and Song, 1999; Ahn and Park, 2002).
예를 들면, 백숙을 비롯한 삼계탕과 같은 닭 요리에는 도입종 육계보다는 0.8 - 1.2 kg 전후의 크기의 토종닭이 한 국인의 풍미를 자극 할 수 있어 소비자의 기호도를 충족 시킬 수 있는 것으로 조사되었다(NIAS, 2008). 삼계탕에 주로 사용되는 닭은 백세미로서 고단백질, 저지방의 특성을 가지고 있으나(Cho et al., 2007), 계종으로는 공인을 받 지 못한 실정이다. 반면에 토종닭은 국립축산과학원에 보존된 5계통을 비롯한 전국 각지에 다양한 계종이 보존되 고 있으며(NIAS, 2008), 정미성분인 유리아미노산과 핵산 성분 중 inosine-5’-monophosphate와 glutamic acid을 많 이 함유하고 있어 육질과 풍미가 도입종 육계에 비하여 소비자의 선호도가 높은 것으로 파악된다(Ahn and Park, 2002; Choe et al., 2010). 그러나 토종닭의 성장 속도는 도입종 육계에 비하여 현저하게 낮으며(16 - 20주령, 1.5 - 2.0 kg vs. 30 ± 2 일, 1.65 ± 0.05 kg), 계종의 보존은 이루어 지고 있으나 계통 확립이 뚜렷하게 되지 않은 현안을 가 지고 있다(Kang et al., 1997a; Yoo et al., 2015; Shin et al., 2017).
따라서 본 연구는 토종닭 부계 1계통과 모계 6계통으로 구성된 6개의 교배조합을 이용하여 교배조합 간의 생산 성의 평가와, 국내 토종닭 시장의 활성화를 위한 기초자료로 사용하기 위하여 수행되었다.
Materials and Methods
본 실험은 충남대학교 동물윤리위원회 심의규정(CNU-00613)에 의해 검토된 후 수행 되었다. 본 실험에 공시된 닭의 사양은 본 대학교 닭 사육 관리 지침에 따랐으며, 동물의 관리 및 취급은 본 대학 동물실험윤리위원회의 규정 을 준수하고, 승인을 받았다.
공시동물과 실험설계 및 사료 급여 체계(Animals, housing, experimental design and diets)
본 실험에서 사용된 공시동물은 한협(한협농장, 충남남도 금산군)에서 생산된 순종 재래닭 종계 부계 1계통, 모 계 6계통에서 발생한 6개의 교배조합(1B, 2B, 3B, 4B, 5B, 6B) 암컷을 각각 60수씩 선발하여 총 360수를 이용하였 다. 공시동물은 교배조합별 6반복 처리하였고, 반복당 10수씩 생시체중을 기준으로 완전 임의배치 하였다.
실험에서 사용된 공시동물은 12주간 battery cage (76 × 61 × 46 cm)에서 실험을 수행하였다. Battery cage당 공시 동물을 10수씩 배치하여 사육하였으며, 실험기간동안 사료와 물을 자유로이 채식하도록 하였다. 점등은 부화 후 12 주령까지 종야 점등을 실시하였으며, 점등광도는 25 Lux를 유지하였다. 계사의 온도는 부화 후 1주일 동안은 32
± 2 ℃를 유지하였으며, 이후 1주일동안 3℃씩 온도를 하강하여 5주령부터는 20 ± 2℃를 유지하였다. 습도는 1주령 은 70 ± 5%, 2주령은 65 ± 5%, 이후로는 60 ± 5%를 유지하였다.
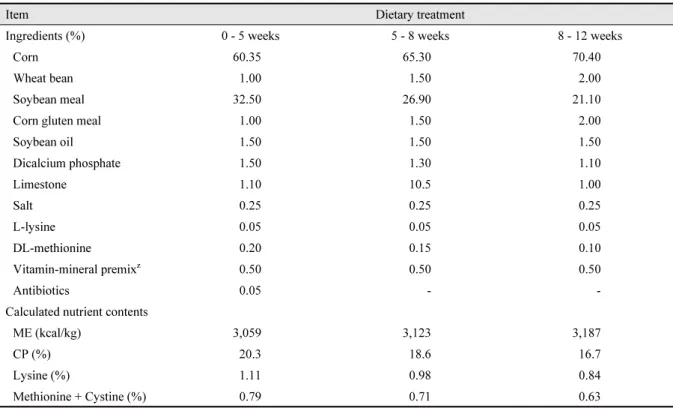
사육 단계별 사료 급여 형태는 한국가금사양표준(NIAS, 2012)의 준육용계 사양 표준에 따라 배합하였다. 한국 가금사양표준에서 제시한 옥수수-대두박 위주의 준육용계 사료를 육계 초기(CP 20.0%, ME 3,050 kcal/kg), 전기 (CP 18.0%, ME 3,100 kcal/kg), 후기(CP 16.0%, ME 3,100 kcal/kg)로 나누고, 자체 배합 생산하여 이용하였다(Table 1).
체중 및 일당증체량(Body weight and average daily gain)
체중 및 일당증체량은 부화 후 12주까지 2주 간격으로 오전 8시에 사료 급여를 중단하고 오전 10시에 개체별로 측정하였다.
일당사료섭취량(Average daily feed intake)
사료섭취량은 사료 급여량에서 사료 잔량을 측정하여 12주간 2주 간격으로 계산하였다.
Table 1. Composition of the experimental diet for female crossbreed Korean native chickens 12-week after hatching (g/kg, as-fed basis).
Item Dietary treatment
Ingredients (%) 0 - 5 weeks 5 - 8 weeks 8 - 12 weeks
Corn 60.35 65.30 70.40
Wheat bean 1.00 1.50 2.00
Soybean meal 32.50 26.90 21.10
Corn gluten meal 1.00 1.50 2.00
Soybean oil 1.50 1.50 1.50
Dicalcium phosphate 1.50 1.30 1.10
Limestone 1.10 10.5 1.00
Salt 0.25 0.25 0.25
L-lysine 0.05 0.05 0.05
DL-methionine 0.20 0.15 0.10
Vitamin-mineral premix
z0.50 0.50 0.50
Antibiotics 0.05 - -
Calculated nutrient contents
ME (kcal/kg) 3,059 3,123 3,187
CP (%) 20.3 18.6 16.7
Lysine (%) 1.11 0.98 0.84
Methionine + Cystine (%) 0.79 0.71 0.63
z
Vitamin and mineral mixture provided the following nutrients per kg of diet: vitamin A, 24,000 IU; vitamin D3, 6,000 IU; vitamin E, 30 IU; vitamin K, 4 mg; thiamin, 4 mg; riboflavin, 12 mg; pyridoxine, 4 mg; folacine, 2 mg; biotin, 0.03 mg; vitamin B8 0.06 mg; niacin, 90 mg; pantothenic acid, 30 mg; Fe, 80 mg (as FeSO
4․ H
2O); Zn, 80 mg (as ZnSO
4․ H
2O); Mn, 80 mg (as MnSO
4․ H
2O); Co, 0.5 mg (as CoSO
4․ H
2O); Cu, 10 mg (as CuSO
4․ H
2O); Se, 0.2 mg (as Na
2SeO
3); I, 0.9 mg (as Ca(IO
3) ․ 2H
2O).
사료 요구율(Feed conversion ratio)
사료 요구율은 부화 후 12주령까지의 2주 간격으로 사료섭취량을 증체량으로 나누어 계산하였다.
육성율(Viability)
육성률은 교배조합별 입추수수를 기준으로 12주간 2주 간격으로 조사한 생존수수의 비율(%)을 표시하였다.
균일도(Uniformity)
체중의 균일도는 12주령 체중을 변동계수(CV, %)로 나타내었다. 변동계수의 측정공식은 다음과 같다.
변동계수 표준편차 × 평균
통계분석(Statistical analyses)
교배조합 토종닭의 체중, 일당증체량, 사료섭취량, 사료요구율에 대한 분석은 SPSS 22.0 (SPSS Inc., Chicago,
IL, USA) 의 GLM program (General Linear Model, one-way ANOVA procedure)을 이용하여 분석하였으며, battery
cage 를 통계 단위로 계산하였다. 각 처리 구간의 표준 값을 Duncan의 다중검정을 이용하였으며, 95% 신뢰수준에
서 유의성을 검정하였다.
Results
체중(Body weight)
Table 2 는 6가지 교배 조합에 따른 12주간 체중에 대한 결과이다. 10주령을 제외한 모든구간에(0 - 12주) 걸쳐 교 배조합 사이 체중은 유의하게(p < 0.05) 변화하였다. 교배조합 4B가 생시체중이 가장 높았으나(p < 0.05), 4주령 그 리고 6주령에 교배조합 1B가 가장 높은(p < 0.05) 체중을 보였다. 8주령 그리고 12주령 교배조합 4B는 다시 높은 성 장을 보여 가장 높은(p < 0.05) 체중을 보였다. 교배조합 2B는 다른 교배조합 보다 비교적 낮은 체중을 보였으며, 특 히 2주령, 4주령 그리고 12주령 가장 낮은(p < 0.05) 체중을 보였다.
Table 2. Body weight of female crossbreed Korean native chickens for 12-week after hatching.
Item 1B 2B 3B 4B 5B 6B SEM
zp-value
Body weight (g)
Week 0 40.0c 39.8c 39.3bc 40.4c 37.4a 38.3ab 0.223 < 0.001 Week 2 175.9bc 164.2a 185.7cd 173.2ab 188.0d 177.1bc 1.899 0.001
Week 4 524.7c 471.1a 494.7ab 481.3a 513.1bc 490.6ab 4.471 0.001
Week 6 894.9c 833.2ab 819.0a 873.9bc 833.4ab 853.5abc 7.238 0.012
Week 8 1,344.8b 1,275.1a 1,278.8a 1,347.2b 1,311.0ab 1,257.6a 9.449 0.010
Week 10 1,676.8 1,614.1 1,717.3 1,714.3 1,695.3 1,646.5 13.908 0.212
Week 12 2,075.9ab 2,002.4a 2,134.3b 2,167.4b 2,083.8ab 2,024.3a 15.284 0.006
z
Standard error of the mean.
a - d: Mean values in the same row with different superscripts are statistically different.
일당증체량(Average daily gain)
Table 3 는 6가지 교배 조합에 따른 12주간 일당증체량에 대한 결과이다. 교배조합 사이 일당증체량은 전주기 (2 - 12 주)에 걸쳐 유의적으로(p < 0.05) 변화하였다. 2주령 교배조합 5B가 가장 높은(p < 0.05) 일당증체량을 보였 다. 이후 4주령, 6주령, 8주령 그리고 10주령에는 1B, 4B, 5B 그리고 3B가 순차적으로 가장 높은(p < 0.05) 일당증 체량을 보였다. 12주령에는 교배조합 4B가 가장 높은(p < 0.05) 수치를 나타내었다. 4주령까지 교배조합 2B, 3B 그 리고 4B 비교적 낮은(p < 0.05) 일당증체량을 보였으며, 8주령 그리고 12주령에 교배조합 6B가 가장 낮은(p < 0.05) 수치를 보였다.
Table 3. Average daily gain of female crossbreed Korean native chickens for 12-week after hatching.
Item 1B 2B 3B 4B 5B 6B SEM
zp-value
Average daily gain (g/d)
Week 2 9.71bc 8.89a 10.45cd 9.48ab 10.76d 9.91bc 0.140 < 0.001 Week 4 24.91b 21.92a 22.07a 22.01a 23.23a 22.39a 0.249 < 0.001 Week 6 26.45bc 25.86b 23.16a 28.04c 22.88a 25.92b 0.385 < 0.001 Week 8 32.14bc 31.56b 32.84bc 33.81bc 34.11c 28.86a 0.380 < 0.001 Week 10 23.71a 24.22a 31.32b 26.22a 27.45ab 27.78ab 0.694 0.010 Week 12 28.51a 27.74a 29.79ab 32.36ab 27.75a 26.98a 0.550 0.045
Week 12 2,075.9ab 2,002.4a 2,134.3b 2,167.4b 2,083.8ab 2,024.3a 15.284 0.006
z
Standard error of the mean.
a - d: Mean values in the same row with different superscripts are statistically different.
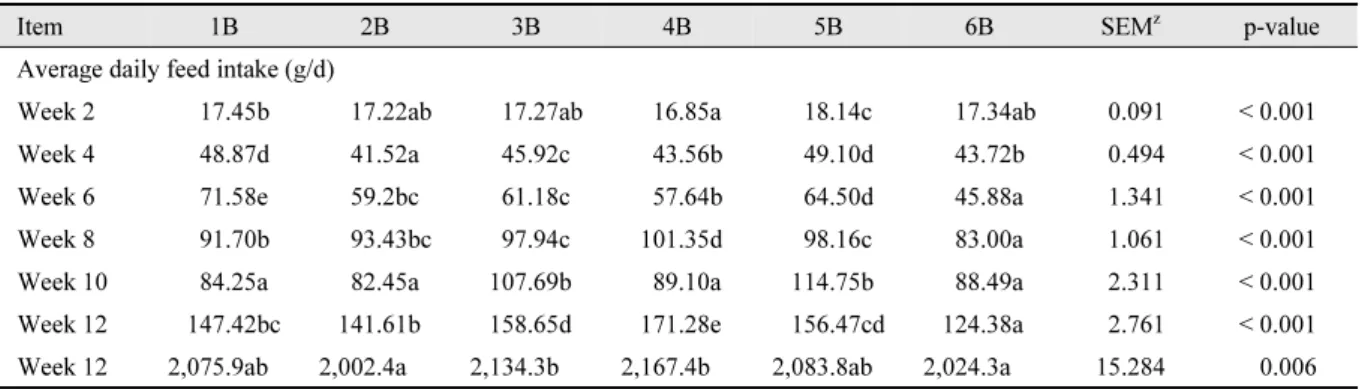
일당사료섭취량(Average daily feed intake)
Table 4 는 6가지 교배 조합에 따른 12주간 일당사료섭취량에 대한 결과이며, 전구간(2 - 12주)에 걸쳐 일당사료 섭취량은 유의적으로(p < 0.05) 변화하였다. 교배조합 4B는 2주령에 유의적으로 가장 낮은(p < 0.05) 일당사료섭취 량을 나타내지만, 8주령 그리고 12주령에 가장 높은(p < 0.05) 일당사료섭취량을 나타내었다. 교배조합 5B는 2주 령, 4주령에 가장 높은 일당사료섭취량을 보였으며, 10주령에도 가장 높은(p < 0.05) 수치를 보였다. 교배조합 6B 는 6주령, 8주령 그리고 12주령에 가장 낮은(p < 0.05) 일당사료섭취량을 보였다.
Table 4. Average daily feed intake of female crossbreed Korean native chickens for 12-week after hatching.
Item 1B 2B 3B 4B 5B 6B SEM
zp-value
Average daily feed intake (g/d)
Week 2 17.45b 17.22ab 17.27ab 16.85a 18.14c 17.34ab 0.091 < 0.001 Week 4 48.87d 41.52a 45.92c 43.56b 49.10d 43.72b 0.494 < 0.001 Week 6 71.58e 59.2bc 61.18c 57.64b 64.50d 45.88a 1.341 < 0.001 Week 8 91.70b 93.43bc 97.94c 101.35d 98.16c 83.00a 1.061 < 0.001 Week 10 84.25a 82.45a 107.69b 89.10a 114.75b 88.49a 2.311 < 0.001 Week 12 147.42bc 141.61b 158.65d 171.28e 156.47cd 124.38a 2.761 < 0.001
Week 12 2,075.9ab 2,002.4a 2,134.3b 2,167.4b 2,083.8ab 2,024.3a 15.284 0.006
z
Standard error of the mean.
a - d: Mean values in the same row with different superscripts are statistically different.
사료요구율(Feed conversion ratio)
Table 5 는 6가지 교배 조합에 따른 12주간 사료요구율에 대한 결과이다. 8주령 그리고 12주령을 제외한 주령에 서 유의적으로(p < 0.05) 사료요구율이 변화하였다. 교배조합 5B는 4주령, 6주령 그리고 10주령에서 가장 높은(p <
0.05) 사료요구율을 보였다. 2주령 그리고 4주령에는 교배조합 3B 그리고 2B가 순차로 가장 낮은(p < 0.05) 사료요 구율을 보였으며, 교배조합 6B가 6주령 그리고 10주령에 가장 낮은(p < 0.05) 수치를 보였다.
Table 5. Feed conversion ratio of female crossbreed Korean native chickens for 12-week after hatching.
Item 1B 2B 3B 4B 5B 6B SEM
zp-value
Feed conversion ratio (g/g)
Week 2 1.80b 1.94c 1.66a 1.78b 1.69ab 1.76ab 0.021 < 0.001 Week 4 1.96ab 1.90a 2.08bc 1.98ab 2.12c 1.96ab 0.021 0.009 Week 6 2.71de 2.29c 2.6d 2.06b 2.82e 1.78a 0.067 < 0.001 Week 8 2.86 2.97 2.99 3.00 2.88 2.88 0.027 0.526 Week 10 3.58a 3.49a 3.46a 3.42a 4.23b 3.22a 0.088 0.012 Week 12 5.23ab 5.18ab 5.44ab 5.34ab 5.65b 4.61a 0.119 0.197
Week 12 2,075.9ab 2,002.4a 2,134.3b 2,167.4b 2,083.8ab 2,024.3a 15.284 0.006
z
Standard error of the mean.
a - e: Mean values in the same row with different superscripts are statistically different.
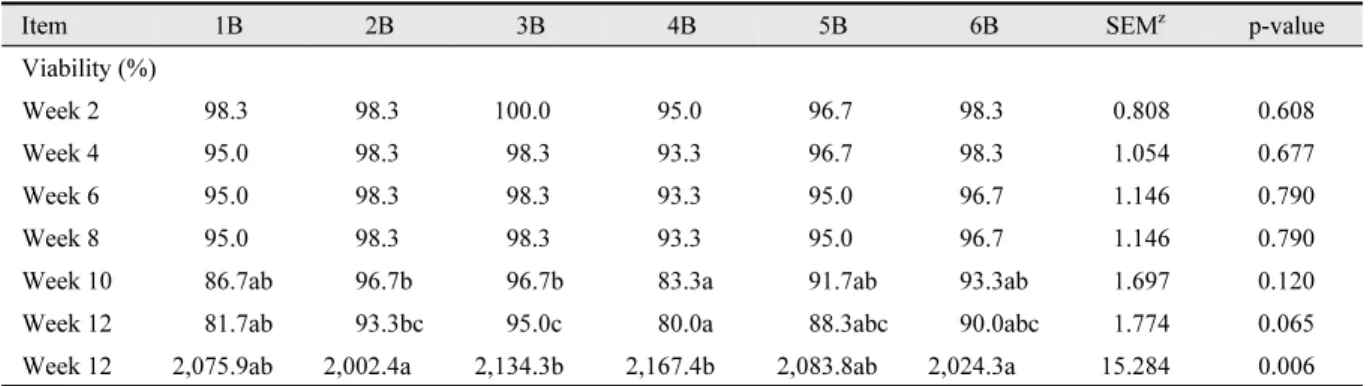
육성률(Viability)
Table 6 는 6가지 교배 조합에 따른 12주간 육성률에 대한 결과이다. 전 구간에서 유의적인 차이(p > 0.05)가 나타
나지 않았다. 12주령 교배조합 3B, 2B, 6B, 5B, 1B 그리고 4B 순차로 높은(p > 0.05) 육성률을 보였다.
Table 6. Viability of female crossbreed Korean native chickens for 12-week after hatching.
Item 1B 2B 3B 4B 5B 6B SEM
zp-value
Viability (%)
Week 2 98.3 98.3 100.0 95.0 96.7 98.3 0.808 0.608
Week 4 95.0 98.3 98.3 93.3 96.7 98.3 1.054 0.677
Week 6 95.0 98.3 98.3 93.3 95.0 96.7 1.146 0.790
Week 8 95.0 98.3 98.3 93.3 95.0 96.7 1.146 0.790
Week 10 86.7ab 96.7b 96.7b 83.3a 91.7ab 93.3ab 1.697 0.120 Week 12 81.7ab 93.3bc 95.0c 80.0a 88.3abc 90.0abc 1.774 0.065
Week 12 2,075.9ab 2,002.4a 2,134.3b 2,167.4b 2,083.8ab 2,024.3a 15.284 0.006
z
Standard error of the mean.
a,b,c: Mean values in the same row with different superscripts are statistically different.
균일도(Uniformity)
Table 7 는 6가지 교배 조합에 따른 12주간 균일도에 대한 결과이다. 10주령 그리고 12주령에서 유의적인(p < 0.05) 변화를 보였다. 10주령에 교배조합 5B가 가장 높은(p < 0.05) 균일도를 보였으며, 교배조합 6B가 가장 낮은(p <
0.05) 수치를 보였다. 12주령에는 교배조합 1B, 5B, 4B, 6B, 2B 그리고 3B 순차로 높은(p < 0.05) 균일도를 보였다.
Table 7. Uniformity of female crossbreed Korean native chickens for 12-week after hatching.
Item 1B 2B 3B 4B 5B 6B SEM
yp-value
Uniformity (CV
z) (%)
Week 0 12.68a 16.87ab 19.34b 15.18ab 13.90ab 15.05ab 0.815 0.230 Week 2 7.69 7.98 8.69 7.33 9.37 7.08 0.373 0.510 Week 4 8.94 8.01 9.74 8.71 7.65 7.01 0.444 0.566 Week 6 7.49 7.30 9.51 7.79 8.02 7.79 0.361 0.576 Week 8 8.70 8.20 8.46 8.69 8.93 7.79 0.365 0.966 Week 10 10.16ab 7.31ab 8.22ab 8.72ab 11.14b 7.31a 0.431 0.040 Week 12 13.40b 8.00a 7.83a 9.94ab 12.64b 8.56a 0.574 0.004
Week 12 2,075.9ab 2,002.4a 2,134.3b 2,167.4b 2,083.8ab 2,024.3a 15.284 0.006
y
Standard error of the mean.
z