Korean Circulation Journal
Introduction
Hypertension is a major independent risk factor for atherosclerotic vascular diseases such as coronary arterial disease (CAD) in the worldwide population.
1)According to the traditional definition of hypertension as systolic blood pressure (SBP) ≥140 mmHg or diastolic blood pressure (DBP) ≥90 mmHg, about one-fourth of the adult population in Korea has hypertension, as do about 50% of patients with acute myocardial infarction (MI).
2)It has long been known that a higher SBP causes higher mortality in CAD and stroke,
3)and that lowering the blood pressure (BP) rapidly reduces cardiovascular risk.
4)In terms of treatment, decreasing a high BP into the normal
Print ISSN 1738-5520 • On-line ISSN 1738-5555
Blood Pressure Targets and Clinical Outcomes in Patients with Acute Myocardial Infarction
Hyukjin Park, MD, Young Joon Hong, MD, Jae Yeong Cho, MD, Doo Sun Sim, MD, Hyun Ju Yoon, MD, Kye Hun Kim, MD, Ju Han Kim, MD, Youngkeun Ahn, MD, Myung Ho Jeong, MD, Jeong Gwan Cho, MD, Jong Chun Park MD,
and other Korean Acute Myocardial Infarction Registry Investigators
Division of Cardiology, Chonnam National University Hospital, Cardiovascular Convergence Research Center Nominated by Korea Ministry of Health and Welfare, Gwangju, Korea
Background and Objectives: The optimal blood pressure (BP) target in patients with a history of acute myocardial infarction (MI) remains as a subject of debate. The ‘J curve phenomenon’ has been suggested as a target for BP control, however, it is unclear whether this phenomenon can be applied to MI patients. We analyzed patients with acute MI and investigated whether the ‘J curve phenomenon’
exists in this population.
Subjects and Methods: Data were obtained from a nationwide prospective Korea Acute Myocardial Infarction Registry, which included 10337 patients with acute MI who underwent percutaneous coronary intervention (PCI) between 2011 and 2014. The patients were divided into quintiles according to systolic blood pressure (SBP) and diastolic blood pressure (DBP), which were measured during a two-year clinical follow up. Two-year cumulative incidence of major adverse cardiac events (MACE) was analyzed among the groups.
Results: MACE was defined as a composite of cardiac death, need for recurrent revascularization (repeated PCI or coronary arterial bypass graft due to recurrent anginal symptoms or reoccurrence of MI), ischemic cerebrovascular accident, and need for hospitalization due to heart failure. During the two-year follow up, the total cumulative incidence of MACE was 9.7% (n=1005). BP-MACE analysis showed a U-shaped curve for both SBP and DBP, with the lowest MACE rate in quintiles with an average SBP of 112.2 mmHg and DBP of 73.3 mmHg. On Cox regression analysis, the U-shaped relation was statistically significant.
Conclusion: In patients with acute MI, a ‘U curve phenomenon’ was observed when assessing patient BP control versus MACE rate.
(Korean Circ J 2017;47(4):446-454)
KEY WORDS: Blood pressure; Myocardial infarction; Prognosis.
Received: January 9, 2017 Revision Received: March 24, 2017 Accepted: April 10, 2017
Correspondence: Young Joon Hong, MD, Division of Cardiology, Cardiovascular Convergence Research Center Nominated by Korea Ministry of Health and Welfare, Chonnam National University Hospital, 671 Jaebongro, Dong-gu, Gwangju 61469, Korea
Tel: 82-62-220-6978, Fax: 82-62-223-3105 E-mail: [email protected]
• The authors have no financial conflicts of interest.
This is an Open Access article distributed under the terms of the Creative Commons Attribution Non-Commercial License (http://creativecommons.org/
licenses/by-nc/3.0) which permits unrestricted non-commercial use,
distribution, and reproduction in any medium, provided the original work is
properly cited.
range decreases the risk of cardiovascular disease
5)and stroke;
6)however, there is still strong debate about the optimal BP target.
While a lower DBP can reduce cardiac workload, it can also impair
coronary perfusion. Therefore, the ‘J curve phenomenon’ has been suggested
7)and warns against excessive BP lowering. The concept has been challenged because of several confounding factors like
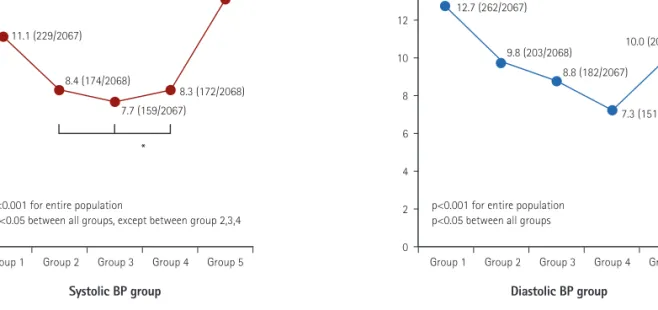
Table 1. Baseline clinical characteristics at presentation, according to systolic blood pressure groupVariables Group 1 (n=2067) Group 2 (n=2068) Group 3 (n=2067) Group 4 (n=2068) Group 5 (n=2067) p
Male 1528 (73.9) 1610 (77.9) 1562 (75.6) 1600 (77.4) 1531 (74.1) 0.005
Age 63.0±12.7 62.6±12.6 63.4±14.1 62.9±12.3 64.2±12.6 <0.001
Killip III/IV 218 (10.6) 214 (10.4) 182 (8.8) 214 (10.3) 214 (10.4) 0.316
Hypertension 738 (35.7) 817 (42.1) 993 (48.0) 114 (55.4) 1372 (66.4) <0.001
Diabetes mellitus 443 (21.4) 547 (26.5) 538 (26.0) 599 (29.0) 675 (32.7) <0.001
Dyslipidemia 195 (9.4) 231 (11.2) 240 (11.6) 266 (12.9) 257 (12.4) 0.006
Cardiovascular
disease 256 (12.4) 272 (13.2) 282 (13.6) 293 (14.2) 360 (17.4) <0.001
Cerebrovascular
disease 85 (4.1) 102 (4.9) 94 (4.5) 120 (5.8) 155 (7.5) <0.001
Smoking 1276 (61.7) 1326 (64.1) 1256 (60.8) 1234 (59.7) 1155 (55.9) <0.001
Aspirin 2064 (99.9) 2068 (100.0) 2063 (99.8) 2065 (99.9) 2067 (100.0) 0.069
Clopidogrel 1257 (60.8) 1261 (61.0) 1291 (62.5) 1286 (62.2) 1358 (65.7) <0.001
Prasugrel 395 (19.1) 253 (12.2) 269 (13.0) 273 (13.2) 221 (10.7) <0.001
Ticagrelor 415 (20.1) 554 (26.8) 505 (24.4) 507 (24.5) 487 (23.6) <0.001
Beta-blocker 1717 (82.8) 1798 (86.9) 1829 (88.5) 1807 (87.4) 1835 (88.8) <0.001
ACE inhibitor 885 (42.8) 994 (48.1) 1069 (51.7) 1127 (54.5) 1077 (52.1) <0.001
ARB 719 (34.8) 729 (35.3) 637 (30.8) 639 (30.9) 713 (34.5) 0.001
Statin 1960 (94.8) 1957 (94.6) 1955 (94.6) 1969 (95.2) 1955 (94.6) 0.877
Lesion type B2 or C 1848 (89.4) 1801 (87.1) 1798 (87.0) 1768 (85.5) 1745 (84.4) <0.001
Final TIMI III 1985 (96.0) 2005 (97.0) 2022 (97.8) 2011 (97.2) 2012 (97.3) 0.082
STEMI 1219 (59.0) 1147 (55.5) 1072 (51.9) 1010 (48.8) 870 (42.1) <0.001
Values are presented as mean±standard deviation or number (%). ACE: angiotensin converting enzyme, ARB: angiotensin receptor blocker, TIMI: thrombolysis in myocardial infarction, STEMI: ST-segment elevation myocardial infarction
200
150
100
50
Group 1 (93.6±5.0)
*
*****
*
*
Group 2
(103.6±2.1) Group 3
(111.2±2.4) Group 4
(119.8±3.0) Group 5 (135.2±9.1)
Systolic blood pressure
Systolic blood pressure group (mean value in mmHg) (mmHg)
125
100
75
50
25
Group 1 (54.3±3.9)
****
*******
**
*******
**
*
*
Group 2
(61.8±3.9) Group 3
(67.1±1.7) Group 4
(73.3±1.9) Group 5 (83.2±5.6)
Diastolic blood pressure
Diastolic blood pressure group (mean value in mmHg) (mmHg)
Fig. 1. Blood pressure distribution in each quintile.
age and past medical history.
Although BP is an important predictive factor of outcome, optimal BP targets have not yet been clearly defined in patients with MI.
8)9)Therefore, we aimed to clarify the existence of J curve phenomena in patients with acute MI and to define the optimal BP goal in this population subset.
Subjects and Methods
The target population was selected from the Korea Acute Myocardial Infarction Registry (KAMIR). KAMIR is a Korean prospective, multi-centered data collection registry reflecting real-world treatment practices and outcomes in Asian patients diagnosed with acute MI. The registry consists of 50 community and teaching hospitals with facilities for primary percutaneous coronary intervention (PCI) and on-site cardiac surgery. Data were collected by trained study coordinators using a standardized case report form and protocol. The study protocol was approved by the ethics committee at each participating institution.
A total of 13627 patients from KAMIR who were registered from November 2011 to July 2014 were selected. Among them, 10337 patients who underwent PCI and survived acute MI without complications were finally included. Patients who met the following criteria were excluded from the study: no significant fixed coronary arterial stenosis (vasospastic MI), no PCI, no elevation of cardiac enzymes, significant underlying disease such as malignancy, advanced liver disease, active infection, or inability to take medications.
A diagnosis of acute MI was made by clinicians based on the 2012 European Society of Cardiology/American College of Cardiology Foundation/American Heart Association/World Heart Federation (ESC/ACCF/AHA/WHF) diagnostic criteria.
10)The following baseline data were collected before coronary angiography (CAG): age, gender, history of CAD risk factors, baseline two-dimensional echocardiographic data, baseline laboratory data, and vital signs.
Data collection was mainly based on the clinician’s records and in- hospital examination results. CAG was performed via a transradial or transfemoral approach after administration of heparin. All patients received proper medical treatment including dual antiplatelet agents before and after CAG, in accordance with current guidelines.
Coronary artery stenting was performed using a standard technique.
Operators of each PCI made the decision to perform pre-dilation, direct stenting, and post-adjunctive balloon inflation, according to each patient’s circumstances. BP was measured at the time of presentation in the supine position and at the left or right brachial artery by an attending nurse using a manual sphygmomanometer.
BPs were measured throughout hospitalization in the same way.
Clinical follow up data were collected at 6, 12, and 24 months after discharge. At each clinical follow up, vital signs were measured, and the occurrence of major adverse cardiac event (MACE) was investigated. If there was any MACE requiring hospitalization, the BP measured at the time of hospitalization was used for analysis. If no MACE occurred, BP was measured in an outpatient clinic after at least five minutes of rest, in a seated position. After data collection, the entire target population was divided into quintiles according to average BP (SBP and DBP) during the follow up period, and the
14
12
10
8
6
4
2
0
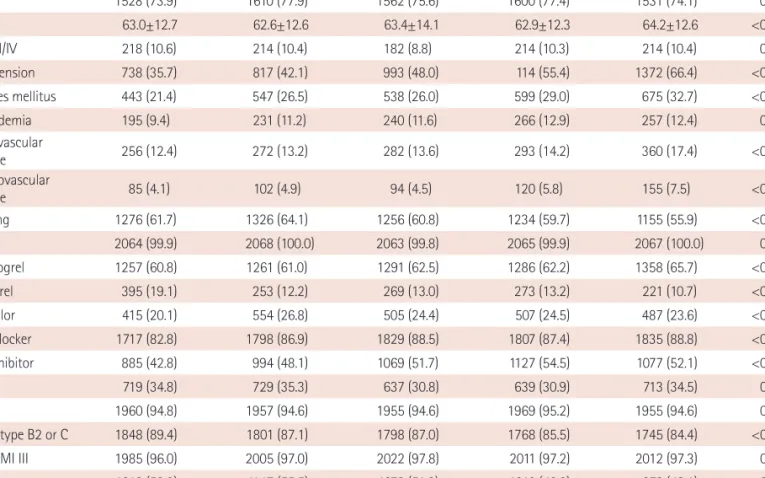
Group 1 Group 2 Group 3 Group 4 Group 5 p<0.001 for entire population
*p<0.05 between all groups, except between group 2,3,4 11.1 (229/2067)
8.4 (174/2068) 7.7 (159/2067)
8.3 (172/2068)
*
13.1 (271/2067)
Systolic BP group
14
12
10
8
6
4
2
0
Group 1 Group 2 Group 3 Group 4 Group 5 p<0.001 for entire population
p<0.05 between all groups 12.7 (262/2067)
9.8 (203/2068) 8.8 (182/2067)
7.3 (151/2068) 10.0 (207/2067)
Diastolic BP group
Fig. 2. Two-year cumulative incidence of MACE. Values in each group are presented as MACE rate (%) (number of patients with MACE/total patient
number). MACE: major adverse cardiac events, BP: blood pressure.
incidence of MACE was compared between quintiles.
Statistical Package for Social Sciences (SPSS) 22.0 for Microsoft Windows (SPSS Inc., Chicago, IL, USA) was used for all statistical analyses. All numerical variables are presented as mean±standard deviation and were compared by independent samples t-test. All categorical variables are shown as number and percentage and were compared using Chi-square or Fisher’s exact test to determine the significance of differences. Cox regression analysis was used to determine independent risk factors for occurrence of MACE. All statistical tests were two-tailed, and a p value<0.05 was considered statistically significant.
Results
The average BP during the two-year clinical follow up of the entire population was 112.7±15.1 mmHg for SBP and 68.0±10.3 mmHg for DBP. BP distribution and the average BP of each group are displayed in Fig. 1. The lowest quintile had an average SBP of 93.6±5.0 mmHg (group 1), while the higher quintiles had average SBPs of 103.6±2.1 mmHg (group 2), 111.2±2.4 mmHg (group 3),
119.8±3.0 mmHg (group 4), and 135.2±9.1 mmHg (group 5). The lowest quintile had an average DBP of 54.6±3.9 mmHg (group 1), while the higher quintiles had average DBPs of 61.8±1.7 mmHg (group 2), 67.1±1.7 mmHg (group 3), 73.3±1.9 mmHg (group 4), and 83.2±5.6 mmHg (group 5). Each group’s baseline characteristics are listed in Table 1 according to SBP and in Table 2 based on DBP.
Most patients were male (75.8%), and the mean age of the study population was 63.2±12.9 years. Although a statistically significant difference was identified in mean age across the groups, only a small difference existed in the actual values.
About half of the entire population had a previous history of hypertension (49.5%), and 14.2% of patients were already diagnosed with CAD before index hospitalization. Higher quintile groups tended to have a higher prevalence of risk factors for atherosclerosis, such as hypertension and diabetes mellitus.
PCI was successful in the vast majority of patients (97.1%, defined as post-PCI thrombolysis in myocardial infarction [TIMI] flow III). The use of beta-adrenergic receptor blockers was lower in the lowest quintile, and angiotensin-converting enzyme inhibitors (ACEi) or angiotensin receptor blockers (ARB) were used more frequently in higher quintiles.
Only a few patients received both ACEi and ARB simultaneously.
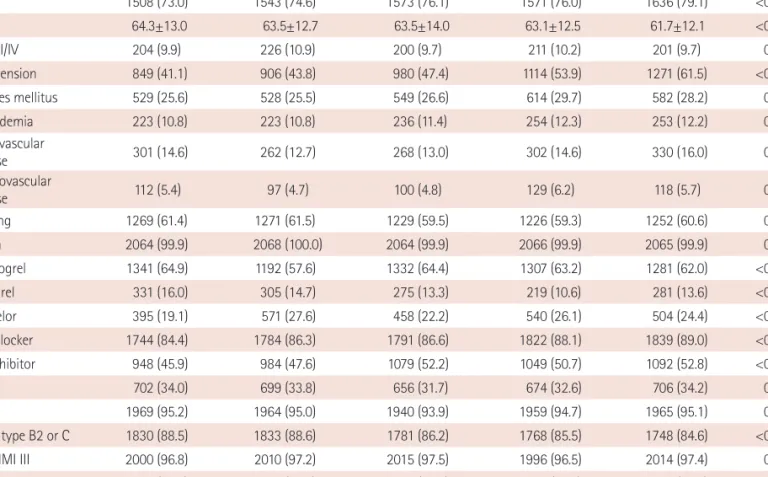
Table 2. Baseline clinical characteristics at presentation, according to diastolic blood pressure group
Variables Group1 (n=2067) Group2 (n=2068) Group3 (n=2067) Group4 (n=2068) Group5 (n=2067) p
Male 1508 (73.0) 1543 (74.6) 1573 (76.1) 1571 (76.0) 1636 (79.1) <0.001
Age 64.3±13.0 63.5±12.7 63.5±14.0 63.1±12.5 61.7±12.1 <0.001
Killip III/IV 204 (9.9) 226 (10.9) 200 (9.7) 211 (10.2) 201 (9.7) 0.660
Hypertension 849 (41.1) 906 (43.8) 980 (47.4) 1114 (53.9) 1271 (61.5) <0.001
Diabetes mellitus 529 (25.6) 528 (25.5) 549 (26.6) 614 (29.7) 582 (28.2) 0.009
Dyslipidemia 223 (10.8) 223 (10.8) 236 (11.4) 254 (12.3) 253 (12.2) 0.350
Cardiovascular
disease 301 (14.6) 262 (12.7) 268 (13.0) 302 (14.6) 330 (16.0) 0.015
Cerebrovascular
disease 112 (5.4) 97 (4.7) 100 (4.8) 129 (6.2) 118 (5.7) 0.161
Smoking 1269 (61.4) 1271 (61.5) 1229 (59.5) 1226 (59.3) 1252 (60.6) 0.450
Aspirin 2064 (99.9) 2068 (100.0) 2064 (99.9) 2066 (99.9) 2065 (99.9) 0.464
Clopidogrel 1341 (64.9) 1192 (57.6) 1332 (64.4) 1307 (63.2) 1281 (62.0) <0.001
Prasugrel 331 (16.0) 305 (14.7) 275 (13.3) 219 (10.6) 281 (13.6) <0.001
Ticagrelor 395 (19.1) 571 (27.6) 458 (22.2) 540 (26.1) 504 (24.4) <0.001
Beta-blocker 1744 (84.4) 1784 (86.3) 1791 (86.6) 1822 (88.1) 1839 (89.0) <0.001
ACE inhibitor 948 (45.9) 984 (47.6) 1079 (52.2) 1049 (50.7) 1092 (52.8) <0.001
ARB 702 (34.0) 699 (33.8) 656 (31.7) 674 (32.6) 706 (34.2) 0.399
Statin 1969 (95.2) 1964 (95.0) 1940 (93.9) 1959 (94.7) 1965 (95.1) 0.305
Lesion type B2 or C 1830 (88.5) 1833 (88.6) 1781 (86.2) 1768 (85.5) 1748 (84.6) <0.001
Final TIMI III 2000 (96.8) 2010 (97.2) 2015 (97.5) 1996 (96.5) 2014 (97.4) 0.620
STEMI 1120 (54.2) 1137 (55.0) 1049 (50.7) 1056 (51.1) 956 (46.3) <0.001
Values are presented as mean±standard deviation or number (%). ACE: angiotensin converting enzyme, ARB: angiotensin receptor blocker,
TIMI: thrombolysis in myocardial infarction, STEMI: ST-segment elevation myocardial infarction
During the two-year clinical follow up, 9.7% (n=1005) of patients experienced at least one MACE. Cardiac death occurred in 2.6% (n=265) of all patients, and 4.8% (n=497) required repeat revascularization due to recurrent anginal symptoms or recurrence of MI. In addition, 0.7% (n=76) of the patients experienced cerebrovascular accident (CVA), and hospitalization was required in 2.7% (n=274) due to heart failure. The cumulative incidence of
MACE was assessed against both SBP and DBP, revealing a U-shaped relation between the two variables (Fig. 2). MACE occurred most infrequently in SBP group 3 (MACE in 159 of 2067 [7.7%] patients), with a similar MACE rate in group 2 (average SBP 103.6±2.1 mmHg) and group 4 (average SBP 119.8±3.0 mmHg). Among the DBP groups, the MACE rate was the lowest in group 4 (average DBP 73.3±1.9 mmHg, MACE in 151 of 2068 [7.3%] patients).
16
14
12
10
8
6
4
2
0
Group 1 Group 2 Group 3 Group 4 Group 5 p<0.001 for entire population
13.0 10.8
10.0
6.7
4.9 5.5
9.1 10.7
10.6 15.2
Systolic BP group
18 16 14 12 10 8 6 4 2 0
Group 1 Group 2 Group 3 Group 4 Group 5 p<0.001 for entire population
15.5
10.7
7.1 6.2
5.3 9
6.3 13.4
11.7 12.4
Diastolic BP group
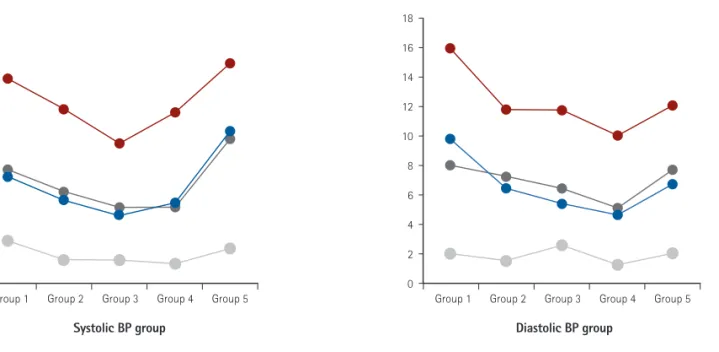
Fig. 3. Two-year cumulative incidence of MACE in patients with history of hypertension (red lines) or without history of hypertension (blue lines). Values in
each group are presented as MACE rate (%). MACE: major adverse cardiac events, BP: blood pressure.
7
6
5
4
3
2
1
0
Group 1 Group 2 Group 3 Group 4 Group 5 Systolic BP group
18 16 14 12 10 8 6 4 2 0
Group 1 Group 2 Group 3 Group 4 Group 5 Diastolic BP group
Cardiac death (p<0.001)
Revascularization (p=0.014)
CVA (p=0.146)
Hospitalization due to HF (p=0.001)
Cardiac death (p=0.001)
Revascularization (p=0.012)
CVA (p=0.457)
Hospitalization due to HF (p=0.181)
Fig. 4. Two-year cumulative incidence of each component of MACE. CVA: cerebrovascular accident, HF: heart failure, MACE: major adverse cardiac events,
BP: blood pressure.
The study groups were divided into two subgroups: patients with prior history of hypertension and those without. MACE rates were then compared between these groups. In patients without prior history of hypertension, the average SBP was 93.1±4.8 mmHg (group 1), 103.2±2.3 mmHg (group 2), 112.1±2.1 mmHg (group 3), 117.7±3.2 mmHg (group 4), and 134.2±8.3 mmHg (group 5). The average DBP in those without a history of hypertension was 54.7±3.7 mmHg (group 1), 62.0±1.7 mmHg (group 2), 66.7±2.0 mmHg (group 3), 73.7±1.8 mmHg (group 4), and 82.8±5.3 mmHg (group 5). In patients with prior history of hypertension, average SBP was 93.7±5.0 mmHg (group 1), 103.6±2.1 mmHg (group 2), 111.3±2.4 mmHg (group 3), 119.9±3.0 mmHg (group 4), and 135.7±9.5 mmHg (group 5). The average DBP for those with preexisting hypertension was 54.5±4.2 mmHg (group 1), 61.7±1.7 mmHg (group 2), 67.1±1.6 mmHg (group 3), 73.3±2.0 mmHg (group 4), and 83.5±5.7 mmHg (group 5). The U-shaped relation was still observed in this subgroup analysis; however, despite similar BP control rates between patients with or without history of hypertension, MACE rate was considerably higher in patients with history of hypertension (Fig. 3).
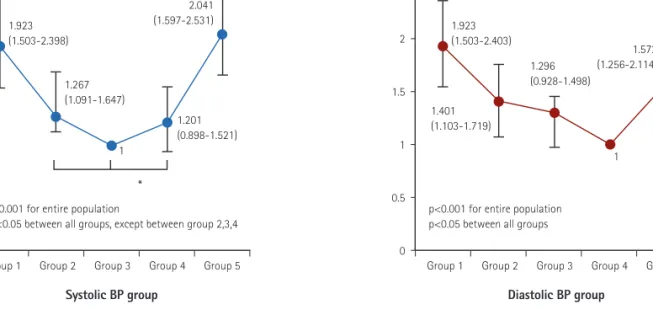
A similar trend was observed in occurrence rate of each component of MACE, except CVA, which occurred very infrequently (<1% in most groups) (Fig. 4). The U-shaped relation to MACE was statistically significant in Cox regression analysis for both SBP and DBP, except between SBP groups 2, 3, and 4 (Fig. 5).
In Cox regression analysis, higher age, higher Killip class (III or IV) at presentation, previous history of hypertension, and diabetes were also shown to be independent risk factors for MACE occurrence. On the contrary, use of prasugrel, ticagrelor, beta-blockers, or statins
was shown to be protective against MACE (data not shown).
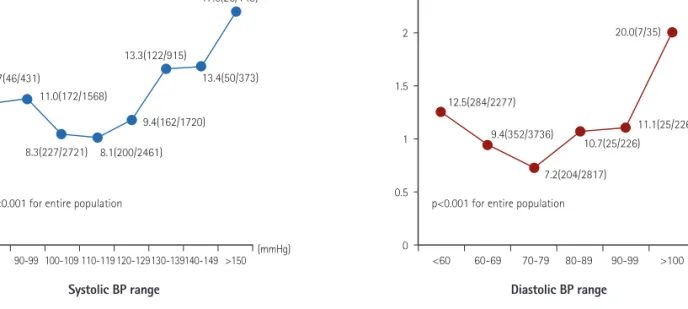
Additionally, total MACE rates were analyzed after patients were grouped according to SBP and DBP ranges (divided by 10 mmHg ranges). In general, plotting MACE rates against BP ranges showed a U-shaped relation (Fig. 6), just as when the patients were divided into quintiles. The BP ranges with the lowest MACE rates were 110- 119 mmHg for SBP and 70-79 mmHg for DBP. While the U-shaped relation showed a broad base with similar MACE rates for SBPs between 100 and 129 mmHg, the curve had a sharp base with a remarkably lower MACE rate for DBPs of 70-79 mmHg.
Discussion
The results of this study suggest that excessive lowering of BP during clinical follow up in patients with acute MI can lead to a worse outcome. Although hypertension is an independent predictor of death and MI
11)and is a predictor of in-hospital mortality in patients with acute MI,
12)specific BP targets have not been set in patients with acute coronary syndrome since specific BP lowering trials have not been performed.
Although lowering the BP can decrease cardiac workload and improve cardiac function by reducing cardiac afterload, there is concern that excessive BP lowering can impair coronary perfusion.
This can be especially important in patients with acute MI, as they have reduced coronary flow reserve compared to the general healthy population.
13)Even after a successful revascularization procedure, hearts of patients with acute MI can still have residual
Group 1 Group 2 Group 3 Group 4 Group 5 p<0.001 for entire population
*p<0.05 between all groups, except between group 2,3,4 1.923
(1.503-2.398)
1.267 (1.091-1.647)
1
*
2.041 (1.597-2.531)
1.201 (0.898-1.521) 2.5
2
1.5
1
0.5
0
Systolic BP group
Group 1 Group 2 Group 3 Group 4 Group 5 p<0.001 for entire population
p<0.05 between all groups
Diastolic BP group 1.923
(1.503-2.403)
1.401 (1.103-1.719)
1.296 (0.928-1.498)
1 1.572 (1.256-2.114) 2.5
2
1.5
1
0.5
0
Fig. 5. Odds ratio for MACE occurrence compared to the third (SBP) and the fourth (DBP) quintiles. Values in each group are presented as the odds ratio
(95% confidence interval). MACE: major adverse cardiac events, BP: blood pressure, SBP: systolic blood pressure, DBP: diastolic blood pressure.
ischemic burden due to several causes, such as untreated segments of target or non-target vessels or ischemia from microvascular causes even in the absence significant residual coronary arterial stenosis. In such circumstances, BP that is too low (especially DBP) can cause ischemic symptoms and necessitate additional revascularization procedures during clinical follow up, as reflected in our results.
We still do not know if a lower BP threshold will cause harm to coronary blood flow in humans.
1)Despite some animal experiments conducted on lower BP threshold, clinical trials and observational studies should be the primary sources of information to define this threshold. An analysis of the International Verapamil SR- Trandolapril Study (INVEST) suggested that the relation between MACE rate and SBP was J-shaped, with the SBP/DBP nadir at approximately 125-145/55-80 mmHg in hypertensive patients with previous (≥1 month) history of coronary revascularization (coronary arterial bypass graft, PCI, or both).
14)Additionally, in other trials, such as the Secondary Manifestations of Arterial Disease (SMART) study, similar J-shaped curves between BP and cardiovascular events were observed, with a BP nadir of 143/82 mmHg in patients with various manifestations of vascular disease.
15)However, in the Comparison of Amlodipine vs. Enalapril to Limit Occurrences of Thrombosis (CAMELOT) study, patients with CAD did not exhibit a J-shaped curve.
16)In the recent Systolic Blood Pressure Intervention Trial (SPRINT), targeting a SBP less than 120 mmHg, as opposed to the typical target of less than 140 mmHg, resulted in lower rates of fatal and nonfatal major cardiovascular events from any cause in patients with SBP >130 mmHg and increased cardiovascular risk
from proven cardiovascular disease, chronic kidney disease, old age, etc.
17)Therefore, insufficient evidence has confirmed the concept of the J-shaped curve.
In our study, we present evidence for the existence of the
‘U-shaped curve phenomenon,’ which is similar to the J-shaped curve with respect to both SBP and DBP for secondary prevention of adverse events after acute MI. Although this conclusion is limited by the study’s observational nature, certain methodological errors and several confounding factors, such as patient age, different prevalence of cardiovascular risk factors, and underlying comorbidities, it is noteworthy that ‘excessively low’ BP, with a nadir at 111.2/73.3 mmHg (group 3 for SBP, group 4 for DBP), was shown to be an independent risk factor of MACE in patients with acute MI after successful PCI. This does not imply that high BP in patients with acute MI should not be controlled. Just as the SPRINT demonstrated, our results showed that patients with an average SBP of 100-119 mmHg had a notably lower MACE rate than those with average SBP of 130-139 mmHg. Also, patients with prior history of hypertension had significantly higher MACE rate than those without, despite similar BP control, which emphasizes the importance of hypertension in the prognosis of CAD. Multiple mechanisms, such as upregulation of the sympatho-renin-angiotensin- aldosterone system, downregulation of vasodilators, and increased expression of inflammatory cytokines, contribute to BP elevation and related target-organ damage.
1)Therefore, high BP should be lowered to a range that causes no significant harm from hypotension.
In this study, patients in lower BP quintiles (groups 1 and 2)
<90 90-99 100-109 110-119120-129130-139140-149 >150 p<0.001 for entire population
10.7(46/431)
11.0(172/1568)
8.3(227/2721) 8.1(200/2461) 9.4(162/1720)
13.4(50/373) 13.3(122/915)
17.6(26/148) 20
18 16 14 12 10 8 6 4 2 0
Systolic BP range
(mmHg) (mmHg)
<60 60-69 70-79 80-89 90-99 >100 p<0.001 for entire population
Diastolic BP range 12.5(284/2277)
9.4(352/3736)
7.2(204/2817) 20.0(7/35)
10.7(25/226) 11.1(25/226) 2.5
2
1.5
1
0.5
0
Fig. 6. Two-year cumulative incidence of MACE according to blood pressure range. Values in each group are presented as MACE rate (%) (number of