INTRODUCTION
Metabolic syndrome (MetS), also known as syndrome X or in-
sulin resistance, is a growing health problem, with increasing prevalence in Asian countries and in the U.S.1 MetS is a multi- ple risk factor for type 2 diabetes, atherosclerotic cardiovascu- lar disease, and non-alcoholic fatty liver disease.2 The causes of MetS are excessive energy intake, physical inactivity, seden- tary lifestyle, excessive alcohol use, aging, disrupted sleep, mood disorder, psychotropic medication use, and genetics.3-8 The World Health Organization Expert Consultation reported that MetS is a pre-morbid condition, rather than a clinical diagnosis, as well as an educational concept involving a complex multi- factorial health problem.9
Lifestyle modifications, such as an energy-restricted diet and physical activity, are strategies to prevent the development of
Leisure Time Physical Activity to Reduce Metabolic Syndrome Risk: A 10-Year Community-Based
Prospective Study in Korea
Hoon Jo1,2, Jang-Young Kim3,4, Min-Ye Jung5, Yeon-Soon Ahn2,4, Sei-Jin Chang2,6, and Sang-Baek Koh2,6
1Department of Medical Science, Yonsei University Graduate School, Seoul;
2Department of Preventive Medicine, Yonsei University Wonju College of Medicine, Wonju;
3Department of Cardiology, Yonsei University Wonju College of Medicine, Wonju;
4Institute of Genomic Cohort, Yonsei University Wonju College of Medicine, Wonju;
5Department of Occupational Therapy, Yonsei University College of Health Science, Wonju;
6Institute of Occupational & Environmental Medicine, Yonsei University Wonju College of Medicine, Wonju, Korea.
Purpose: Metabolic syndrome (MetS) is a major public health problem related to increased risks of cardiovascular disease and type 2 diabetes. We investigated whether recommended levels of leisure time physical activity (LTPA) decrease the risk of MetS in a community-based prospective cohort study (Ansung and Ansan cohort).
Materials and Methods: A total of 3910 adults (1890 men, 2020 women) without MetS examined in 2001–2002 (baseline) were included in this study and followed up from 2013 to 2014. We measured LTPA energy expenditure using the standard metabolic equivalent value [metabolic equivalent of task (MET)-h/wk]. Individuals were categorized into five groups (physically inactive, 0.1 to <7.5, 7.5 to <15.0, 15.0 to <22.5, 22.5 to <40.0, and ≥40.0 MET-h/wk).
Results: The mean follow-up period was 11.8 years. Among the cohort, 482 men (25.5%) and 541 women (26.8%) were diagnosed with newly developed MetS. Multivariate logistic analysis revealed a 4.4% lower MetS risk among those performing two to three times the recommended minimum of 7.5 MET-h/wk [multivariate relative risk (RR), 0.956; 95% confidence interval (CI), 0.654–
1.398] and a 21.9% lower risk among those performing three to four times the physical activity minimum (multivariate RR, 0.781;
95% CI, 0.574–1.063). This association was only significant in females performing three to four times the minimum (crude RR, 0.655; 95% CI, 0.432–0.994).
Conclusion: We noted that physical activity at more than 2 times the recommended minimum prevents MetS. Healthcare profes- sionals should encourage inactive adults to be physically active during their leisure time to take advantage of its health benefits.
Key Words: Physical activity, metabolic syndrome, relative risk, Korea, exercise
pISSN: 0513-5796 · eISSN: 1976-2437
Received: November 28, 2019 Revised: January 30, 2020 Accepted: February 5, 2020
Corresponding author: Sang-Baek Koh, MD, PhD, Department of Preventive Medi- cine, Yonsei University Wonju College of Medicine, 20 Ilsan-ro, Wonju 26426, Korea.
Tel: 82-33-741-0345, Fax: 82-33-747-0409, E-mail: [email protected]
•The authors have no potential conflicts of interest to disclose.
© Copyright: Yonsei University College of Medicine 2020
This is an Open Access article distributed under the terms of the Creative Com- mons Attribution Non-Commercial License (https://creativecommons.org/licenses/
by-nc/4.0) which permits unrestricted non-commercial use, distribution, and repro- duction in any medium, provided the original work is properly cited.
Yonsei Med J 2020 Mar;61(3):218-228 https://doi.org/10.3349/ymj.2020.61.3.218
MetS.10 Several randomized controlled trials have shown that regular physical activity effectively prevents type 2 diabetes, while increasing the total physical activity volume decreases the development of MetS.11 An analysis of the dose-response association between physical activity and incident hyperten- sion in cohort studies showed that every 10 metabolic equiva- lent of task (MET) h/wk increase in leisure time physical activ- ity (LTPA) reduced the risk of hypertension, a component of MetS, by 6%.12
The 2018 Physical Activity Guidelines for Americans distrib- uted by the U.S. federal government recommend 150–300 minutes of moderate-intensity or 75–150 minutes of vigorous- intensity activity a week to achieve substantial health benefits.13 Researchers reported that, compared to individuals not per- forming LTPA, those performing three to five times the mini- mum MET h/wk of physical activity recommended by the Phys- ical Activity Guidelines for Americans demonstrated a 39%
lower mortality risk.14 For Koreans, the prevalence of MetS has shown an increasing tendency among men 19–49 years since 2007 and nearly 40% women aged over 60 years have MetS.15 To prevent cardiovascular events, type 2 diabetes mellitus, chronic kidney disease, cancer, and even all-cause mortality as- sociated with MetS, an appropriate physical activity recom- mendation must be established for Koreans.16,17 However, few observational and prospective studies examining the associa- tion between physical activity and the incidence of MetS for Koreans have been published.
Thus, the goal of this study was to investigate the association between LTPA levels and the incidence of MetS over 10 years of follow-up in Korean adults. We also evaluated the LTPA lev- els that might be recommendable to efficiently reduce the risk of MetS.
MATERIALS AND METHODS
Study population and design
We analyzed data from the Ansung-Ansan cohort within the Korean Genome Epidemiology Study (KoGES; 4851-302). The Ansung-Ansan cohort is a population-based prospective study that consists of people aged 40–69 years residing in a rural and urban community. This project was initiated in 2001 by the Ko- rea Centers for Disease Control to investigate the risk factors of various chronic disorders. Ansung-Ansan cohort participants were first recruited from 2001 to 2002 and comprised 10030 people aged 40–69 years with the same ethnic background.
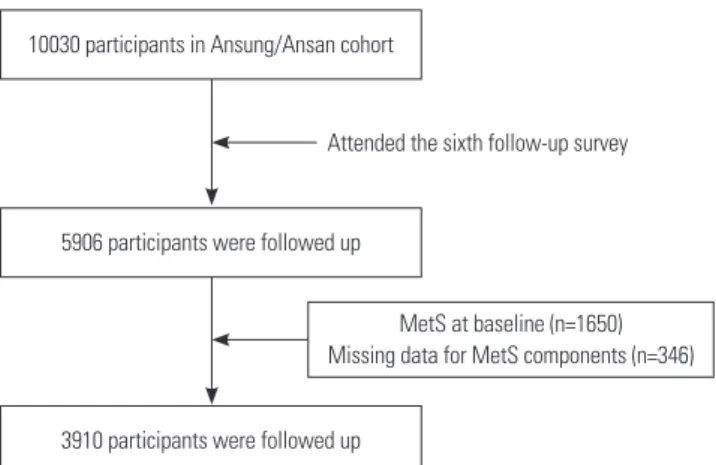
Every 2 years, the participants were re-examined; by the sixth follow-up (2013–2014), 5906 people participated. Among them, we excluded 1650 subjects who had more than three compo- nents of MetS and further excluded 346 subjects for whom data on MetS components were missing. After these exclusions, 3910 subjects were enrolled in the analysis (Fig. 1). At each ex- amination, all participants provided informed consent.
This study protocol was approved by the Institutional Re- view Board of Wonju Severance Christian Hospital (CR317305) and the Ethics Committee of the Korean Center for Disease Control (KoGES; 4851-302).
Data collection
A comprehensive health examination and health-related in- terview were completed by all participants. The health exami- nation included the collection of biological specimens and anthropometric indices for assessment. The health-related in- terview was performed using a questionnaire covering family disease history, medication use, and lifestyle characteristics, such as alcohol use and smoking status. All tests and inter- views were conducted by health professionals who followed a standardized protocol using required instruments to collect the data. Detailed information about the data collection pro- cedure is available in a previous report.18
Definition of MetS
This study defined MetS in accordance with the worldwide consensus criteria of MetS issued by the International Diabe- tes Federation, American Heart Association, National Heart, Lung, and Blood Institute, International Atherosclerosis Soci- ety, World Heart Federation, and International Association for the Study of Obesity modified National Cholesterol Education Program Adult Treatment Panel III (NCEP-ATP III).3 MetS was defined as the presence of three or more of the following components: 1) abdominal obesity, defined as a waist cir- cumference ≥90 cm for males or ≥85 cm for females (follow- ing Korean specific cut-offs for abdominal obesity defined by the Korean Society of Obesity)19; 2) high blood pressure, de- fined as a systolic blood pressure ≥130 mm Hg and a diastolic blood pressure ≥85 mm Hg or treatment with antihypertensive agents; 3) hypertriglyceridemia, defined as a serum triglyceride concentration ≥150 mg/dL or specific treatment for this lipid abnormality; 4) low high-density lipoprotein (HDL) choles- terol level, defined as a serum HDL cholesterol concentration
<40 mg/dL for males or <50 mg/dL for females, or specific treat- 10030 participants in Ansung/Ansan cohort
5906 participants were followed up
3910 participants were followed up
MetS at baseline (n=1650) Missing data for MetS components (n=346) Attended the sixth follow-up survey
Fig. 1. Study population. MetS, metabolic syndrome.
ment for this lipid abnormality; 5) high fasting glucose level, defined as a fasting serum glucose level ≥100 mg/dL or cur- rent use of antidiabetic medication.
LTPA assessment
LTPA was assessed using a questionnaire to quantify activities in the leisure time domain. All participants were asked the types, duration, and frequency of LTPA performed. LTPA levels were determined by calculating MET-h/wk as the time spent exercising/week and assigning a weight based on exercise in- tensity.20,21 The MET is an objective rate measure of the amount of physical activity performed, and the intensities of physical activities were standardized according to the Compendium of Physical Activities.21
LTPA volume (MET h/wk) was calculated by multiplying the median or midpoint of duration and frequency of the per- formed LTPA by the reported intensity of that LTPA category by its assigned MET value. One MET is defined as 1 kcal/kg/h and is considered the resting metabolic rate during quiet sitting (1 MET=3.5 mL/kg/min of oxygen consumption).20 LTPA vol- ume (MET h/wk) was calculated in this study as follows:
*LTPA volume = performed LTPA’s MET value × duration (minutes) × frequency (number of days per week).
There were nine types of LTPAs in the Ansung-Ansan cohort at baseline: aerobics, jogging, swimming, tennis, golf, bowling, fitness club exercise, walk, and climbing.
Statistical analysis
To analyze the relationship between LTPA levels and MetS, we counted the numbers and percentiles of demographic char- acteristics for the participants at the first examination for comparison between the normal and MetS groups during the follow-up period. The chi-square test was performed to esti- mate differences between two groups according to covariates and to calculate p values. Mean values of each LTPA volume type between two groups were compared using Student’s t-test. The chi-square test, as a non-parametric statistic, was used for cat- egorical variables, while Student’s t-test, as a parametric statis- tic, was used for normally distributed variables.
Furthermore, we performed multivariate-adjusted logistic regression analysis to generate relative risks (RRs) and 95%
confidential intervals (CIs) for LTPA levels and MetS incidence.
We categorized LTPA volume into five categories for MET-h/
wk (0, 0.1 to <7.5, 7.5 to <15.0, 15.0 to <22.5, 22.5 to <40.0, and
≥40.0). These five categories were established to reflect multi- ple levels of the minimum recommendation of Physical Activi- ty Guidelines for American and ranged from one to two times the recommended minimum (7.5 to <15.0 MET-h/wk) to up to five or more times the recommended levels (≥40.0 MET-h/
wk).22 The first model was a crude model in which the RR of MetS incidence associated with higher LTPA levels versus the
lowest LTPA level (i.e., physically inactive during leisure time at 0 MET-h/wk). Final models were adjusted for sex, age, edu- cational level, income level, marital status, smoking status, al- cohol use, and body mass index.
All statistical tests were two-sided, and statistical signifi- cance was considered at values of p<0.05. All analyses were conducted using the R statistical package version 3.6.123 and Jamovi ver. 1.0.5.0.24
RESULTS
Among the 3910 participants included in this study analysis, MetS developed in 1023 (26.2%) during the 10-year follow-up period. The mean follow-up period was 11.8 years. Table 1 shows the baseline characteristics of the participants according to MetS incidence. Participants with MetS were older, less edu- cated, had less income, were smokers, and had a higher body mass index. These differences between groups were greater among females than males (Table 1). We also compared LTPA participation and quantities according to MetS incidence (Ta- ble 2). For this comparison analysis, we excluded participants reporting no LTPA in the assessment of total LTPA MET-h/wk.
Of the 2887 participants in the normal group, 139 (4.8%) and 52 (1.8%) participants reported swimming and golf as LTPAs, compared to the MetS incidence group [n=29 (2.8%) and n=
10 (1.0%), respectively]. Regarding the performed LTPA quan- tities, the normal group performed more LTPA in aerobics, swimming, golf, and climbing than those in the MetS incidence group (mean METs were 22.0, 27.9, 25.4, and 25.3 MET-h/wk among the normal group and 18.8, 26.0, 17.3, and 23.2 MET- h/wk among the MetS incidence group, respectively). When assessing total LTPA participation and performed LTPA quan- tities between the two groups among females, the normal group was more likely to participate in LTPA, while the total average quantity of LTPA was larger in the MetS group than normal group among males (Table 2).
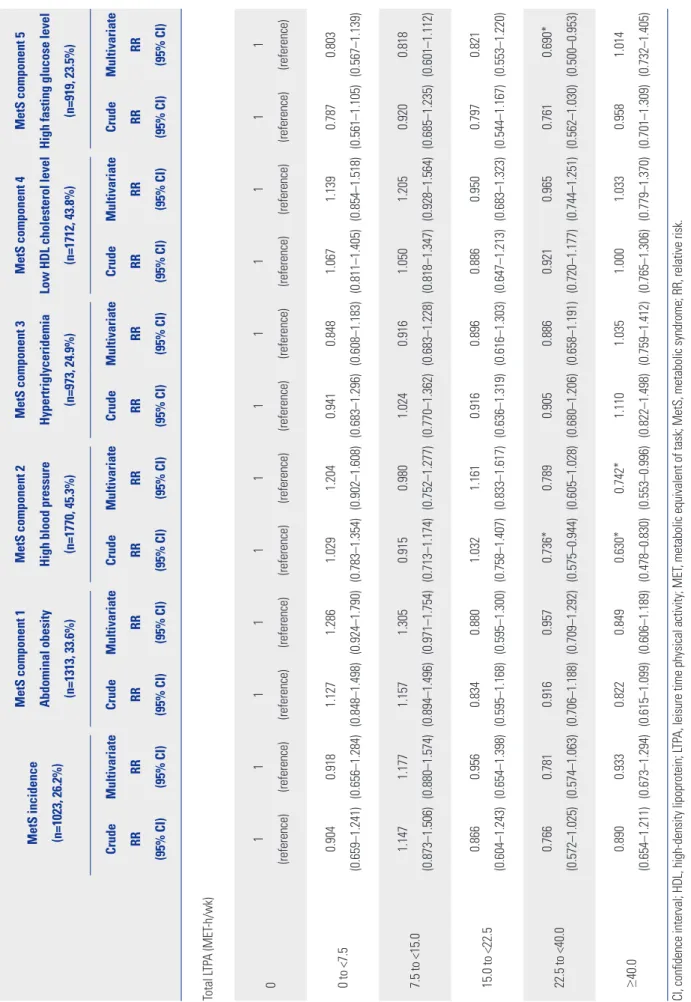
Table 3 shows the results of multivariate logistic regression analysis assessing the association between changes in LTPA levels and the incidence of MetS after the adjustment for re- lated covariates. High blood pressure was most common in this study, and the presence of a high fasting glucose level was the least common MetS risk factor [n=1770 (45.3%) and n=
919 (23.5%), respectively]. As the category of total volume of LTPA levels increased, there was trend of a decreased likelihood of developing MetS. Although this was not significant, we ob- served a 13.4% lower risk of MetS in those performing LTPA at two to three times the recommended minimum (15.0 to <22.5 MET-h/wk: RR, 0.87; 95% CI, 0.60–1.24), and this association grew stronger at three to five times the minimum (22.5 to <40.0 MET-h/wk: RR, 0.77; 95% CI, 0.57–1.03). The multivariate ad- justed analysis also showed this trend, although this relation- ship was also insignificant (15.0 to <22.5 MET-h/wk: RR, 0.96;
95% CI, 0.65–1.40; and 22.5 to <40.0 MET-h/wk: RR, 0.78; 95%
CI, 0.57–1.06, respectively). In analyses of LTPA and MetS inci- dence, we found an inverse trend among participants perform- ing five or more times the recommended minimum (≥40.0 MET-h/wk), compared with lower levels of total LTPA (crude RR, 0.89; 95% CI, 0.65–1.21; adjusted RR, 0.93; 95% CI, 0.67–
1.29). In stratified analyses of MetS risk factors, a positive asso- ciation was found at one to two times the recommended mini- mum or higher levels. In univariate logistic regression analysis, associations for three to five times (22.5 to <40.0 MET-h/wk) and for more than five times (≥40.0 MET-h/wk) the recom- mended minimum with the presence of high blood pressure were significant. However, only more than five times (≥40.0
MET-h/wk) the minimum was significant after adjustment for related covariates (≥40.0 MET-h/wk: RR, 0.74; 95% CI, 0.55–
1.00). We also found that participants performing three to five times (22.5 to <40.0 MET-h/wk) the minimum had a 31% low- er risk of having a high fasting glucose after adjustment (ad- justed RR, 0.69; 95% CI, 0.50–0.95).
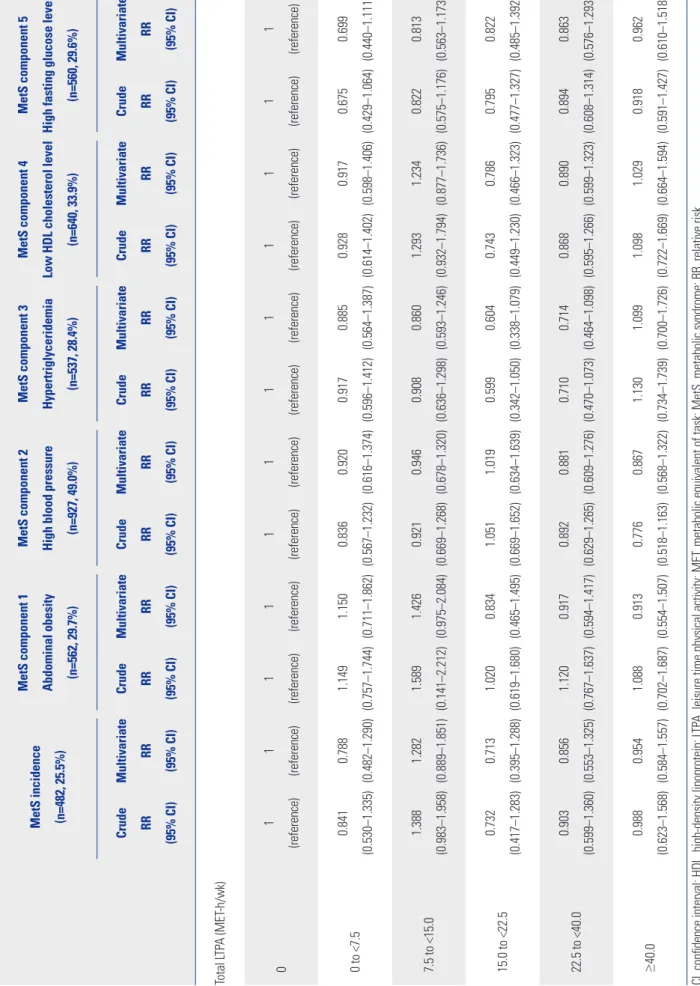
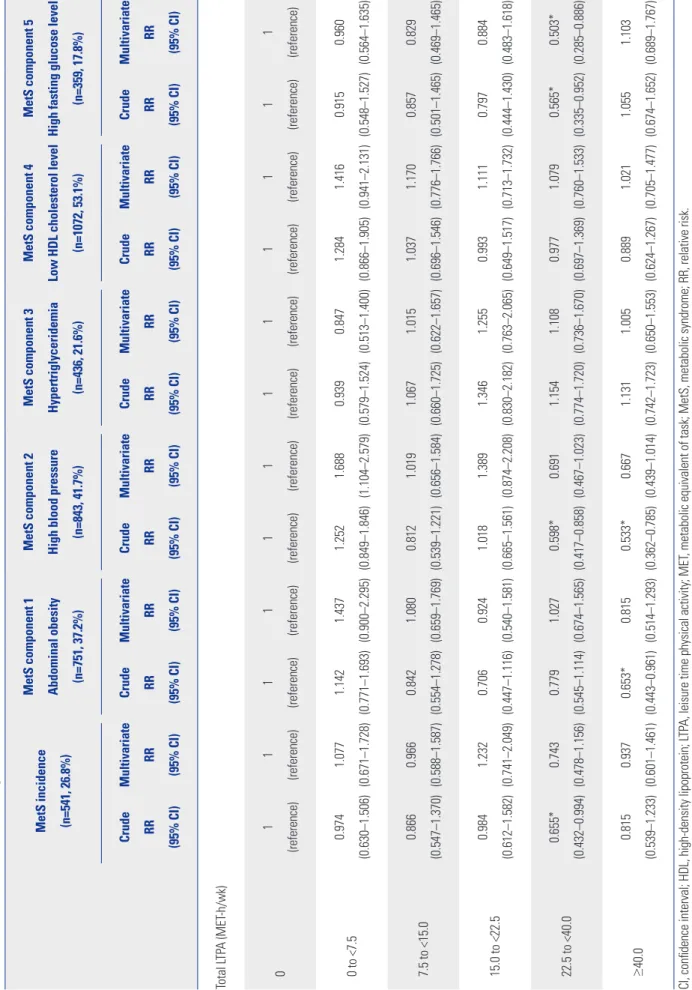
Tables 4 and 5 show the RRs of MetS incidence by sex strati- fication. Compared with no baseline LTPA, more than two times the recommended minimum might be associated with lower risk of MetS and MetS components. This association was stronger in females than males. We observed a 34.5% lower risk of MetS significantly among participants performing three to five times (22.5 to <40.0 MET-h/wk) the minimum in fe- Table 1. Characteristics of the Participants according to MetS Incidence
Total (n=3910) Male (n=1890) Female (n=2020)
Normal
(n=2887) MetS
(n=1023) p value Normal
(n=1408) MetS
(n=482) p value Normal
(n=1479) MetS
(n=541) p value
Age (yr) <0.001* 0.967 <0.001*
<50 1776 (61.5) 537 (52.5) 814 (57.8) 277 (57.5) 962 (65.0) 260 (48.1)
50–59 677 (23.4) 283 (27.7) 353 (25.1) 120 (24.9) 324 (21.9) 163 (30.1)
≥60 434 (15.0) 203 (19.8) 241 (17.1) 85 (17.6) 193 (13.0) 118 (21.8)
Education level <0.001* 0.160 <0.001*
Elementary school graduate 598 (20.8) 296 (29.1) 204 (14.6) 76 (15.8) 394 (26.7) 220 (40.9)
Middle school graduate 673 (23.4) 236 (23.2) 285 (20.3) 100 (20.8) 388 (26.3) 136 (25.3)
High school graduate 1101 (38.3) 362 (35.6) 552 (39.4) 205 (42.7) 549 (37.2) 157 (29.2)
College graduate or higher 503 (17.5) 124 (12.2) 360 (25.7) 99 (20.6) 143 (9.7) 25 (4.6)
Income level (KRW/month) <0.001* 0.586 <0.001*
<0.9 million 676 (23.7) 304 (30.1) 303 (21.7) 101 (21.1) 373 (25.7) 203 (38.3)
1.0–1.9 million 902 (31.7) 329 (32.6) 432 (30.9) 165 (34.4) 470 (32.4) 164 (30.9)
2.0–2.9 million 630 (22.1) 203 (20.1) 311 (22.2) 107 (22.3) 319 (22.0) 96 (18.1)
3.0–3.9 million 356 (12.5) 100 (9.9) 191 (13.7) 58 (12.1) 165 (11.4) 42 (7.9)
≥4.0 million 283 ( 9.9) 73 (7.2) 161 (11.5) 48 (10.0) 122 (8.4) 25 (4.7)
Marital status 0.122 0.390 0.202
Unmarried 35 (1.2) 11 (1.1) 26 (1.8) 6 (1.2) 9 (0.6) 5 (35.7)
Married 2692 (93.4) 936 (91.7) 1356 (96.4) 461 (95.8) 1336 (90.6) 475 (88.0)
Widow or widower 102 (3.5) 53 (5.2) 11 (0.8) 6 (1.2) 91 (6.2) 47 (8.7)
Other 52 (1.8) 21 (2.1) 14 (1.0) 8 (1.7) 38 (2.6) 13 (2.4)
Smoking status 0.013* <0.001* 0.224
Non-smoker 1733 (60.6) 603 (59.4) 323 (23.0) 89 (18.5) 1410 (96.8) 514 (96.3)
Ex-smoker 475 (16.6) 140 (13.8) 465 (33.1) 132 (27.4) 10 (0.7) 8 (1.5)
Current smoker 654 (22.9) 272 (26.8) 617 (43.9) 260 (54.1) 37 (2.5) 12 (2.2)
Alcohol use 0.390 0.930 0.047*
Non-drinker 1280 (44.5) 428 (42.0) 266 (18.9) 88 (18.3) 1014 (69.0) 340 (63.2)
Ex-drinker 152 (5.3) 57 (5.6) 117 (8.3) 42 (8.8) 35 (2.4) 15 (2.8)
Current drinker 1443 (50.2) 533 (52.4) 1023 (72.8) 350 (72.9) 420 (28.6) 183 (34.0)
Body mass index (kg/m2) <0.001* <0.001* <0.001*
<24.9 2106 (73.0) 509 (49.8) 1044 (74.1) 245 (50.8) 1062 (71.9) 264 (48.8)
25.0–29.9 743 (25.8) 463 (45.3) 356 (25.3) 224 (46.5) 387 (26.2) 239 (44.2)
≥30 36 (1.2) 51 (5.0) 8 (0.6) 13 (2.7) 28 (1.9) 38 (7.0)
KRW, Korean won; MetS, metabolic syndrome.
Data are given as n (%) for categorical variables for available multiple data.
*Statistically significant difference according to chi-squared test.
males (crude RR, 0.66; 95% CI, 0.43–0.99). Abdominal obesity (crude RR, 0.65; 95% CI, 0.44–0.96) and high blood pressure (crude RR, 0.53; 95% CI, 0.36–0.79), which are MetS compo- nents, also had significant association with LTPA of more than 5 times the minimum (≥40.0 MET-h/wk). Regarding high fast- ing glucose level, the significant association was remained after adjustment for LTPA of three to five times (22.5 to <40.0 MET- h/wk) the minimum (crude RR, 0.57; 95% CI, 0.34–0.95; adjust- ed RR, 0.50; 95% CI, 0.29–0.89).
DISCUSSION
In the present study, we assessed the relationship between to- tal LTPA levels and the incidence of MetS in Korean adults
among the Ansung-Ansan cohort community-based prospec- tive study. Our main finding was that the relative risk of MetS decreased as total LTPA levels increased, although the differ- ence was not statistically significant. The 3 to 5 times level (22.5 to <40.0 MET-h/wk), the recommended minimum of 7.5 met- abolic-equivalent hours per week, reduced the risk of MetS by 21.9%. Furthermore, participants who performed more than three times the minimum recommended activity had a signif- icantly lower risk of high blood pressure, an abnormal MetS component. We also found that more than three times the rec- ommendation of LTPA could reduce MetS risk significantly in women, as well as the risk of abdominal obesity, high blood pressure, and high fasting glucose level. In terms of LTPA vol- ume, performing three times the recommended minimum was associated with a lower risk of MetS incidence and abnor- Table 2. Differences in LTPA Volume according to MetS Incidence
Total (n=3910) Male (n=1890) Female (n=2020)
Normal
(n=2887) MetS
(n=1023) p value Normal
(n=1408) MetS
(n=482) p value Normal
(n=1479) MetS
(n=541) p value LTPA volume
Aerobic, n (%) 28 (1.0) 7 (0.7) 4 (0.3) 1 (0.2) 24 (1.6) 6 (1.1)
MET-h/wk, mean (95% CI) 22.0
(17.1–27.0) 18.8
(10.5–27.0) 0.523 16.3
(3.4–29.3) 10.3
- 0.555 23.0
(17.4–28.6) 20.2
(10.9–29.4) 0.619
Jogging, n (%) 136 (4.7) 52 (5.1) 83 (5.9) 32 (6.6) 53 (3.6) 20 (3.7)
MET-h/wk, mean (95% CI) 25.7 (22.4–29.1)
29.2
(22.8–35.6) 0.311 24.6 (20.5–28.6)
29.2
(21.0–37.5) 0.262 27.6 (21.6–33.6)
29.1
(18.0–40.2) 0.795
Swimming, n (%) 139 (4.8) 29 (2.8) 30 (2.1) 5 (1.0) 109 (7.4) 24 (4.4)
MET-h/wk, mean (95% CI) 27.9
(25.5–30.3) 26.0
(21.0–31.1) 0.517 26.8
(20.5–33.0) 36.5
(21.6–51.3) 0.222 28.2
(25.6–30.9) 23.7
(18.4–29.1) 0.149
Tennis, n (%) 31 (1.1) 12 (1.2) 27 (1.9) 10 (2.1) 4 (0.3) 2 (0.4)
MET-h/wk, mean (95% CI) 37.3 (29.2–45.4)
49.4
(34.0–64.7) 0.127 35.6 (26.6–44.6)
43.9
(27.6–60.2) 0.330 49.0 (24.7–73.4)
76.7
- 0.037*
Golf, n (%) 52 (1.8) 10 (1.0) 43 (3.1) 9 (1.9) 9 (0.6) 1 (0.2)
MET-h/wk, mean (95% CI) 25.4 (21.4–29.5)
17.3
(11.9–22.8) 0.090 24.3 (20.3–28.2)
17.5
(11.3–23.6) 0.137 31.1 (15.6–46.5)
16.2
- 0.502
Bowling, n (%) 18 (0.6) 6 (0.6) 9 (0.6) 4 (0.8) 9 (0.6) 2 (0.4)
MET-h/wk, mean (95% CI) 8.0
(4.8–11.2) 14.8
(-2.4–32.1) 0.144 7.7
(4.2–11.1) 12.0
(-13.6–37.6) 0.631 8.3
(1.9–14.6) 20.6
(-174.7–216.0) 0.568
Fitness club exercise, n (%) 112 (3.9) 28 (2.7) 70 (5.0) 19 (3.9) 42 (2.8) 9 (1.7)
MET-h/wk, mean (95% CI) 25.6 (22.5–28.7)
30.2
(23.5–36.8) 0.200 22.2 (18.6–25.8)
28.5
(19.4–37.6) 0.130 31.2 (25.7–36.7)
33.6
(23.4–43.9) 0.706
Walk, n (%) 243 (8.4) 80 (7.8) 117 (8.3) 37 (7.7) 126 (8.5) 43 (7.9)
MET-h/wk, mean (95% CI) 11.8
(10.5–13.1) 11.7
(9.7–13.8) 0.965 11.2
(9.4–13.0) 12.7
(9.7–15.7) 0.400 12.3
(10.6–14.1) 10.9
(7.9–13.8) 0.405
Climbing, n (%) 226 (7.8) 93 (9.1) 118 (8.4) 48 (10.0) 108 (7.3) 45 (8.3)
MET-h/wk, mean (95% CI) 25.3
(23.0–27.7) 23.2
(19.3–27.1) 0.338 20.9
(18.0–23.9) 17.2
(12.6–21.9) 0.179 30.3
(26.7–33.8) 29.7
(23.7–35.6) 0.865
Total LTPA, n (%) 896 (31.0) 298 (29.1) 451 (32.0) 155 (32.2) 445 (30.1) 143 (26.4)
MET-h/wk, mean (95% CI) 24.5 (23.2–25.7)
23.9
(21.6–26.3) 0.328 22.8 (21.1–24.5)
23.2
(19.9–26.6) 0.817 26.1 (24.3–28.0)
24.7
(21.5–27.9) 0.448 CI, confidence interval; LTPA, leisure time physical activity; MET, metabolic equivalent of task; MetS, metabolic syndrome.
Data are given as n (%) for categorical variables and means (95% CI) for continuous variables.
*Statistically significant difference according to independent t-test.
Table 3. RRs of MetS Incidence according to LTPA Level and Related Covariates (Total) MetS incidence (n=1023, 26.2%) MetS component 1 Abdominal obesity (n=1313, 33.6%) MetS component 2 High blood pressure (n=1770, 45.3%) MetS component 3 Hypertriglyceridemia (n=973, 24.9%) MetS component 4 Low HDL cholesterol level (n=1712, 43.8%)
MetS component 5 High fasting glucose level (n=919, 23.5%) Crude RR (95% CI)
Multivariate RR (95% CI)
Crude RR (95% CI)
Multivariate RR (95% CI)
Crude RR (95% CI)
Multivariate RR (95% CI)
Crude RR (95% CI)
Multivariate RR (95% CI)
Crude RR (95% CI)
Multivariate RR (95% CI)
Crude RR (95% CI)
Multivariate RR (95% CI) Total LTPA (MET-h/wk) 01 (reference)
1 (reference)
1 (reference)
1 (reference)
1 (reference)
1 (reference)
1 (reference)
1 (reference)
1 (reference)
1 (reference)
1 (reference)
1 (reference) 0 to <7.50.904 (0.659–1.241)
0.918 (0.656–1.284) 1.127 (0.848–1.498) 1.286 (0.924–1.790) 1.029 (0.783–1.354) 1.204 (0.902–1.608) 0.941 (0.683–1.296) 0.848 (0.608–1.183) 1.067 (0.811–1.405) 1.139 (0.854–1.518) 0.787 (0.561–1.105)
0.803 (0.567–1.139) 7.5 to <15.01.147 (0.873–1.506)
1.177 (0.880–1.574) 1.157 (0.894–1.496) 1.305 (0.971–1.754) 0.915 (0.713–1.174) 0.980 (0.752–1.277) 1.024 (0.770–1.362) 0.916 (0.683–1.228) 1.050 (0.818–1.347) 1.205 (0.928–1.564) 0.920 (0.685–1.235)
0.818 (0.601–1.112) 15.0 to <22.50.866 (0.604–1.243)
0.956 (0.654–1.398) 0.834 (0.595–1.168) 0.880 (0.595–1.300) 1.032 (0.758–1.407) 1.161 (0.833–1.617) 0.916 (0.636–1.319) 0.896 (0.616–1.303) 0.886 (0.647–1.213) 0.950 (0.683–1.323) 0.797 (0.544–1.167)
0.821 (0.553–1.220) 22.5 to <40.00.766 (0.572–1.025)
0.781 (0.574–1.063) 0.916 (0.706–1.188) 0.957 (0.709–1.292) 0.736* (0.575–0.944) 0.789 (0.605–1.028) 0.905 (0.680–1.206) 0.886 (0.658–1.191) 0.921 (0.720–1.177) 0.965 (0.744–1.251) 0.761 (0.562–1.030)
0.690* (0.500–0.953) ≥40.00.890 (0.654–1.211)
0.933 (0.673–1.294) 0.822 (0.615–1.099) 0.849 (0.606–1.189) 0.630* (0.478–0.830) 0.742* (0.553–0.996) 1.110 (0.822–1.498) 1.035 (0.759–1.412) 1.000 (0.765–1.306) 1.033 (0.779–1.370) 0.958 (0.701–1.309)
1.014 (0.732–1.405) CI, confidence interval; HDL, high-density lipoprotein; LTPA, leisure time physical activity; MET, metabolic equivalent of task; MetS, metabolic syndrome; RR, relative risk. Multivariate RR was adjusted for sex, age, marital status, education, income, body mass index, smoking status, and alcohol use. *Statistically significant (p<0.05).
Table 4. RRs of MetS Incidence according to LTPA Level and Related Covariates (Male) MetS incidence (n=482, 25.5%) MetS component 1 Abdominal obesity (n=562, 29.7%) MetS component 2 High blood pressure (n=927, 49.0%) MetS component 3 Hypertriglyceridemia (n=537, 28.4%) MetS component 4 Low HDL cholesterol level (n=640, 33.9%)
MetS component 5 High fasting glucose level (n=560, 29.6%) Crude RR (95% CI)
Multivariate RR (95% CI)
Crude RR (95% CI)
Multivariate RR (95% CI)
Crude RR (95% CI)
Multivariate RR (95% CI)
Crude RR (95% CI)
Multivariate RR (95% CI)
Crude RR (95% CI)
Multivariate RR (95% CI)
Crude RR (95% CI)
Multivariate RR (95% CI) Total LTPA (MET-h/wk) 01 (reference)
1 (reference)
1 (reference)
1 (reference)
1 (reference)
1 (reference)
1 (reference)
1 (reference)
1 (reference)
1 (reference)
1 (reference)
1 (reference) 0 to <7.50.841 (0.530–1.335)
0.788 (0.482–1.290) 1.149 (0.757–1.744) 1.150 (0.711–1.862) 0.836 (0.567–1.232) 0.920 (0.616–1.374) 0.917 (0.596–1.412) 0.885 (0.564–1.387) 0.928 (0.614–1.402) 0.917 (0.598–1.406) 0.675 (0.429–1.064)
0.699 (0.440–1.111) 7.5 to <15.01.388 (0.983–1.958)
1.282 (0.889–1.851) 1.589 (0.141–2.212) 1.426 (0.975–2.084) 0.921 (0.669–1.268) 0.946 (0.678–1.320) 0.908 (0.636–1.298) 0.860 (0.593–1.246) 1.293 (0.932–1.794) 1.234 (0.877–1.736) 0.822 (0.575–1.176)
0.813 (0.563–1.173) 15.0 to <22.50.732 (0.417–1.283)
0.713 (0.395–1.288) 1.020 (0.619–1.680) 0.834 (0.465–1.495) 1.051 (0.669–1.652) 1.019 (0.634–1.639) 0.599 (0.342–1.050) 0.604 (0.338–1.079) 0.743 (0.449–1.230) 0.786 (0.466–1.323) 0.795 (0.477–1.327)
0.822 (0.485–1.392) 22.5 to <40.00.903 (0.599–1.360)
0.856 (0.553–1.325) 1.120 (0.767–1.637) 0.917 (0.594–1.417) 0.892 (0.629–1.265) 0.881 (0.609–1.276) 0.710 (0.470–1.073) 0.714 (0.464–1.098) 0.868 (0.595–1.266) 0.890 (0.599–1.323) 0.894 (0.608–1.314)
0.863 (0.576–1.293) ≥40.00.988 (0.623–1.568)
0.954 (0.584–1.557) 1.088 (0.702–1.687) 0.913 (0.554–1.507) 0.776 (0.518–1.163) 0.867 (0.568–1.322) 1.130 (0.734–1.739) 1.099 (0.700–1.726) 1.098 (0.722–1.669) 1.029 (0.664–1.594) 0.918 (0.591–1.427)
0.962 (0.610–1.518) CI, confidence interval; HDL, high-density lipoprotein; LTPA, leisure time physical activity; MET, metabolic equivalent of task; MetS, metabolic syndrome; RR, relative risk. Multivariate RR was adjusted for sex, age, marital status, education, income, body mass index, smoking status, and alcohol use.
Table 5. RRs of MetS Incidence according to LTPA Level and Related Covariates (Female) MetS incidence (n=541, 26.8%) MetS component 1 Abdominal obesity (n=751, 37.2%) MetS component 2 High blood pressure (n=843, 41.7%) MetS component 3 Hypertriglyceridemia (n=436, 21.6%) MetS component 4 Low HDL cholesterol level (n=1072, 53.1%)
MetS component 5 High fasting glucose level (n=359, 17.8%) Crude RR (95% CI)
Multivariate RR (95% CI)
Crude RR (95% CI)
Multivariate RR (95% CI)
Crude RR (95% CI)
Multivariate RR (95% CI)
Crude RR (95% CI)
Multivariate RR (95% CI)
Crude RR (95% CI)
Multivariate RR (95% CI)
Crude RR (95% CI)
Multivariate RR (95% CI) Total LTPA (MET-h/wk) 01 (reference)
1 (reference)
1 (reference)
1 (reference)
1 (reference)
1 (reference)
1 (reference)
1 (reference)
1 (reference)
1 (reference)
1 (reference)
1 (reference) 0 to <7.50.974 (0.630–1.506)
1.077 (0.671–1.728) 1.142 (0.771–1.693) 1.437 (0.900–2.295) 1.252 (0.849–1.846) 1.688 (1.104–2.579) 0.939 (0.579–1.524) 0.847 (0.513–1.400) 1.284 (0.866–1.905) 1.416 (0.941–2.131) 0.915 (0.548–1.527)
0.960 (0.564–1.635) 7.5 to <15.00.866 (0.547–1.370)
0.966 (0.588–1.587) 0.842 (0.554–1.278) 1.080 (0.659–1.769) 0.812 (0.539–1.221) 1.019 (0.656–1.584) 1.067 (0.660–1.725) 1.015 (0.622–1.657) 1.037 (0.696–1.546) 1.170 (0.776–1.766) 0.857 (0.501–1.465)
0.829 (0.469–1.465) 15.0 to <22.50.984 (0.612–1.582)
1.232 (0.741–2.049) 0.706 (0.447–1.116) 0.924 (0.540–1.581) 1.018 (0.665–1.561) 1.389 (0.874–2.208) 1.346 (0.830–2.182) 1.255 (0.763–2.065) 0.993 (0.649–1.517) 1.111 (0.713–1.732) 0.797 (0.444–1.430)
0.884 (0.483–1.618) 22.5 to <40.00.655* (0.432–0.994)
0.743 (0.478–1.156) 0.779 (0.545–1.114) 1.027 (0.674–1.565) 0.598* (0.417–0.858) 0.691 (0.467–1.023) 1.154 (0.774–1.720) 1.108 (0.736–1.670) 0.977 (0.697–1.369) 1.079 (0.760–1.533) 0.565* (0.335–0.952)
0.503* (0.285–0.886) ≥40.00.815 (0.539–1.233)
0.937 (0.601–1.461) 0.653* (0.443–0.961) 0.815 (0.514–1.293) 0.533* (0.362–0.785) 0.667 (0.439–1.014) 1.131 (0.742–1.723) 1.005 (0.650–1.553) 0.889 (0.624–1.267) 1.021 (0.705–1.477) 1.055 (0.674–1.652)
1.103 (0.689–1.767) CI, confidence interval; HDL, high-density lipoprotein; LTPA, leisure time physical activity; MET, metabolic equivalent of task; MetS, metabolic syndrome; RR, relative risk. Multivariate RR was adjusted for sex, age, marital status, education, income, body mass index, smoking status, and alcohol use. *Statistically significant (p<0.05).
mal MetS components for Korean adults.
As the Western lifestyle spreads worldwide, the prevalence of the MetS is increasing.1 The consumption of high-calorie, low-fiber fast food and decreases in physical activity due to in- creased transportation and sedentary lifestyle result in MetS.25 Approximately 20–25% of the worldwide adult population carry MetS risk factors.26 In the U.S., 29.2% of adults had MetS according to the National Health and Nutrition Examination Survey 1999–2006, and an increase in MetS prevalence was expected.27 For Korea, the prevalence of MetS in 2013–2015 was 20.3% and remained stable since 2007 on the Korea Na- tional Health and Nutrition Examination Surveys.15 The results of this prospective study reported a 26.2% MetS incidence.
These findings demonstrate that the increasing MetS trend has been maintained and remains a serious public health concern.
Moreover, preventive strategies to manage MetS risk factors are needed.
Performing physical activity regularly is associated with a reduced risk of mortality and influences life length.28,29 A pre- ceding study, which divided the total weekly minutes of moder- ate or vigorous physical activity into three categories (0, <150, and ≥150 min/wk), reported an almost two times higher risk of MetS occurrence than in those who performed more than 150 min/wk of physical activity.30 Another prior cross-sectional study found that the frequency of MetS was lower among those who reported performing moderate or vigorous physical activ- ity.31 A meta-analysis of prospective cohort studies revealed that a high LTPA level was associated with a significantly de- creased risk of MetS.32 We observed consistent findings to those of other studies, although the association between total LTPA level and MetS incidence in our study was not statistically sig- nificant.
In a previous study that investigated the association be- tween physical activity and MetS components, physical activi- ty was a protective factor for low levels of HDL cholesterol in re- gard to MetS.33 Another previous study stated that higher mean volume of physical activity exhibited inverse associations with all components of MetS, decreasing the presence of abdomi- nal obesity, hypertriglyceridemia, a high fasting glucose level, and a low HDL cholesterol level.34 Although some differences were found, our results are in line with those of a previous study suggesting beneficial effects of increasing physical activity on health. In perspectives of abdominal obesity and high blood pressure, the total volume of LTPA in the normal weight group was more than that of abdominal obesity and high blood pres- sure groups. This finding indicated that performing LTPA might be effective to manage abdominal circumference and blood pressure.
The strength of our study is that it reports results based on a large community-based sample of Koreans and uses long-term (10 years) follow-up data. Many studies have examined asso- ciations between physical activity and MetS incidence, although most had a cross-sectional design that could not obtain stronger
conclusions of the observed associations on causality.30,33,35-38
Our findings suggest that complying with the 2018 Physical Activity Guidelines for Americans (150–300 minutes of mod- erate-intensity or 75–150 minutes of vigorous-intensity activity a week) decreases the presence of some MetS components and that performing more than two or three times the mini- mum recommended activity is essential to maximizing health benefits.
There are some limitations to our study. First, the lack of an association between physical activity and MetS incidence was attributed to the lack of physical activity assessment in house- hold and occupational activities. Therefore, future studies are needed to collect information about everyday physical activi- ties (household, occupational, and lifestyle) to determine the optimal dose of physical activity (intensity, duration, and fre- quency) for reducing the risk of MetS. However, general house- hold or occupational activities consisting of nondynamic movements do not increase the cardiovascular burden and are insufficient to induce beneficial metabolic or cardiorespiratory effects.39 Additionally, the lack of a significant difference has been attributed to participants who aged more than 60 years and only 30% of them performed LTPA. As a result of this, there was not significant difference in total amount of LTPA between the normal and MetS groups, and multivariate logistic model had limits to clarify association. Second, the mechanisms by which LTPA may reduce the development of MetS are unclear.
We collected nine types of LTPAs and assessed the mean vol- ume performed of each. Although we compared the total LTPA volume by type, we found no notable differences except for the effect of swimming on high blood pressure. Third, self-report- ed questionnaire of physical activity could be considered a potential limitation and possible bias. We had a limitation in the use of standardized intensities because the questionnaire did not cover a detailed description of LTPA. We just used typi- cal standardized MET intensity. For this reason, there could be differences in MET assessment about each of the participants’
practical LTPA because of variances in the physical activities performed. Assessing physical activity using wearable devices may be used to measure energy expenditure in the future.
Fourth, we used only baseline data for physical activity assess- ment. Study participants may have changed their LTPA during the follow-up term. The Ansung-Ansan cohort was limited to LTPA measurement at baseline, therefore, we could not ana- lyze LTPA changes with follow up. Fifth, MetS is caused by vari- ous factors; therefore, just performing physical activity would not prevent it efficiently. High-carbohydrate diets and food patterns might be associated with MetS.40 Thus, dietary man- agement should remain a focus in MetS intervention.
Our study demonstrated that increasing LTPA was associat- ed with a lower risk of MetS and its components in a 10-year follow-up cohort study of Koreans. The total volume of LTPA impacted the risk of MetS. We suggest that performing more than two times the recommended minimum activity will pre-
vent MetS and aid in health management. Individuals should be encouraged to participate in high LTPA regularly to lower their risk of developing MetS. Further investigations are needed to establish whether overall physical activity, including house- hold, occupational, and other lifestyle activities, can contrib- ute to the prevention of MetS.
ACKNOWLEDGEMENTS
Data in this study were obtained from the Korean Genome and Epidemiology Study (KoGES; 4851-302), National Research In- stitute of Health, Centers for Disease Control and Prevention, Ministry for Health and Welfare, Korea.
AUTHOR CONTRIBUTIONS
Conceptualization: all authors. Data curation: Hoon Jo and Yeon-Soon Ahn. Formal analysis: Hoon Jo, Sei-Jin Chang, and Sang-Baek Koh.
Investigation: Hoon Jo and Jang-Young Kim. Methodology: Hoon Jo, Jang-Young Kim, and Sang-Baek Koh. Project administration: Hoon Jo.
Resources: Hoon Jo and Sang-Baek Koh. Software: Hoon Jo. Supervi- sion: Yeon-Soon Ahn and Sei-Jin Chang. Validation: Hoon Jo, Min-Ye Jung, and Sang-Baek Koh. Visualization: Hoon Jo. Writing—original draft: Hoon Jo. Writing—review & editing: Hoon Jo, Min-Ye Jung, Yeon-Soon Ahn, Sei-Jin Chang, and Sang-Baek Koh. Approval of final manuscript: all authors.
ORCID iDs
Hoon Jo https://orcid.org/0000-0003-3762-1540 Jang-Young Kim https://orcid.org/0000-0002-0813-7082 Min-Ye Jung https://orcid.org/0000-0001-7700-3451 Yeon-Soon Ahn https://orcid.org/0000-0002-0039-069X Sei-Jin Chang https://orcid.org/0000-0001-9347-3592 Sang-Baek Koh https://orcid.org/0000-0001-5609-6521
REFERENCES
1. Saklayen MG. The global epidemic of the metabolic syndrome.
Curr Hypertens Rep 2018;20:12.
2. Grundy SM. Metabolic syndrome: a multiplex cardiovascular risk factor. J Clin Endocrinol Metab 2007;92:399-404.
3. Alberti KG, Eckel RH, Grundy SM, Zimmet PZ, Cleeman JI, Dona- to KA, et al. Harmonizing the metabolic syndrome. Circulation 2009;120:1640-5.
4. Groop L. Genetics of the metabolic syndrome. Br J Nutr 2000;83 Suppl 1:S39-48.
5. Edwardson CL, Gorely T, Davies MJ, Gray LJ, Khunti K, Wilmot EG, et al. Association of sedentary behaviour with metabolic syn- drome: a meta-analysis. PLoS One 2012;7:e34916.
6. Xi B, He D, Zhang M, Xue J, Zhou D. Short sleep duration predicts risk of metabolic syndrome: a systematic review and meta-analy- sis. Sleep Med Rev 2014;18:293-7.
7. Vancampfort D, Correll CU, Wampers M, Sienaert P, Mitchell AJ, De Herdt A, et al. Metabolic syndrome and metabolic abnormalities in patients with major depressive disorder: a meta-analysis of preva- lences and moderating variables. Psychol Med 2014;44:2017-28.
8. Sun K, Ren M, Liu D, Wang C, Yang C, Yan L. Alcohol consump- tion and risk of metabolic syndrome: a meta-analysis of prospec-
tive studies. Clin Nutr 2014;33:596-602.
9. Simmons RK, Alberti KG, Gale EA, Colagiuri S, Tuomilehto J, Qiao Q, et al. The metabolic syndrome: useful concept or clinical tool?
Report of a WHO Expert Consultation. Diabetologia 2010;53:600-5.
10. Pérez-Martínez P, Mikhailidis DP, Athyros VG, Bullo M, Couture P, Covas MI, et al. Lifestyle recommendations for the prevention and management of metabolic syndrome: an international panel recommendation. Nutr Rev 2017;75:307-26.
11. Lakka TA, Laaksonen DE. Physical activity in prevention and treatment of the metabolic syndrome. Appl Physiol Nutr Metab 2007;32:76-88.
12. Semlitsch T, Jeitler K, Hemkens LG, Horvath K, Nagele E, Schuer- mann C, et al. Increasing physical activity for the treatment of hy- pertension: a systematic review and meta-analysis. Sports Med 2013;43:1009-23.
13. Piercy KL, Troiano RP, Ballard RM, Carlson SA, Fulton JE, Galuska DA, et al. The physical activity guidelines for Americans. JAMA 2018;320:2020-8.
14. Arem H, Moore SC, Patel A, Hartge P, Berrington de Gonzalez A, Visvanathan K, et al. Leisure time physical activity and mortality:
a detailed pooled analysis of the dose-response relationship.
JAMA Intern Med 2015;175:959-67.
15. Huh JH, Kang DR, Jang JY, Shin JH, Kim JY, Choi S, et al. Metabolic syndrome epidemic among Korean adults: Korean survey of Car- diometabolic Syndrome (2018). Atherosclerosis 2018;277:47-52.
16. Vinluan CM, Zreikat HH, Levy JR, Cheang KI. Comparison of dif- ferent metabolic syndrome definitions and risks of incident car- diovascular events in the elderly. Metabolism 2012;61:302-9.
17. Huh JH, Yadav D, Kim JS, Son JW, Choi E, Kim SH, et al. An asso- ciation of metabolic syndrome and chronic kidney disease from a 10-year prospective cohort study. Metabolism 2017;67:54-61.
18. Kim Y, Han BG; KoGES group. Cohort profile: the Korean Genome and Epidemiology Study (KoGES) consortium. Int J Epidemiol 2017;46:e20.
19. Lee SY, Park HS, Kim DJ, Han JH, Kim SM, Cho GJ, et al. Appropri- ate waist circumference cutoff points for central obesity in Korean adults. Diabetes Res Clin Pract 2007;75:72-80.
20. Ainsworth BE, Haskell WL, Leon AS, Jacobs DR Jr, Montoye HJ, Sallis JF, et al. Compendium of Physical Activities: classification of energy costs of human physical activities. Med Sci Sports Exerc 1993;25:71-80.
21. Ainsworth BE, Haskell WL, Whitt MC, Irwin ML, Swartz AM, Strath SJ, et al. Compendium of Physical Activities: an update of activity codes and MET intensities. Med Sci Sports Exerc 2000;32(9 Suppl):S498-504.
22. 2018 Physical Activity Guidelines Advisory Committee. 2018 Physical Activity Guidelines Advisory Committee scientific re- port. Washington, DC: U.S. Department of Health and Human Services; 2018. p.F2-33.
23. R Core Team. R: A language and environment for statistical comput- ing. R Foundation for Statistical Computing, Vienna, Austria [Com- puter software]. 2018. Available at: http://www.R-project.org/.
24. The jamovi project. jamovi (Version 1.2) [Computer software].
2019. Available at https://www.jamovi.org.
25. Centers for Disease Control and Prevention. National diabetes statistics report, 2017. Atlanta (GA): Centers for Disease Control and Prevention, US Dept of Health and Human Services; 2017.
26. International Diabetes Federation. The IDF consensus worldwide definition of the metabolic syndrome. Brussels: International Dia- betes Federation; 2006.
27. Mozumdar A, Liguori G. Persistent increase of prevalence of met- abolic syndrome among US adults: NHANES III to NHANES 1999-2006. Diabetes Care 2011;34:216-9.
28. Paffenbarger RS Jr, Hyde RT, Wing AL, Hsieh CC. Physical activity, all-cause mortality, and longevity of college alumni. N Engl J Med 1986;314:605-13.
29. Kujala UM, Kaprio J, Sarna S, Koskenvuo M. Relationship of lei- sure-time physical activity and mortality: the Finnish twin cohort.
JAMA 1998;279:440-4.
30. Ford ES, Kohl HW 3rd, Mokdad AH, Ajani UA. Sedentary behav- ior, physical activity, and the metabolic syndrome among U.S.
adults. Obes Res 2005;13:608-14.
31. Rennie KL, McCarthy N, Yazdgerdi S, Marmot M, Brunner E. As- sociation of the metabolic syndrome with both vigorous and mod- erate physical activity. Int J Epidemiol 2003;32:600-6.
32. He D, Xi B, Xue J, Huai P, Zhang M, Li J. Association between lei- sure time physical activity and metabolic syndrome: a meta-anal- ysis of prospective cohort studies. Endocrine 2014;46:231-40.
33. Li CL, Lin JD, Lee SJ, Tseng RF. Associations between the meta- bolic syndrome and its components, watching television and physical activity. Public Health 2007;121:83-91.
34. Salonen MK, Wasenius N, Kajantie E, Lano A, Lahti J, Heinonen K, et al. Physical activity, body composition and metabolic syndrome in young adults. PLoS One 2015;10:e0126737.
35. Xiao J, Shen C, Chu MJ, Gao YX, Xu GF, Huang JP, et al. Physical ac- tivity and sedentary behavior associated with components of met- abolic syndrome among people in rural China. PLoS One 2016;11:
e0147062.
36. Bertrais S, Beyeme-Ondoua JP, Czernichow S, Galan P, Hercberg S, Oppert JM. Sedentary behaviors, physical activity, and metabolic syndrome in middle-aged French subjects. Obes Res 2005;13:936- 44.
37. Dunstan DW, Salmon J, Owen N, Armstrong T, Zimmet PZ, Wel- born TA, et al. Associations of TV viewing and physical activity with the metabolic syndrome in Australian adults. Diabetologia 2005;48:2254-61.
38. Kim J, Tanabe K, Yokoyama N, Zempo H, Kuno S. Association be- tween physical activity and metabolic syndrome in middle-aged Japanese: a cross-sectional study. BMC Public Health 2011;11:624.
39. Diaz KM, Booth JN 3rd, Seals SR, Abdalla M, Dubbert PM, Sims M, et al. Physical activity and incident hypertension in African Ameri- cans: the Jackson Heart Study. Hypertension 2017;69:421-7.
40. Lee YJ, Song S, Song Y. High-carbohydrate diets and food patterns and their associations with metabolic disease in the Korean pop- ulation. Yonsei Med J 2018;59:834-42.