Cardiovascular Parameters Correlated with Metabolic Syndrome in a Rural Community Cohort of Korea: The ARIRANG Study
Although metabolic syndrome (MetS) is associated with increased cardiovascular mortality and the development of atherosclerosis, consensus is still lacking on the status of
cardiovascular function and geometry in MetS patients. We investigated the relation between MetS and left ventricle (LV) geometry and function, carotid intima-media thickness (IMT) and arterial stiffness in a community-based cohort of 702 adult subjects.
Subjects were categorized into three groups according to the number of MetS components present, as defined by the Adult Treatment Panel Ш guidelines: 1) Absent (0 criteria), 2) Pre-MetS (1-2 criteria) or 3) MetS (≥3 criteria). In female subjects, LV mass, LV mass/
height2.7, deceleration time, and aortic pulse wave velocity increased, and E/A ration decreased in a stepwise manner across the three groups. These changes were not observed in male subjects. The mean carotid IMT was higher in the MetS group than in the other two groups. The degree of MetS clustering is found to be strongly correlated with geometric eccentricity of LV hypertrophy, diastolic dysfunction and arterial changes irrespective of age and blood pressure status, particularly in females. Waist circumference is found to have the most powerful effect on cardiovascular parameters.
Key Words: Metabolic Syndrome; Heart Ventricles; Geometry; Intima-media Thickness;
Pulse Wave Velocity Min-Soo Ahn1, Jang-Young Kim2,
Young Jin Youn2, Seong-Yoon Kim2, Sang-Beak Koh3, Kyounghoon Lee2, Byung-Su Yoo2, Seung-Hwan Lee2, Junghan Yoon2, Jong-ku Park3, and Kyung-Hoon Choe2
Division of Cardiology1, Pusan National University Hospital, Busan; Division of Cardiology2, and Department of Preventive Medicine3, Institute of Genomic Cohort, Wonju College of Medicine, Yonsei University, Wonju, Korea
Received: 8 August 2009 Accepted: 30 December 2009 Address for Correspondence:
Jang-Young Kim, M.D.
Division of Cardiology, Wonju College of Medicine, Yonsei University, 20 Ilsan-ro, Wonju 220-701, Korea Tel: +82.33-741-0920, Fax: +82.33-741-1219 Email: [email protected]
This work was supported in part by a grant from the Korean Center for Disease Control and Prevention (Serial Number:
2006-347-2400-2440-215).
DOI: 10.3346/jkms.2010.25.7.1045 • J Korean Med Sci 2010; 25: 1045-1052 Cardiovascular Disorders
INTRODUCTION
Metabolic syndrome (MetS) has an age-adjusted prevalence rate of 24% in adults in the USA and 11-19% in Korea (1-4). It is char- acterized by a cluster of clinical features that include abdominal obesity, insulin resistance, hyperglycemia, hypertension, and dyslipidemia. These risk factors act synergistically to increase the risk of adverse cardiovascular events including coronary ar- tery disease and congestive heart failure, and are associated with high cardiovascular morbidity and mortality (5, 6). The progres- sive addition of MetS risk factors such as obesity, diabetes, and/
or dyslipidemia is associated with increased left ventricular (LV) mass, an effect which is independent of hypertension. The ef- fects of MetS on cardiovascular structure and function are not well characterized (7). We therefore investigated the relation between MetS and LV geometry and function, carotid intima- media thickness (IMT), and arterial stiffness using a sample from the Korean general population.
MATERIALS AND METHODS Study population
The ARIRANG study (Atherosclerosis RIsk of a Rural Area kore- aN General population) is an ongoing study of cardiovascular and metabolic risk factors that is being conducted in the rural area of Wonju, Gangwon-do, Korea. The ARIRANG study was approved by the Ethics Committee of the Wonju Christian Hos- pital, Wonju College of Medicine, Yonsei University (Wonju, Gangwon-do, Korea, Approval number: CR105024), and writ- ten informed consent was obtained from all study participants.
In the present study, we investigated a total of 702 adults from the ARIRANG cohort who had all previously undergone com- plete echocardiography assessment and measurement of IMT and pulse wave velocity (PWV). For the present study, all par- ticipants underwent a complete cardiovascular evaluation fol- lowing 8 hr of fasting, which included: 1) history, physical exam- ination, and anthropometric analysis; 2) measurement of heart rate and blood pressure (BP, measured after 10 min resting in a sitting position, was expressed as the average of three consecu-
tive measurements taken from each arm); 3) measurement of fasting blood glucose and insulin levels (in subjects not receiv- ing insulin and/or oral hypoglycemic agents); and 4) measure- ment of fasting plasma lipids (i.e., concentrations of triglyceride, high-density lipoprotein cholesterol [HDL-C], total cholesterol, and low-density lipoprotein cholesterol [LDL-C]). A diagnosis of MetS was assigned according to the amended National Cho- lesterol Education Program’s Adult Treatment Panel III (ATP-III) Guidelines and using the South Asian-specific value for waist circumference. MetS was diagnosed in individuals meeting three or more of the following criteria: (a) increased waist circumfer- ence (≥90 cm in males or ≥80 cm in females); (b) increased fast- ing triglyceride level (≥150 mg/dL); (c) high BP (≥130/≥85 mmHg) or receiving antihypertensive therapy; (d) decreased HDL-C lev- el (<40 mg/dL in males or <50 mg/dL in females) or receiving specific treatment for this lipid abnormality; and (e) impaired fasting glucose level (≥110 mg/dL) (1, 4).
Echocardiography
Echocardiography was performed using the harmonic imaging mode by use of a 3-MHz transducer and commercial ultrasound system (Vivid-7; General Electric–Vingmed, Milwaukee, WI, USA). LV internal dimensions, LV wall thickness, and LV ejec- tion fraction (LVEF, by modified Simpson’s rule) were measured according to published recommendations (8). LV mass was cal- culated as recommended by the American Society of Echocar- diography using the equation: LV mass =1.04×([PW+VS+LVDd]3
×[LVDd]3)×0.8+0.6, where PW is the M-mode posterior wall thick- ness of the LV, VS is the M-mode interventricular septal thick- ness, and LVDd is the M-mode LV dimension with the short axis view at end-diastole (9). Allometric height-based adjustments were used since height2.7 has been reported to offer the most accurate estimation of LV hypertrophy and risk factors for path- ological changes in heart structure, particularly in obese sub- jects (10). Relative wall thickness (RWT), which increases with concentric remodeling and concentric hypertrophy, was calcu- lated as 2×PW/LVDd. The left atrial (LA) dimension was mea- sured by 2D-guided M-mode echocardiography using the para- sternal short-axis view at the base of the heart, as recommend- ed by the American Society of Echocardiography (11). Three LA dimensions were used to calculate the LA volume as an ellipse using the formula: LA volume=π/6 (SA1 • SA2• LA), where SA1= the M-mode LA dimension, and SA2 and LA are measurements of the short- and long-axis with the apical four-chamber view at ventricular end-systole, respectively (12). The LA volume index was calculated by dividing the LA volume by the body surface area (BSA, m2).
Transmitral inflow velocities were measured using Pulsed- Wave Doppler (PWD) and the apical 4-chamber view, with the sample volume placed at the mitral valve leaflet tips (13). Mea- surements of the transmitral early diastolic (E-wave) and atrial
(A-wave) velocities were taken in order to calculate the E/A ra- tio and E-wave deceleration time (13). Tissue Doppler imaging (TDI) and the apical 4-chamber view were used to measure the LV myocardial velocities, with the sample volume placed at the septal mitral annulus (13, 14). Measurements included the ear- ly diastolic velocity (E’) and late diastolic velocity (A’). The E/E’
ratio was then calculated (15).
Measurement of carotid IMT and PWV
Measurement was performed using a validated procedure, as described previously (16). An ultrasound system (Vivid-7; Gen- eral Electric–Vingmed) and a phased array 12-MHz transducer were used to obtain a high-resolution B-mode ultrasound view of the far wall of the common carotid artery. The common ca- rotid arteries were explored, starting from a position 1 cm be- low the flow divider and between the internal and external ca- rotid arteries. Measurements were taken by tracing the leading edge of the lumen-intima and the media-adventitia interfaces in plaque-free areas.
PWVs were measured using an automatic waveform analyzer (PP-1000, Hanbyul Meditech, Jeonju, Korea). This provides re- gional PWV values using simultaneous electrocardiographic, phonographic, and pulse wave measurements from four differ- ent arterial sites (carotid, femoral, radial, and dorsalis pedis).
The PWV was then calculated from the pulse transit time and the distance travelled by the pulse between the two recording sites: PWV=Distance (meters)/Transit time (seconds). Surface distances for the measurement of the PWV were calculated from the subject’s height and from anthropomorphic data from the Korean population. Three different PWV values were calculat- ed: aortic, heart-to-radial, and femoral-to-ankle. The aortic PWV represents the velocity between the carotid artery and the fem- oral artery. The heart-to-radial PWV (hrPWV) and the femoral- to-ankle PWV (faPWV) were calculated on the basis of the ca- rotid-radial and the femoral-dorsalis pedis transit times, respec- tively.
Statistical analysis
Statistical analyses were performed using SPSS 11.0.1 software (SPSS Inc., Chicago, IL, USA). Males and females were analyzed separately since sex is known to have an important effect. The study cohort was divided into three groups according to the num- ber of MetS criteria present: Absent (0 criteria), Pre-MetS (1–2 criteria), and MetS (≥3 criteria). The data are presented as mean
±standard deviation in the case of continuous variables and as proportions in the case of categorical variables. Chi-square sta- tistical analysis was used to determine differences in categorical variables between the three groups. Analysis of variance (ANO- VA) was used to determine differences in continuous variables between the three groups. P values for the comparison of echo- cardiographic parameters of cardiac geometry and function
across the three groups were based on analysis of covariance (ANCOVA), adjusted for age and BP. The comparisons of IMT and PWV were analyzed by ANCOVA, and adjusted for age, BP, and smoking habits. Given the co-linearity of the components of the metabolic syndrome, the effect sizes of the components of the metabolic syndrome on cardiac geometry, IMT and PWV adjusted for age and compared using single linear regression analysis. A two-sided P<0.05 was considered statistically signifi- cant.
RESULTS
Characteristics of the study population
The prevalence of MetS was 38.6% (36.6% of males and 40.0%
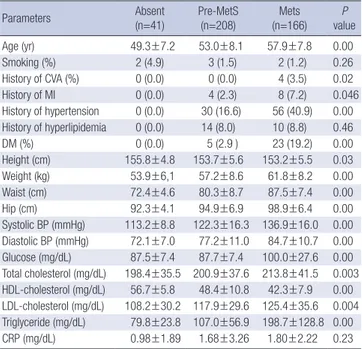
of females, P=0.20). The demographic and clinical characteris- tics of the 702 subjects (mean age, 55.5±8.5 yr; 41% male) are reported separately for each sex, according to the number of MetS criteria present (Tables 1, 2). Due to the sampling effect, the values of the MetS components (waist circumference, BP, fasting glucose, triglyceride level), weight, and hip circumference mea- surements were found to increase across the three groups, while the HDL-cholesterol levels decreased across the three groups.
In female subjects, a stepwise increase in the level of total cho- lesterol and LDL cholesterol, and in the prevalence of cardio- vascular disease (cerebrovascular accident, myocardial infarc- tion and hypertension), was observed across the three groups.
No significant differences in these factors were observed in male Table 1. Demographic and clinical characteristics of male subjects
Parameters Absent
(n=27)
Pre-MetS (n=155)
Mets (n=105)
P value
Age (yr) 58.4±9.5 57.4±8.1 55.3±8.5 0.08
Smoking (%) 13 (48.1) 60 (39.2) 44 (41.9) 0.67
History of CVA (%) 0 (0.0) 4 (3.1) 7 (8.0) 0.15
History of MI 0 (0.0) 4 (3.1) 4 (4.6) 0.59
History of hypertension 0 (0.0) 37 (27.4) 25 (27.5) 0.27 History of hyperlipidemia 0 (0.0) 7 (5.5) 7 (8.0) 0.41
DM (%) 0 (0.0) 15 (11.5) 3 (16.5) 0.13
Height (cm) 164.6±5.1 166.1±5.4 167.0±5.3 0.10
Weight (kg) 59.4±8.2 66.2±9.1 73.7±9.5 0.00
Waist (cm) 80.8±5.6 85.8±7.2 92.4±7.3 0.00
Hip (cm) 93.3±4.3 96.2±5.4 100.8±5.9 0.00
Systolic BP (mmHg) 112.8±8.8 131.5±18.1 138.8±20.8 0.00 Diastolic BP (mmHg) 73.5±6.8 82.6±10.2 85.8±14.2 0.00 Glucose (mg/dL) 87.8±9.9 96.0±19.7 106.3±32.1 0.00 Total cholesterol (mg/dL) 194.7±39.3 199.3±38.2 201.3±37.5 0.72 HDL-cholesterol (mg/dL) 52.9±8.7 47.5±11.1 38.8±8.0 0.00 LDL-cholesterol (mg/dL) 109.5±36.2 111.3±32.9 113.8±34.2 0.77 Triglyceride (mg/dL) 97.4±25.6 158.5±101.0 238.8±142.6 0.00 CRP (mg/dL) 2.02±3.78 1.89±3.13 3.27±7.34 0.10 Data are expressed as mean±standard deviation (SD) or frequency (%). Chi-square test was used for smoking status and past history; ANOVA was used for all other variables.
MetS, Metabolic syndrome; CVA, cerebrovascular accident; MI, myocardial infarction;
DM, diabetes mellitus; BP, blood pressure; LDL, low-density lipoprotein; HDL, high- density lipoprotein; CRP, C-reactive protein.
Table 2. Demographic and clinical characteristics of female subjects
Parameters Absent
(n=41) Pre-MetS
(n=208) Mets
(n=166) P
value
Age (yr) 49.3±7.2 53.0±8.1 57.9±7.8 0.00
Smoking (%) 2 (4.9) 3 (1.5) 2 (1.2) 0.26
History of CVA (%) 0 (0.0) 0 (0.0) 4 (3.5) 0.02
History of MI 0 (0.0) 4 (2.3) 8 (7.2) 0.046
History of hypertension 0 (0.0) 30 (16.6) 56 (40.9) 0.00 History of hyperlipidemia 0 (0.0) 14 (8.0) 10 (8.8) 0.46
DM (%) 0 (0.0) 5 (2.9 ) 23 (19.2) 0.00
Height (cm) 155.8±4.8 153.7±5.6 153.2±5.5 0.03 Weight (kg) 53.9±6,1 57.2±8.6 61.8±8.2 0.00 Waist (cm) 72.4±4.6 80.3±8.7 87.5±7.4 0.00 Hip (cm) 92.3±4.1 94.9±6.9 98.9±6.4 0.00 Systolic BP (mmHg) 113.2±8.8 122.3±16.3 136.9±16.0 0.00 Diastolic BP (mmHg) 72.1±7.0 77.2±11.0 84.7±10.7 0.00 Glucose (mg/dL) 87.5±7.4 87.7±7.4 100.0±27.6 0.00 Total cholesterol (mg/dL) 198.4±35.5 200.9±37.6 213.8±41.5 0.003 HDL-cholesterol (mg/dL) 56.7±5.8 48.4±10.8 42.3±7.9 0.00 LDL-cholesterol (mg/dL) 108.2±30.2 117.9±29.6 125.4±35.6 0.004 Triglyceride (mg/dL) 79.8±23.8 107.0±56.9 198.7±128.8 0.00 CRP (mg/dL) 0.98±1.89 1.68±3.26 1.80±2.22 0.23 Data are expressed as mean±standard deviation (SD) or frequency (%). Chi-square test was used for smoking status and past history; ANOVA was used for all other variables.
MetS, Metabolic syndrome; CVA, cerebrovascular accident; MI, myocardial infarction;
DM, diabetes mellitus; BP, blood pressure; LDL, low-density lipoprotein; HDL, high- density lipoprotein; CRP, C-reactive protein.
Table 3. Echocardiographic characteristics of male subjects Echocardiographic
parameters Absent
(n=27) Pre-MetS
(n=155) Mets
(n=105) P
value LA volume (mL) 29.2±8.7 34.4±11.0 38.0±11.7 0.001 LA volume/BSA (mL/m2) 17.7±5.0 19.6±5.9 20.6±6.1 0.04 LVDd (cm) 5.09±0.55 5.26±0.58 5.37±0.61 0.20 LVDs (cm) 3.39±0.57 3.50±0.52 0.59±0.61 0.42
LV EF (%) 61.9±7.4 61.3±7.5 61.1±8.1 0.96
IVSd (cm) 0.68±0.13 0.72±0.17 0.73±0.19 0.93 LVPWd (cm) 0.74±0.15 0.78±0.15 0.78±0.18 0.36 LV mass (g) 121.8±30.9 137.9±35.9 146.1±43.8 0.07 LV mass/BSA (g/m2) 73.9±16.7 79.0±19.1 79.2±23.4 0.73 LV mass/height2.7 (g/m2.7) 31.8±8.3 35.0±8.8 36.8±11.7 0.09 Relative wall thickness 0.30±0.07 0.30±0.08 0.30±0.09 0.83 E (m/sec) 0.67±0.16 0.65±0.16 0.66±0.18 0.87 Deceleration time (msec) 240.8±49.6 233.8±81.5 235.9±58.0 0.75 A (m/sec) 0.71±0.15 0.70±0.14 0.73±0.17 0.35
E/A 0.97±0.27 0.96±0.34 0.95±0.31 0.82
E’ (cm/sec) 0.08±0.01 0.08±0.02 0.07±0.02 0.25 A’ (cm/sec) 0.11±0.02 0.10±0.02 0.10±0.02 0.22
E/E’ 7.68±1.56 8.81±2.56 9.27±2.97 0.09
Data are expressed as mean±standard deviation (SD).
All variables were analyzed using ANCOVA, adjusted for age, and systolic and diastolic blood pressure.
MetS, Metabolic syndrome; LA, left atrium; BSA, body surface area; LV, left ventricle;
LVDd, end-diastolic left ventricular dimension; LVDs, end-systolic left ventricular dimen–
sion; LV EF, left ventricular ejection fraction; IVSd, end-diastolic interventricular septal thickness; LVPWd, end-diastolic left ventricular posterior wall thickness; E, peak mitral flow velocity of the early rapid filling wave; A, peak mitral flow velocity of the late filling wave; E’, early diastolic velocity of the mitral annulus; A’, late diastolic velocity of the mitral annulus.
subjects.
Cardiac geometry and function
The mean LVEF was 62.7±7.6% and the mean LV mass was 124.5
±38.9 g. LVEF was lower in males (61.3±7.7% vs. 63.7±7.4%, P<
0.001). LV mass and LV mass/BSA were significantly higher in males (139.4±39.1 g vs. 114.1±35.3 g, 78.6±20.6 g/m2 vs. 72.0±
20.3 g/m2, P<0.001). No sex difference was observed for LV mass/
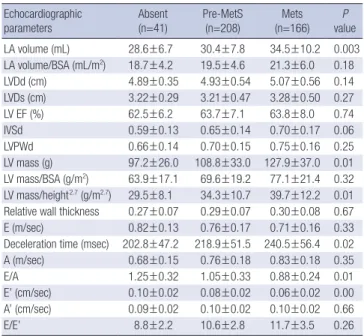
height2.7 (35.4±10.0 g/m2.7 vs. 36.0±11.6 g/m2.7, P=0.49). E/E’ was significantly lower in males (8.9±2.7 vs. 10.9±3.2, P<0.001). The LA volume index was similar in both sexes. In males, the LA vol- ume and LA volume index showed a stepwise increase across the three groups, but no inter-group differences were observed for the other echocardiographic parameters (Table 3). In females, LV mass, LV mass/height2.7, and LA volume increased in a step- wise manner across the three groups; no inter-group differenc- es were observed for LVEF. LVDd and RWT showed a tendency Table 4. Echocardiographic characteristics of female subjects
Echocardiographic
parameters Absent
(n=41) Pre-MetS
(n=208) Mets
(n=166) P
value LA volume (mL) 28.6±6.7 30.4±7.8 34.5±10.2 0.003 LA volume/BSA (mL/m2) 18.7±4.2 19.5±4.6 21.3±6.0 0.18
LVDd (cm) 4.89±0.35 4.93±0.54 5.07±0.56 0.14
LVDs (cm) 3.22±0.29 3.21±0.47 3.28±0.50 0.27
LV EF (%) 62.5±6.2 63.7±7.1 63.8±8.0 0.74
IVSd 0.59±0.13 0.65±0.14 0.70±0.17 0.06
LVPWd 0.66±0.14 0.70±0.15 0.75±0.16 0.25
LV mass (g) 97.2±26.0 108.8±33.0 127.9±37.0 0.01
LV mass/BSA (g/m2) 63.9±17.1 69.6±19.2 77.1±21.4 0.32 LV mass/height2.7 (g/m2.7) 29.5±8.1 34.3±10.7 39.7±12.2 0.01 Relative wall thickness 0.27±0.07 0.29±0.07 0.30±0.08 0.67
E (m/sec) 0.82±0.13 0.76±0.17 0.71±0.16 0.33
Deceleration time (msec) 202.8±47.2 218.9±51.5 240.5±56.4 0.02
A (m/sec) 0.68±0.15 0.76±0.18 0.83±0.18 0.35
E/A 1.25±0.32 1.05±0.33 0.88±0.24 0.01
E’ (cm/sec) 0.10±0.02 0.08±0.02 0.06±0.02 0.00 A’ (cm/sec) 0.09±0.02 0.10±0.02 0.10±0.02 0.66
E/E’ 8.8±2.2 10.6±2.8 11.7±3.5 0.26
Data are expressed as mean±standard deviation (SD).
All variables were analyzed using ANCOVA, adjusted for age, and systolic and diastolic blood pressure.
MetS, Metabolic syndrome; LA, left atrium; BSA, body surface area; LV, left ventricle;
LVDd, end-diastolic left ventricular dimension; LVDs, end-systolic left ventricular dimen–
sion; LV EF, left ventricular ejection fraction; IVSd, end-diastolic interventricular septal thickness; LVPWd, end-diastolic left ventricular posterior wall thickness; E, peak mitral flow velocity of the early rapid filling wave; A, peak mitral flow velocity of the late filling wave; E’, early diastolic velocity of the mitral annulus; A’, late diastolic velocity of the mitral annulus.
Table 5. Effect size of components of the metabolic syndrome on left ventricular mass in females (LV mass/height 2.7)
Parameters B R2 P
Waist circumference (cm) 0.471 0.291 0.000
Systolic blood pressure (mmHg) 0.063 0.173 0.045 Diastolic blood pressure (mmHg) 0.067 0.169 0.148
HDL-cholesterol (mg/dL) 0.033 0.165 0.514
Triglyceride (mg/dL) 0.003 0.165 0.617
Fasting glucose (mg/dL) 0.038 0.169 0.164
All variables were analyzed using single linear regression analysis, adjusted for age.
B, non-standardized regression coefficient; LV, left ventricle; HDL, high-density lipo–
protein.
Table 6. Effect size of components of the metabolic syndrome on deceleration time in females
Parameters B R2 P
Waist circumference (cm) 1.528 0.101 0.000
Systolic blood pressure (mmHg) 0.409 0.060 0.009 Diastolic blood pressure (mmHg) 0.698 0.065 0.003
HDL-cholesterol (mg/dL) 0.200 0.045 0.439
Triglyceride (mg/dL) 0.056 0.055 0.033
Fasting glucose (mg/dL) 0.353 0.060 0.009
All variables were analyzed using single linear regression analysis, adjusted for age.
B, non-standardized regression coefficient; LV, left ventricle; HDL, high-density lipo–
protein.
Male IMT (mm) Female IMT (mm)
Absent Pre-metabolic Metabolic
syndrome syndrome
Absent Pre-metabolic Metabolic
syndrome syndrome
0.70
0.65
0.60
0.55
0.70
0.65
0.60
0.55 0.63
P=0.99 P=0.01
P=0.39
P=0.04
P=0.04 P=0.16
0.62
0.66
0.56
0.59
0.65
Fig. 1. Carotid intima-media thickness analyzed using ANCOVA, adjusted for age, blood pressure, and smoking status, according to the number of metabolic syndrome criteria present.
to increase across the three groups, but these differences did not achieve statistical significance. The E’ showed a stepwise de- crease across the three groups, and deceleration time increased across the three groups. Since the A wave velocity showed a ten- dency to increase and the E wave velocity showed a tendency to decrease, the E/A ratio decreased in a stepwise manner across the three groups (Table 4). In comparing the effect size of each component of the metabolic syndrome, waist circumference was found to have the most powerful effect on both LV mass/
height2.7 and deceleration time in female subjects (Tables 5, 6).
Carotid IMT and PWV
IMT ranged from 0.22 to 1.75 mm, with a mean of 0.62 mm and a standard deviation (S.D.) of 0.15 mm, and was similar in both sexes. The coefficient of variation of IMT was 24.1%. A signifi- cant positive correlation was observed between IMT and sys- tolic blood pressure (r=0.098, P=0.01) and age (r=0.236, P=0.00), irrespective of smoking status. IMT was also found to be signifi-
cantly correlated with hrPWV (r=0.098, P=0.03) and faPWV (r=
0.093, P=0.04), but not with aortic PWV. The mean aortic PWV was 7.66±1.26 m/sec (coefficient of variation=16.4%), hrPWV was 8.12±1.07 m/sec (coefficient of variation=13.0%), and faPWV was 10.15±1.35 m/sec (coefficient of variation=13.3%). PWV was significantly higher in males (Aortic PWV, 8.05±1.25 m/sec vs.
7.38±1.2 m/sec; hrPWV, 8.61±1.03 m/sec vs. 7.77±0.95 m/sec;
faPWV, 10.34±1.30 m/sec vs. 10.01±1.36 m/sec, P<0.01). Aortic PWV and faPWV were significantly correlated with systolic and diastolic blood pressure and age; hrPWV was correlated with BP, but not with age. Significant differences were observed for all regional PWVs in relation to smoking status (non-smoker, ex- smoker, current smoker).
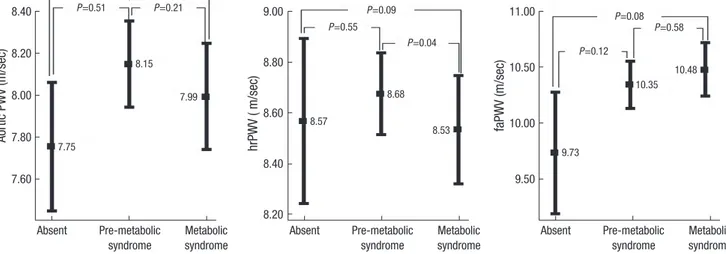
In males, IMT was significantly higher in the MetS group com- pared with the pre-MetS group (P=0.01). All regional PWVs were similar across the three groups (Figs. 1, 2).
In females, IMT was significantly higher in MetS group com- pared with the two other groups (Fig. 1). Aortic PWV increased
Aortic PWV (m/sec)
8.40
8.20
8.00
7.80
7.60
Absent Pre-metabolic Metabolic syndrome syndrome
faPWV (m/sec)
11.00
10.50
10.00
9.50
Absent Pre-metabolic Metabolic syndrome syndrome
hrPWV ( m/sec)
9.00
8.80
8.60
8.40
8.20
Absent Pre-metabolic Metabolic syndrome syndrome 7.75
8.15
7.99
8.57
8.68
8.53
9.73
10.35 10.48 P=0.21
P=0.51 P=0.21 P=0.09 P=0.08
P=0.55
P=0.04
P=0.58 P=0.12
Fig. 2. Regional pulse wave velocity in males analyzed by ANCOVA adjusted for age, blood pressure, and smoking status, according to the number of metabolic syndrome criteria present. hrPWV, heart-to-radial pulse wave velocity; faPWV, femoral-to-ankle pulse wave velocity.
Aortic PWV (m/sec)
8.00
7.50
7.00
Absent Pre-metabolic Metabolic syndrome syndrome
faPWV (m/sec)
10.50
10.00
9.50
9.00
Absent Pre-metabolic Metabolic syndrome syndrome
hrPWV ( m/sec)
8.20
8.00
7.80
7.60
7.40
Absent Pre-metabolic Metabolic syndrome syndrome 6.97
7.17 7.75
7.60
7.72 7.87
9.32
9.91 10.33 P=0.10
P=0.80
P=0.02
P=0.13
P=0.20
P=0.37
P=0.23
P=0.82
P=0.20
Fig. 3. Regional pulse wave velocity in females analyzed by ANCOVA adjusted for age, blood pressure, and smoking status, according to the number of metabolic syndrome criteria present. hrPWV, heart-to-radial pulse wave velocity; faPWV, femoral-to-ankle pulse wave velocity.
in a stepwise manner across the three groups (6.97±0.97 m/sec, 7.16±1.13 m/sec, 7.74±1.26 m/sec, P=0.049) (Fig. 3). hrPWV and faPWV showed a tendency to increase in a stepwise manner across the three groups, but these differences did not achieve statistical significance (Fig. 3). In comparing the effect size of each component of the metabolic syndrome, waist circumfer- ence was found to have the largest effect on IMT (Table 7).
DISCUSSION
The present study evaluated echocardiographic measurements of LV geometry and function, IMT and PWV assessment of arte- rial stiffness in a cross sectional cohort of subjects grouped ac- cording to the number of MetS criteria present. This study clear- ly demonstrated a sex specific relationship between MetS and cardiovascular function and geometry. The fact that the ANCO- VA model was used reduces the likelihood that this finding was an artifact of covariance (age, BP, or smoking). In females, we found that: 1) LVEF, which reflects LV systolic function, was with- in normal limits in all three groups, 2) RWT results were similar in all three groups, while LV mass and LV mass/height2.7 increas–
ed progressively across the three groups, 3) E/A and deceleration time, which reflects LV diastolic function, showed progressive impairment across the three groups after adjustment for age and BP, and 4) aortic PWV increased progressively across the three groups after adjustment for age, BP and smoking status. In males, no differences were found across the three groups, except in LA volume index and IMT. The results of this study suggest that an increase in the number of MetS criteria is associated, in an in- dependent manner, with subclinical eccentric LV hypertrophy, diastolic dysfunction, and increased arterial stiffness, irrespective of age and BP. The effects of MetS were found to be pronounced in females, but not in males. These findings did not change when subjects with diabetes and hypertension were excluded (data not shown). When LV mass was indexed for body surface area (a normalization that minimizes the effect of obesity since body weight is included in its computation), metabolic risk factors showed no significant effects. This finding strongly confirms that obesity, when present, is the feature that tracks the cumulative effect of the other risk factors (hypercholesterolemia and dia- Table 7. Effect size of components of the metabolic syndrome on IMT
Parameters Females Males
B R2 P B R2 P
Waist circumference (cm) 0.003 0.080 0.003 0.003 0.071 0.001
Systolic blood pressure (mmHg) 0.000 0.069 0.355 0.000 0.036 0.593
Diastolic blood pressure (mmHg) 0.001 0.070 0.218 -0.001 0.039 0.312
HDL-cholesterol (mg/dL) 0.000 0.067 0.588 -0.001 0.046 0.074
Triglyceride (mg/dL) 0.000 0.067 0.571 0.000 0.068 0.002
Fasting glucose (mg/dL) 0.000 0.067 0.891 0.000 0.068 0.002
All variables were analyzed using single linear regression analysis, adjusted for age.
B, non-standardized regression coefficient; LV, left ventricle; HDL, high-density lipoprotein.
betes).
Although several recent studies have reported impaired LV di- astolic function in MetS patients, consensus is still lacking on the effect of MetS on cardiac function and geometry. In the Strong Heart Study, MetS was found to be associated with reduced LV systolic and diastolic function and LV dimensions, while LV mass and RWT were found to be higher in the MetS group (17). In con- trast, Grandi et al. (18) found that only LV diastolic function was reduced in MetS, and that LV systolic function was normal in clinically hypertensive non-diabetic subjects. They also report- ed that both LV mass and relative wall thickness were signifi- cantly increased in the MetS group, but that LV dimensions were similar in both groups. Mule et al. (19) reported that MetS has a deleterious effect on hypertension-related target organ damage.
They observed increased LV mass, RWT, and deceleration times in hypertensive subjects with MetS compared with a hyperten- sive cohort without MetS. In a population-based study, Sun–
dst–rom et al. (20) demonstrated a strong correlation between MetS and left ventricular mass and relative wall thickness, a cor- relation which was independent of blood pressure status. Only a few previous studies of the impact of MetS on LV mass have conducted separate analyses for males and females, and these studies have reported conflicting findings. Schillaci et al. (21) found that MetS had a more pronounced effect on LV hypertro- phy and function in females. Our results support the hypothesis that MetS is associated with LV diastolic dysfunction in females only, even in subjects without LV systolic dysfunction, and irre- spective of BP status. However, in the present study, changes in LV geometry tended toward eccentric hypertrophy, and waist circumference was found to have the most significant effect on left ventricular functional and geometric change.
In the present study, MetS was associated with increased ca- rotid IMT and aortic PWV, and this effect was independent of age, BP, and smoking status, particularly in females. In females, hrPWV and faPWV showed a tendency to increase in a stepwise manner across the three groups, but these differences did not achieve statistical significance. This suggests that the cluster of MetS components may interact synergistically to increase arte- rial stiffness, particularly in females. Several previous studies have reported that the grouping of insulin resistance syndrome
components is associated with excessive carotid IMT, beyond a level attributable to an additive effect, and that MetS was inde- pendently associated with carotid IMT and arterial stiffness (22, 23). However, most of the studies that have investigated associ- ations with MetS and its components have focused on one spe- cific arterial segment, such as the aorta, brachial-ankle segment, or the lower limb, or alternatively, one arterial site such as the brachial and (more frequently) the carotid artery, and their re- sults have been conflicting. There have been few studies of sex- specific MetS effects on arterial stiffness. Schillaci et al. (24) dem- onstrated that MetS was independently associated with higher aortic velocity, but not with higher upper limb pulse wave ve- locity. Ferreira et al. (25) reported that stiffness in the femoral arteries was higher than that in the carotid arteries. Other stud- ies have evaluated central and peripheral arterial segments and reported that MetS is associated with increased central and peri–
pheral arterial stiffness in females (26). The present study show–
ed an association between MetS and aortic PWV in females, but these findings did not reach statistical significance. Further stud- ies are required to demonstrate the relative impact of MetS on PWV in differing arterial regions.
The mechanism underlying the influence of sex on the asso- ciation between MetS and LV geometry and function, arterial stiffness, and structural change remains unknown. It will be nec- essary to conduct further studies in order to elucidate the nature of this sex-specific effect.
The present study has important limitations. Its cross-section- al design precludes the performance of outcome analyses. The sample size was relatively small, especially for the group with no MetS components. Ambulatory BP measurements, which have been shown to be more predictive of hypertensive end-or- gan damage, were not performed. Although PWV may vary ac- cording to the time of day, these variables were consistently mea- sured in the morning.
In conclusion, clustering of MetS components is indepen- dently associated with subclinical eccentric LV hypertrophy, di- astolic dysfunction, and increased aortic wall stiffness, particu- larly in females, irrespective of age and BP status. Waist circum- ference has the most powerful influence on LV geometry and function and IMT.
REFERENCES
1. National Cholesterol Education Program (NCEP) Expert Panel on De- tection, Evaluation, and Treatment of High Blood Cholesterol in Adults (Adult Treatment Panel III). Third Report of the National Cholesterol Education Program (NCEP) Expert Panel on Detection, Evaluation, and Treatment of High Blood Cholesterol in Adults (Adult Treatment Panel III) final report. Circulation 2002; 106: 3143-421.
2. Park JS, Park HD, Yun JW, Jung CH, Lee WY, Kim SW. Prevalence of the metabolic syndrome as defined by NCEP-ATPIII among the urban Kore- an population. Korean J Med 2002; 63: 290-8.
3. Ford ES, Giles WH, Dietz WH. Prevalence of the metabolic syndrome among US adults: findings from the third National Health and Nutri- tion Examination Survey. JAMA 2002; 287: 356-9.
4. Alberti KG, Zimmet P, Shaw J. The metabolic syndrome--a new world- wide definition. Lancet 2005; 366: 1059-62.
5. Lakka HM, Laaksonen DE, Lakka TA, Niskanen LK, Kumpusalo E, Tu- omilehto J, Salonen JT. The metabolic syndrome and total and cardiovas- cular disease mortality in middle-aged men. JAMA 2002; 288: 2709-16.
6. Ninomiya JK, L’Italien G, Criqui MH, Whyte JL, Gamst A, Chen RS. As- sociation of the metabolic syndrome with history of myocardial infarc- tion and stroke in the Third National Health and Nutrition Examination Survey. Circulation 2004; 109: 42-6.
7. de Simone G, Olsen MH, Wachtell K, Hille DA, Dahlof B, Ibsen H, Kjeld- sen SE, Lyle PA, Devereux RB. Clusters of metabolic risk factors predict cardiovascular events in hypertension with target-organ damage: the LIFE study. J Hum Hypertens 2007; 21: 625-32.
8. Schiller NB, Shah PM, Crawford M, DeMaria A, Devereux R, Feigen- baum H, Gutgesell H, Reichek N, Sahn D, Schnittger I, Silverman NH, Tajik AJ. Recommendations for quantitation of the left ventricle by two- dimensional echocardiography. American Society of Echocardiography Committee on Standards, Subcommittee on Quantitation of Two-Dimen- sional Echocardiograms. J Am Soc Echocardiogr 1989; 2: 358-67.
9. Devereux RB, Alonso DR, Lutas EM, Gottlieb GJ, Campo E, Sachs I, Reichek N. Echocardiographic assessment of left ventricular hypertro- phy: comparison to necropsy findings. Am J Cardiol 1986; 57: 450-8.
10. de Simone G, Daniels SR, Devereux RB, Meyer RA, Roman MJ, de Di- vitiis O, Alderman MH. Left ventricular mass and body size in normo- tensive children and adults: assessment of allometric relations and im- pact of overweight. J Am Coll Cardiol 1992; 20: 1251-60.
11. Sahn DJ, DeMaria A, Kisslo J, Weyman A. Recommendations regarding quantitation in M-mode echocardiography: results of a survey of echo- cardiographic measurements. Circulation 1978; 58: 1072-83.
12. Lang RM, Bierig M, Devereux RB, Flachskampf FA, Foster E, Pellikka PA, Picard MH, Roman MJ, Seward J, Shanewise JS, Solomon SD, Spen- cer KT, Sutton MS, Stewart WJ. Recommendations for chamber quanti- fication: a report from the American Society of Echocardiography’s Guide- lines and Standards Committee and the Chamber Quantification Writ- ing Group, developed in conjunction with the European Association of Echocardiography, a branch of the European Society of Cardiology. J Am Soc Echocardiogr 2005; 18: 1440-63.
13. Quinones MA, Otto CM, Stoddard M, Waggoner A, Zoghbi WA. Recom- mendations for quantification of Doppler echocardiography: a report from the Doppler Quantification Task Force of the Nomenclature and Standards Committee of the American Society of Echocardiography. J Am Soc Echocardiogr 2002; 15: 167-84.
14. Dumesnil JG, Paulin C, Pibarot P, Coulombe D, Arsenault M. Mitral an- nulus velocities by Doppler tissue imaging: practical implications with regard to preload alterations, sample position, and normal values. J Am Soc Echocardiogr 2002; 15: 1226-31.
15. Sohn DW, Chai IH, Lee DJ, Kim HC, Kim HS, Oh BH, Lee MM, Park YB, Choi YS, Seo JD, Lee YW. Assessment of mitral annulus velocity by Dop- pler tissue imaging in the evaluation of left ventricular diastolic function.
J Am Coll Cardiol 1997; 30: 474-80.
16. O’Leary DH, Polak JF, Kronmal RA, Manolio TA, Burke GL, Wolfson SK Jr. Carotid-artery intima and media thickness as a risk factor for myocar-
dial infarction and stroke in older adults. Cardiovascular Health Study Collaborative Research Group. N Engl J Med 1999; 340: 14-22.
17. Chinali M, de Simone G, Roman MJ, Best LG, Lee ET, Russell M, How- ard BV, Devereux RB. Cardiac markers of pre-clinical disease in adoles- cents with the metabolic syndrome: the strong heart study. J Am Coll Cardiol 2008; 52: 932-8.
18. Grandi AM, Maresca AM, Giudici E, Laurita E, Marchesi C, Solbiati F, Nicolini E, Guasti L, Venco A. Metabolic syndrome and morphofunc- tional characteristics of the left ventricle in clinically hypertensive nondi- abetic subjects. Am J Hypertens 2006; 19: 199-205.
19. Mule G, Nardi E, Cottone S, Cusimano P, Volpe V, Piazza G, Mongiovi R, Mezzatesta G, Andronico G, Cerasola G. Influence of metabolic syndrome on hypertension-related target organ damage. J Intern Med 2005; 257:
503-13.
20. Sundstrom J, Arnlov J, Stolare K, Lind L. Blood pressure-independent re- lations of left ventricular geometry to the metabolic syndrome and insu- lin resistance: a population-based study. Heart 2008; 94: 874-8.
21. Schillaci G, Pirro M, Pucci G, Mannarino MR, Gemelli F, Siepi D, Vaudo G, Mannarino E. Different impact of the metabolic syndrome on left ven- tricular structure and function in hypertensive men and women. Hyper- tension 2006; 47: 881-6.
22. Golden SH, Folsom AR, Coresh J, Sharrett AR, Szklo M, Brancati F. Risk factor groupings related to insulin resistance and their synergistic effects on subclinical atherosclerosis: the atherosclerosis risk in communities study. Diabetes 2002; 51: 3069-76.
23. Scuteri A, Najjar SS, Muller DC, Andres R, Hougaku H, Metter EJ, Lakat- ta EG. Metabolic syndrome amplifies the age-associated increases in vas- cular thickness and stiffness. J Am Coll Cardiol 2004; 43: 1388-95.
24. Schillaci G, Pirro M, Vaudo G, Mannarino MR, Savarese G, Pucci G, Franklin SS, Mannarino E. Metabolic syndrome is associated with aortic stiffness in untreated essential hypertension. Hypertension 2005; 45: 1078- 82.
25. Ferreira I, Henry RM, Twisk JW, van Mechelen W, Kemper HC, Stehou- wer CD. The metabolic syndrome, cardiopulmonary fitness, and subcu- taneous trunk fat as independent determinants of arterial stiffness: the Amsterdam Growth and Health Longitudinal Study. Arch Intern Med 2005; 165: 875-82.
26. Ferreira I, Boreham CA, Twisk JW, Gallagher AM, Young IS, Murray LJ, Stehouwer CD. Clustering of metabolic syndrome risk factors and arte- rial stiffness in young adults: the Northern Ireland Young Hearts Project.
J Hypertens 2007; 25: 1009-20.