◈ Original Article ◈
A Study on the Isodose Distribution in a Vascular Characterization Room
Young Choi
1ㆍByung Sam Kang
2ㆍJung Whan Min
21Department of Customer Service, LISTEM Corporationㆍ
2Department of Radiological Technology, Shingu University
2)
Abstract
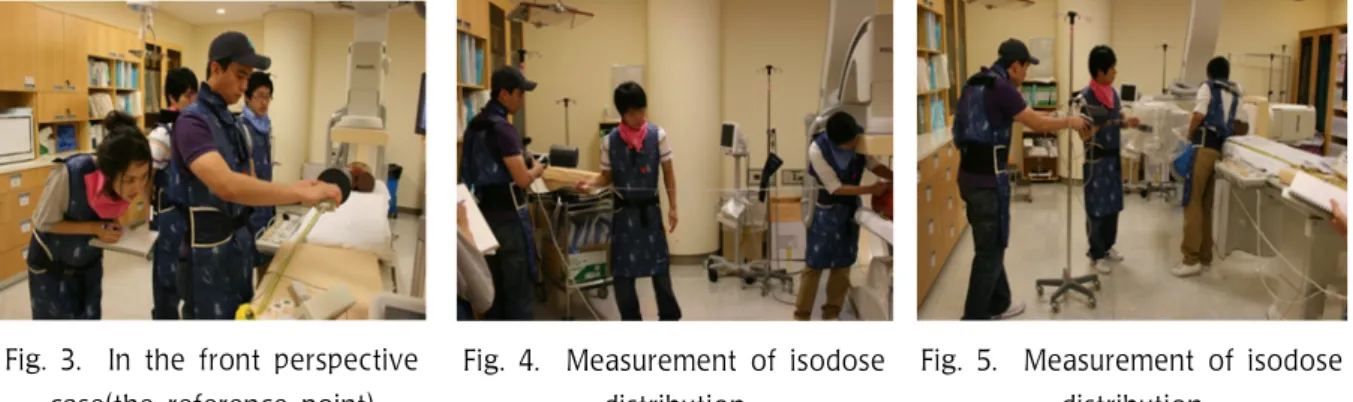
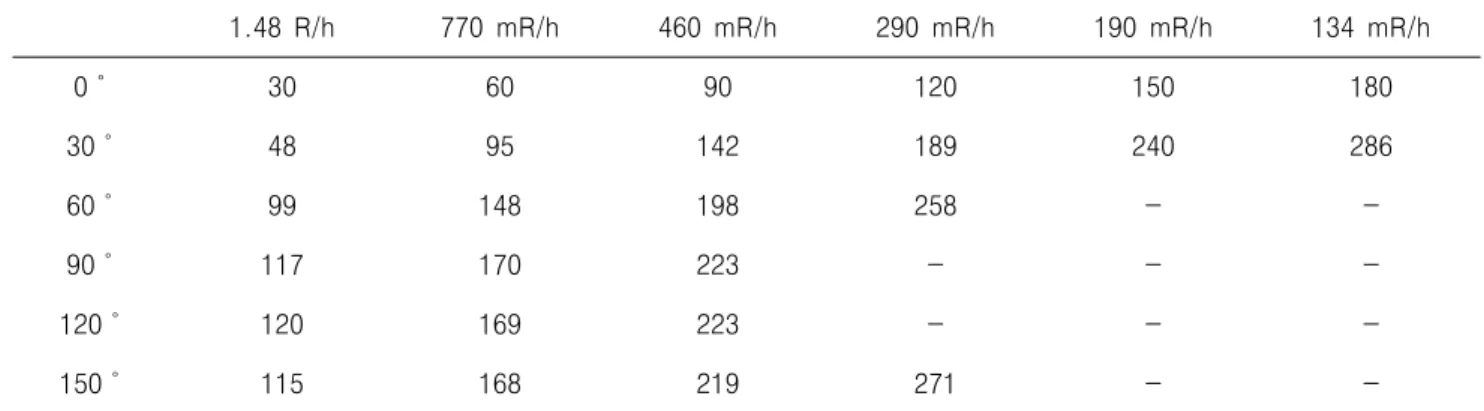
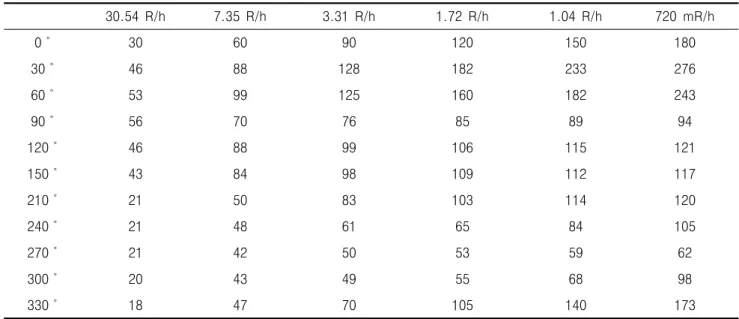
As applications of radiation grow wider from use in the early detection of lesions and preventive diagnosis purposes to the treatment of diseases, the possibilities for patients and working professionals to be exposed to radiation are becoming greater than ever. This can not only directly bring about an increase in patient’s individual radiation exposure, but also brings about an increase in the annual radiation dose of working professionals. Therefore, research and countermeasures to reduce radiation dosage are required. In this study, space dosimetry has been divided into two separate measuments with an understanding of the increasing number of angiography procedures: front perspective and side perspective. According to the results of the isodose curve, a way to minimize radiation exposure in working professionals has been suggested. This was made possible by workers through awareness of suitable working positions.
Key Words : Radiation dose, Angiography, Isodose curve, Radiation exposure in working
Ⅰ. Introduction
As applications of radiation grow wider from use in the early detection of lesions and preventive diagnosis purposes to the treatment of diseases, the possibilities for patients and working professionals to be exposed to radiation are becoming greater than ever.
1This can not only directly bring about an increase in patient’s individual radiation exposure, but also brings about an increase in the annual radiation dose of working professionals. Therefore, research and
Received January 10, 2011/ 1st Revised February 15, 2011/
Accepted for Publication February 25, 2011.
Corresponding Author: Byung Sam Kang
Department of Radiological Technology, Shingu University (462-743) 657, Gwangmyeong-ro, seongnam-si, Gyeonggi-do, Republic of Korea
Tel: 031) 740-1522 Fax: 031) 740-1589 E-mail: [email protected]