http://dx.doi.org/10.14316/pmp.2016.27.3.146 pISSN 2508-4445, eISSN 2508-4453
This study was supported by a grant of the Korea Institute of Radiological and Medical Sciences (KIRAMS), funded by Ministry of Science, ICT and Future Planning, of Korea (1711031801/50422-2016).
Received 12 September 2016, Revised 23 September 2016, Accepted 24 September 2016
Correspondence: Haijo Jung ([email protected])
Tel: 82-2-970-1346, Fax: 82-2-970-1963 cc This is an Open-Access article distributed under the terms of the Creative Commons Attribution Non-Commercial License (http://creativecommons.org/licenses/by-nc/4.0) which permits unrestricted non-commercial use, distribution, and reproduction in any medium, provided the original work is properly cited.
Analysis of Trends in Dose through Evaluation of Spatial Dose Rate and Surface Contamination in Radiation-Controlled Area and Personal Exposed Dose of Radiation Worker at the Korea
Institute of Radiological and Medical Sciences (KIRAMS)
Bu Hyung Lee*†, Sung Ho Kim*†, Soo Il Kwon*, Jae Seok Kim*, Gi-sub Kim†, Min Seok Park†, Seungwoo Park†, Haijo Jung†
*Department of Medical Physics, Kyonggi University, Suwon,
†Korea Institute of Radiological and Medical Sciences, Seoul, Korea
As the probability of exposure to radiation increases due to an increase in the use of radioisotopes and radiation generators, the importance of a radiation safety management field is being highlighted. We intend to help radiation workers with exposure management by identifying the degree of radiation exposure and contamination to determine an efficient method of radiation safety management. The personal exposure doses of the radiation workers at the Korea Institute of Radiological & Medical Sciences measured every quarter during a five-year period from Jan. 1, 2011 till Dec. 31, 2015 were analyzed using a TLD (thermoluminescence dosimeter). The spatial dose rates of radiation-controlled areas were measured using a portable radioscope, and the level of surface contamination was measured at weekly intervals using a piece of smear paper and a low background alpha/beta counter. Though the averages of the depth doses and the surface doses in 2012 increased from those in 2011 by about 14%, the averages were shown to have decreased every year after that. The exposure dose of 27 mSv in 2012 increased from that in 2011 in radiopharmaceutical laboratories and, in the case of the spatial dose rate, the rate of decrease in 2012 was shown to be similar to the annual trend of the whole institute. In the case of the surface contamination level, as the remaining radiation-controlled area with the exception of the I-131 treatment ward showed a low value less than 1.0 kBq/m², the annual trend of the I-131 treatment ward was shown to be similar to that of the entire institute. In conclusion, continuous attention should be paid to dose monitoring of the radiation-controlled areas where unsealed sources are handled and the workers therein.
Key Words: Radiation-controlled area, Radiation worker, Personal exposure dose, Spatial dose rate and Surface contamination
Introduction
As use of radioisotopes and radiation generators increases with advancements in medical science, the importance of a ra- diation safety management field is coming to the forefront be-
cause of an increase in the radiation exposure dose in the medical field. According to research performed by the Korean Association for Radiation Application, the number and scale of institutes in the medical field that use radioisotopes and radia- tion generators as well as the number of workers substantially increased in 2014 in comparison to those in the past years.1) The chance of exposure to radiation is increasing every year and, accordingly, work environment and personal dose mon- itoring are required for radiation safety management. Work en- vironment monitoring requires dose measurement of radia- tion-controlled areas, and personal dose monitoring requires monitoring of the occupational exposure of individual workers.
The radiation dose rate and contamination level of a radia-
of radiation workers and patients. Accordingly, not only shielding of radiation-controlled areas, but also real-time mon- itoring and dosimetry are becoming more important to mini- mize medical exposure doses.2) The dosimetry required to identify the radiation exposure dose of radiation workers should be periodically performed in radiation-controlled areas, based on which efforts should be made to achieve accurate dose evaluation.3,4) In this is study, the data accumulated for five years were analyzed by measuring the spatial dose rates and surface contamination levels of the radiation-controlled areas of the Korea Institute of Radiological & Medical Sciences and the personal exposure doses of radiation workers therein at intervals of either 1 week or 3 months. The main objective is to present the control and regulation additionally required by checking the correlation and trend between the spatial dose rates and surface contamination levels in the radi- ation-controlled areas and the personal exposure doses of radi- ation workers, eventually to help in managing the exposure doses of radiation workers in the future. In addition, this study can be used to help the radiation workers in controlling and operating the doses of radiation-controlled areas to the extent that the prescribed reference values are not exceeded by pro- viding basic information required to prevent the radioactive substances from breaking away and the exposure doses of workers from exceeding the limit due to mistakes of the radia- tion workers.5)
Materials and Methods
1. Quantity and unit
The personal dose equivalent Hp(d) is the dose equivalent at a depth d (mm) of the soft tissue of a human body exposed to radiation. The personal dose equivalents Hp(10) and Hp(0.07) are measured using a TLD (thermoluminescence dosimeter) and adopted as the depth dose and the surface dose, respectively. The depth dose refers to the dose of a human body internal organ and the surface dose refers to the dose of the skin. A collective effective dose is the total exposure dose of a group of which the attributes of the members are similar and is used as an indicator for the judgment on the rationality of radiation exposure. It is calculated as a sum of effective
the dose accumulated for each quarter can be adopted as the effective dose evaluation value for 1 year. The mean effective dose is calculated by dividing the collective effective dose by the number of workers in each group. The unit used for col- lective effective dose is man-Sv, and Sv is used as the unit of depth dose, surface dose, and mean effective dose.6)
2. Selection of radiation-controlled area
According to Article 2 of Law No. 13545, the Nuclear Safety Act, a radiation-controlled area is an area in which the external radiation dose rate, air contamination level, and the surface contamination level have a risk of exceeding the val- ues prescribed by the rules of the Nuclear Safety and Security Committee and for which actions are required to control the movement of humans for radiation safety management and to prevent radiation exposure to visitors.3,7) Radiation-controlled areas have been established according to this law.
There were five control places including the neutron therapy facility (P1) located in the radiopharmaceuticals production business center inside the Korea Institute of Radiological &
Medical Sciences, radioactive pharmaceuticals research team of 50 MeV cyclotron room (P2), radioactive pharmaceuticals pro- duction team of 30 MeV cyclotron room (P3), department of nuclear medicine of Korea Cancer Center Hospital (P4), and the iodine-131 treatment ward (P5). The measurement points selected in each location were the places that had a risk of ra- diation hazards in accordance with the Nuclear Safety Act, which included 12, 16, 30, 28, and 41 spots in P1, P2, P3, P4, and P5 respectively.
3. Measurement of personal exposed dose
As to the personal exposure dose, the depth doses and the surface doses are measured for not only the members of de- partments specified as radiation-controlled areas of this in- stitute, but also all of the workers who could access a radia- tion generator or who handled radioisotopes. However, the ob- jects of the personal exposure dose measurement in this study were the workers in the areas that showed or had a risk of showing a significant exposure dose and were defined to be P1 through P5. The personal exposure doses were measured using a TLD (Thermo - Luminescence Dosimeter) and the depth
doses as well as the surface doses were measured quarterly four times a year. The TLD should be, in principle, worn on a deep part during a radiation work and stored in a designated place after the work is completed. The TLD should be re- placed every quarter by the radiation safety manager. The readout was entrusted to a readout company pursuant to the domestic Atomic Energy Act, and the result of the personal exposure dose was received and utilized as the analysis data.
According to Sub-paragraph 4, Article 2 of the Enforcement Decree of the Nuclear Safety Act, the dose limit for 5 years is 100 mSv and the dose is regulated and controlled not to ex- ceed 50 mSv per year.8)
4. Measurement of spatial dose rate
The spatial dose rate measurement spots were P1, P2, P3, P4, and P5, and the measurement was performed once every week. The type of radiation to be measured was gamma rays and the measurement was performed at a height of 1 m from the ground and a distance of 0.1 m from either the wall or the radiation source, as recommended by ICRP 94, using a port- able radioscope for beta and gamma rays (Thermo ESM Eberline, model FH 40 G, Germany).9) In particular, the spots with a big dose rate as well as the spots with a big change in the dose rate should be included and the measurements should be made at the same spots each time regardless of the measurer. When setting a direction of the detector, the meas- urements were made with the detector facing the radiation source if the location of the radiation source was clear.
Otherwise, the detector faced to a direction in which the meas- ured value of detector was the largest. The values should be read after turning on the portable radioscope and the measured values become stable. If the measured values fluctuated, the values should be recorded by making the measurements for a longer time.10) According to rule no. 14 of the Nuclear Safety and Security Committee, the external radiation dose rate is pre- scribed to be 10 μSv/h (400 μSv/week), and the annual limit of the external radiation dose rate is 20 mSv/y (10 μSv/h*8 h/d*5 d/week*50 w/y=20 mSv/y).11) Accordingly, the spatial dose rate should be regulated and controlled not to exceed 10 μSv/h.
5. Measurement of surface contamination
The surface contamination level measurement spots were P2, P3, P4, and P5, and the measurement was made once every week. P1 was excluded from the objects of measurement, as it was not a facility where an unsealed source is handled.
Surface contamination was measured using the smear measure- ment method, which is an indirect method. As specimens can be taken from surface contamination because it is removable contamination, an area equivalent to 100 cm2 at the spot to be measured should be evenly rubbed with a piece of smear pa- per (filter paper, model WF41, 49 mm, Whatman, UK). The type of radiation to be measure is a beta ray, and the smear paper on which the contaminants are collected should be measured using a low background alpha/beta counter (Canberra, model S5-XLB, USA). Each smear paper was put on the sample container and measured for 1 min.5,12) The sur- face contamination level was regulated and controlled not to exceed the allowable surface contamination level (40 KBq/m2) in accordance with announcement no. 2014-34 of the Nuclear Safety and Security Committee.13)
6. Analysis of the measurements
The statistical analysis of spatial dose rates, surface con- tamination levels, and personal exposure doses was accom- plished using SPSS ver 23.0. The general characteristics were shown using frequency analysis, and the mean analysis of per- sonal exposure doses by year, location, age, and gender was performed using one-way ANOVA and two-way ANOVA. The analysis by year and location was completed using two-way ANOVA to show the averages of the spatial dose rates and the surface contamination levels. For follow-up analysis, the Duncan multiple comparison method was used. For the data that do not satisfy homoscedasticity, the harmonic means and harmonic standard deviations were obtained and a significance level of the hypothesis testing was conducted within 5%.
Results
1. Personal exposure dose measurement result The personal exposure doses of radiation workers, radia- tion-related workers, and frequent visitors to this institute were
Table 2. Number of workers exceeding the mean effective dose in their position between 2011 and 2015.
Position 2011 2012 2013 2014 2015
N* % N* % N* % N* % N* %
Neutron therapy facility (P1) 1 3.70 2 6.90 1 3.85 1 4.35 1 6.67
Radioactive pharmaceuticals research team (P2)
4 14.81 3 10.34 2 7.69 3 13.04 2 13.33
Radioactive pharmaceuticals production center (P3)
8 29.63 9 31.03 7 26.92 7 30.43 5 33.33
Nuclear medicine (P4) 10 37.04 10 34.48 10 38.46 10 43.48 6 40.0
I-131 treatment ward (P5) 4 14.81 5 17.24 6 23.08 2 8.70 1 6.67
Total 27 100.00 29 100.00 26 100.00 23 100.00 15 100.00
*The number of workers exceeding the mean effective dose in their positions.
Fig. 1. Annual collective dose of radiation workers by position between 2011 and 2015.
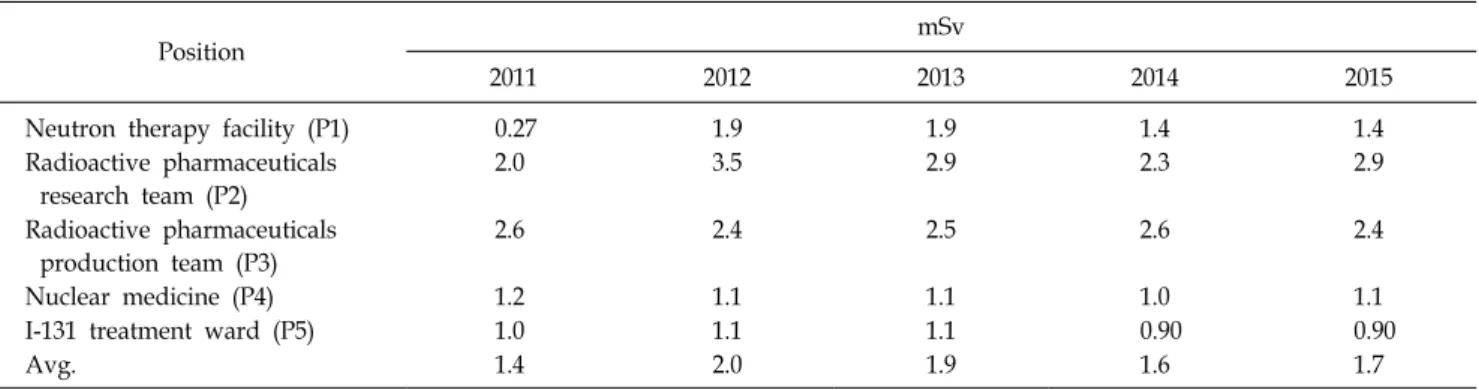
Table 1. Annual average effective dose distribution by position between 2011 and 2015.
Position mSv
2011 2012 2013 2014 2015
Neutron therapy facility (P1) 0.27 1.9 1.9 1.4 1.4
Radioactive pharmaceuticals research team (P2)
2.0 3.5 2.9 2.3 2.9
Radioactive pharmaceuticals production team (P3)
2.6 2.4 2.5 2.6 2.4
Nuclear medicine (P4) 1.2 1.1 1.1 1.0 1.1
I-131 treatment ward (P5) 1.0 1.1 1.1 0.90 0.90
Avg. 1.4 2.0 1.9 1.6 1.7
analysis was performed by year, location, age, and gender, and the number of analyses was 1,831. A total 6,443 cases of per- sonal exposure dose analysis results by year and quarter are shown.
Table 1 shows the mean effective doses by radiation-con- trolled areas from 2011 till 2015. Though the maximum value of the collective effective dose occurred in the radiopharma- ceuticals laboratory (P2) in 2012, the maximum value of the mean effective dose was recorded to be 3.5 mSv in the radio- pharmaceuticals laboratory (P2) in 2012. Other than 3.5 mSv, the values were maintained below 3 mSv.
Fig. 1 shows the collective effective dose distribution of ma- jor radiation-controlled areas from 2011 till 2015 in an annual increase/decrease trend graph. In the case of the collective ef- fective dose, a 5 year maximum dose of 56 mSv was meas- ured in the radioactive pharmaceuticals production team (P3).
Because of this, though the graph of total collective effective
to 84 mSv showing a decrease rate of 47.5% from 161 mSv,
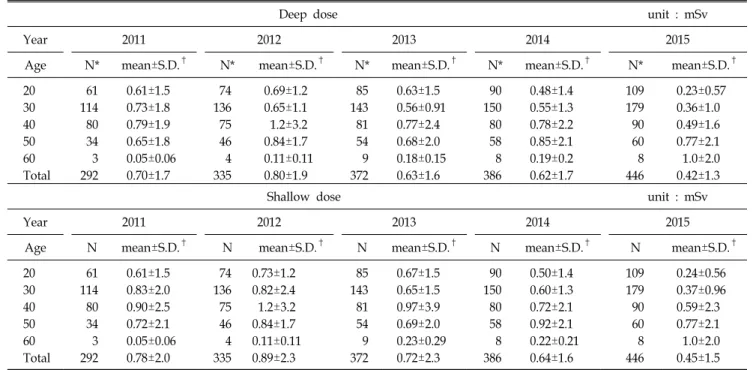
Table 4. Mean and standard deviation of the depth dose and surface dose by age between 2011 and 2015.
Deep dose unit : mSv
Year 2011 2012 2013 2014 2015
Age N* mean±S.D.† N* mean±S.D.† N* mean±S.D.† N* mean±S.D.† N* mean±S.D.†
20 61 0.61±1.5 74 0.69±1.2 85 0.63±1.5 90 0.48±1.4 109 0.23±0.57
30 114 0.73±1.8 136 0.65±1.1 143 0.56±0.91 150 0.55±1.3 179 0.36±1.0
40 80 0.79±1.9 75 1.2±3.2 81 0.77±2.4 80 0.78±2.2 90 0.49±1.6
50 34 0.65±1.8 46 0.84±1.7 54 0.68±2.0 58 0.85±2.1 60 0.77±2.1
60 3 0.05±0.06 4 0.11±0.11 9 0.18±0.15 8 0.19±0.2 8 1.0±2.0
Total 292 0.70±1.7 335 0.80±1.9 372 0.63±1.6 386 0.62±1.7 446 0.42±1.3
Shallow dose unit : mSv
Year 2011 2012 2013 2014 2015
Age N mean±S.D.† N mean±S.D.† N mean±S.D.† N mean±S.D.† N mean±S.D.†
20 61 0.61±1.5 74 0.73±1.2 85 0.67±1.5 90 0.50±1.4 109 0.24±0.56
30 114 0.83±2.0 136 0.82±2.4 143 0.65±1.5 150 0.60±1.3 179 0.37±0.96
40 80 0.90±2.5 75 1.2±3.2 81 0.97±3.9 80 0.72±2.1 90 0.59±2.3
50 34 0.72±2.1 46 0.84±1.7 54 0.69±2.0 58 0.92±2.1 60 0.77±2.1
60 3 0.05±0.06 4 0.11±0.11 9 0.23±0.29 8 0.22±0.21 8 1.0±2.0
Total 292 0.78±2.0 335 0.89±2.3 372 0.72±2.3 386 0.64±1.6 446 0.45±1.5
*The number of measurement by age. †Harmonic mean±harmonicstandard deviation.
Table 3. Mean and standard deviation of the depth dose and surface dose between 2011 and 2015.
Year N* Mean±S.D.†
Deep dose Shallow dose
2011 292 0.70±1.7a 0.78±2.1a
2012 335 0.80±1.9a 0.89±2.3a
2013 372 0.63±1.6a,b 0.72±2.3a,b
2014 386 0.62±1.7a,b 0.64±1.6a,b
2015 446 0.42±1.3c 0.45±1.5c
Total 1,831 0.62±1.6 0.68±2.0
Unit: mSv.
a,b,c
The same parameters show no difference between years.
*Number of measurements according to year. †Harmonic mean±
harmonic standard deviation.
the 5 year maximum collective effective dose in 2012.
Table 2 shows the numbers (N) and percentages (%) of ra- diation workers whose annual depth doses exceeded the mean effective dose of each location in Table 1. The departments in which the workers were exposed to radiation not smaller than the annual mean effective dose were found to be mainly the four remaining locations excluding the neutron therapy facility (P1). As we can see from Table 2, while the total number of radiation workers who were exposed to radiation in excess of the annual mean effective dose of each position was as big as 120, the number of workers who were exposed to radiation in excess of 20 mSv from 2011 till 2015 was only one. The depth dose of 24 mSv in the radioactive pharmaceuticals re- search team (P2) was shown to be the highest exposure dose for 5 years. The radiation-controlled area that recorded the largest number of workers who were exposed to radiation in excess of the mean effective dose every year was shown to be the department of nuclear medicine (P4).
Table 3 shows the annual depth dose and surface dose.
With the exception of an increase in the surface dose in 2012, the values showed a gradually decreasing trend until 2015.
Both the 5 year mean depth dose and mean surface dose were measured to be lower than those of 2011, 2012, and 2013. In the one-way ANOVA, both the depth dose and surface dose showed a significant difference (p<0.05) between the groups in 2012 and 2015 recording a significance probability of p=0.021 and p=0.024, respectively.
The mean and standard deviation of the depth dose and sur-
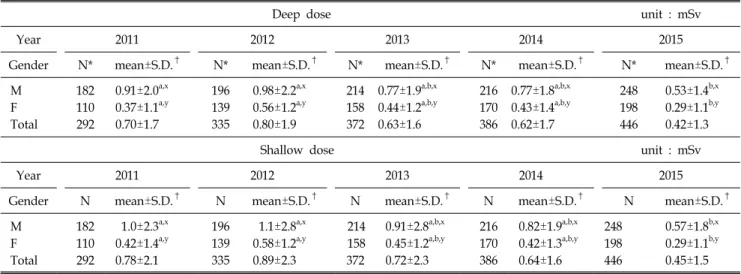
Table 5. Mean and standard deviation of the depth dose and surface dose by gender between 2011 and 2015.
Deep dose unit : mSv
Year 2011 2012 2013 2014 2015
Gender N* mean±S.D.† N* mean±S.D.† N* mean±S.D.† N* mean±S.D.† N* mean±S.D.†
M 182 0.91±2.0a,x 196 0.98±2.2a,x 214 0.77±1.9a,b,x 216 0.77±1.8a,b,x 248 0.53±1.4b,x F 110 0.37±1.1a,y 139 0.56±1.2a,y 158 0.44±1.2a,b,y 170 0.43±1.4a,b,y 198 0.29±1.1b,y
Total 292 0.70±1.7 335 0.80±1.9 372 0.63±1.6 386 0.62±1.7 446 0.42±1.3
Shallow dose unit : mSv
Year 2011 2012 2013 2014 2015
Gender N mean±S.D.† N mean±S.D.† N mean±S.D.† N mean±S.D.† N mean±S.D.†
M 182 1.0±2.3a,x 196 1.1±2.8a,x 214 0.91±2.8a,b,x 216 0.82±1.9a,b,x 248 0.57±1.8b,x F 110 0.42±1.4a,y 139 0.58±1.2a,y 158 0.45±1.2a,b,y 170 0.42±1.3a,b,y 198 0.29±1.1b,y
Total 292 0.78±2.1 335 0.89±2.3 372 0.72±2.3 386 0.64±1.6 446 0.45±1.5
*Number of measurement by gender. †Harmonic mean±harmonic standard deviation.
a,bSame parameters show no difference between years. x,ySame parameters show no difference between gender.
The age is distributed from the twenties to the sixties and the percentage of the thirties is the highest showing a value of about 40%. Both the depth and surface doses were shown to be the highest in the forties showing a value of (1.2±3.2) mSv and (1.2±3.2) mSv, respectively and were shown to be the lowest in the sixties showing a value of (0.11±0.11) mSv. In the two-way ANOVA, there was a significant difference (p <
0.05) between the depth doses of age groups showing a value of p=0.04.
The mean and standard deviation of depth and surfaces doses by gender from 2011 till 2015 are shown in Table 5.
While both the numbers of male and female workers in- creased, the depth and surface doses showed a gradually de- creasing trend from 2012, and both the depth dose (0.98±2.2 mSv) and surface dose (1.1±2.8 mSv) of male workers in 2012 were shown to be the highest. In the two-way ANOVA, both the depth dose and surface dose showed a significant dif- ference (p<0.0001) between the gender groups, and only the depth dose showed a significant difference (p=0.047) between the year groups.
2. Measurement result of spatial dose rate and surface contamination level
The spatial dose rate and surface contamination level of ra-
Dec. 31, 2015 were measured and analyzed. The analysis was performed by year, month, quarter, and location and the num- bers of analyses were 24,138 and 22,367, respectively.
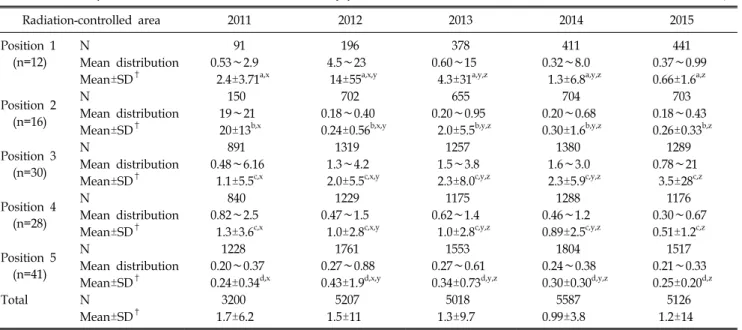
The annual mean distributions, means, and standard devia- tions of the spatial dose rate and surface contamination level by radiation-controlled area are shown in Table 6 and Fig. 2, and Table 7 and Fig. 3, respectively. The annual mean dis- tribution is the range of monthly minimum and maximum val- ues of each measurement spot of each location. It shows that the spatial dose rate is mostly managed not to exceed 10 μ Sv/h, and the surface contamination level is mostly controlled not to exceed 40 KBq/m2. The cases of spatial dose rate and surface contamination level, where the prescribed reference values were exceeded, were found to be 2 and 0, respectively.
In the case of the spatial dose rate, P2 in 2011 and P1 in 2012 exceeded the legally prescribed values showing a value of 20 μSv/h and 14 μSv/h, respectively. In the two-way ANOVA, the years and locations showed a significant differ- ence (p<0.0001) between the groups as well as within the groups.
According to Fig. 2, the spatial dose rate of P2 showed a decrease rate of about 98% between 2011 and 2012. Though spatial dose rate of neutron therapy facility (P1) showed an in- creasing rate of about five times in 2012, the total curve
Table 6. Mean spatial dose rate and mean distribution by position between 2011 and 2015. Unit: μSv/h
Radiation-controlled area 2011 2012 2013 2014 2015
Position 1 (n=12)
N 91 196 378 411 441
Mean distribution 0.53∼2.9 4.5∼23 0.60∼15 0.32∼8.0 0.37∼0.99
Mean±SD† 2.4±3.71a,x 14±55a,x,y 4.3±31a,y,z 1.3±6.8a,y,z 0.66±1.6a,z Position 2
(n=16)
N 150 702 655 704 703
Mean distribution 19∼21 0.18∼0.40 0.20∼0.95 0.20∼0.68 0.18∼0.43
Mean±SD† 20±13b,x 0.24±0.56b,x,y 2.0±5.5b,y,z 0.30±1.6b,y,z 0.26±0.33b,z Position 3
(n=30)
N 891 1319 1257 1380 1289
Mean distribution 0.48∼6.16 1.3∼4.2 1.5∼3.8 1.6∼3.0 0.78∼21
Mean±SD† 1.1±5.5c,x 2.0±5.5c,x,y 2.3±8.0c,y,z 2.3±5.9c,y,z 3.5±28c,z Position 4
(n=28)
N 840 1229 1175 1288 1176
Mean distribution 0.82∼2.5 0.47∼1.5 0.62∼1.4 0.46∼1.2 0.30∼0.67
Mean±SD† 1.3±3.6c,x 1.0±2.8c,x,y 1.0±2.8c,y,z 0.89±2.5c,y,z 0.51±1.2c,z Position 5
(n=41)
N 1228 1761 1553 1804 1517
Mean distribution 0.20∼0.37 0.27∼0.88 0.27∼0.61 0.24∼0.38 0.21∼0.33
Mean±SD† 0.24±0.34d,x 0.43±1.9d,x,y 0.34±0.73d,y,z 0.30±0.30d,y,z 0.25±0.20d,z
Total N 3200 5207 5018 5587 5126
Mean±SD† 1.7±6.2 1.5±11 1.3±9.7 0.99±3.8 1.2±14
*Number of measurements by position. †Harmonic mean±Harmonic standard deviation.
a,b,c,d
The same parameters show no difference between years. x,yThe same parameters show no difference between positions.
Fig. 2. Annual average of the spatial dose rate by position between 2011 and 2015.
showed a decreasing trend due to a decrease in the spatial dose rate of the radioactive radiopharmaceuticals research team (P2) and spatial dose rate was maintained at 10 μSv/h or lower as a whole from 2013. On the other hand, in Fig. 3, the I-131 treatment ward (P5) and total curve showed similar de- crease rates. The change in the surface contamination level of the remaining locations excluding P5 was 2.0 kBq/m2 at max- imum, which was not a significant level.
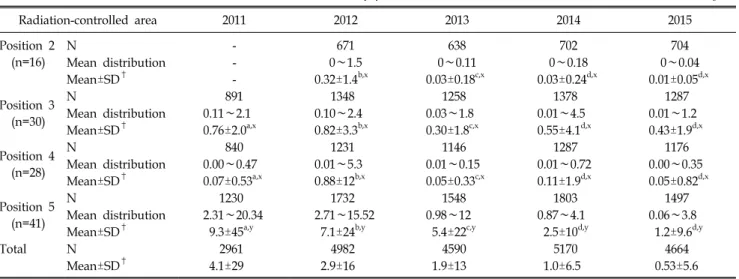
According to Fig. 3, the annual mean surface contamination level did not exceed the reference value for five years, and the highest surface contamination level for five years was shown to be 9.3 KBq/m2 of the I-131 treatment ward (P5) in 2011.
According to Table 7, the annual mean surface con- tamination level did not exceed the reference value for five years, and the highest surface contamination level for five years was found to be 9.3 KBq/m2 of P5 in 2011. In the two-way ANOVA, the years and locations showed a sig- nificant difference (p<0.0001) between the groups and within the groups.
Discussion
According to the results of statistically analyzing the person- al exposure dose, spatial dose rate, and surface contamination level for five years, the values were confirmed to be mostly controlled and operated not to exceed the reference values in average. Two cases of spatial dose rates exceeded 10 μSv/h, the limit of the external radiation dose rate, and it seems that both the measurement of the spatial dose rate during high-dose radiation work and an increase in radiation working time of handling an unsealed source greatly contributed to an excess
Radiation-controlled area 2011 2012 2013 2014 2015 Position 2
(n=16)
N - 671 638 702 704
Mean distribution - 0∼1.5 0∼0.11 0∼0.18 0∼0.04
Mean±SD† - 0.32±1.4b,x 0.03±0.18c,x 0.03±0.24d,x 0.01±0.05d,x
Position 3 (n=30)
N 891 1348 1258 1378 1287
Mean distribution 0.11∼2.1 0.10∼2.4 0.03∼1.8 0.01∼4.5 0.01∼1.2
Mean±SD† 0.76±2.0a,x 0.82±3.3b,x 0.30±1.8c,x 0.55±4.1d,x 0.43±1.9d,x
Position 4 (n=28)
N 840 1231 1146 1287 1176
Mean distribution 0.00∼0.47 0.01∼5.3 0.01∼0.15 0.01∼0.72 0.00∼0.35
Mean±SD† 0.07±0.53a,x 0.88±12b,x 0.05±0.33c,x 0.11±1.9d,x 0.05±0.82d,x Position 5
(n=41)
N 1230 1732 1548 1803 1497
Mean distribution 2.31∼20.34 2.71∼15.52 0.98∼12 0.87∼4.1 0.06∼3.8
Mean±SD† 9.3±45a,y 7.1±24b,y 5.4±22c,y 2.5±10d,y 1.2±9.6d,y
Total N 2961 4982 4590 5170 4664
Mean±SD† 4.1±29 2.9±16 1.9±13 1.0±6.5 0.53±5.6
*Number of measurements by position.
†Harmonic mean±Harmonic standard deviation.
a,b,c,d
The same parameters show no difference between years.
x,yThe same parameters show no difference between positions.
Fig. 3. Annual average of the surface contamination by position between 2011 and 2015.
of the reference value in particular.
As a result of analyzing the collective effective doses by lo- cation for five years in Fig. 1, the change in a specific depart- ment is shown to have an effect on the overall dose of a radi- ation-controlled area. In particular, the effect of individual workers in the radioactive pharmaceuticals research team (P2) who were exposed to 24 mSV was found to be large. For this reason, when handling an unsealed source, a worker should carry a portable radioscope so that the spatial dose rate in the work area can be checked and if 10 μSv/h is exceeded and
the alarm system is activated, it should be immediately noti- fied to a radiation safety manager. If such a basic protective action is not taken, the exposure dose of a worker increases ir- respective of the shielding facility or control of a radiation safety manager.
The mean effective doses by location for five years in Table 1 are the values obtained by dividing the collective effective doses by the number of workers and indicating the dose to which individual radiation workers are exposed on average. A dose of 3.5 mSv was measured at the radioactive pharmaceut- icals research team (P2) in 2012, but the values for remaining locations were shown to be smaller than 3 mSv, and though there were departments in which the doses of some workers were particularly high, because the number of such workers is smaller than the number of workers who were exposed to radi- ation smaller than the reference value, it is thought that the annual means seem to be low.
In Table 2, which shows the number of workers who were exposed to radiation higher than the mean effective dose of each location, the distribution of the department of nuclear medicine (P4) was shown to be large. Though its recorded mean effective doses were lower than those of the radioactive pharmaceuticals research team (P2) and radioactive pharma- ceuticals production team (P3) as the values were distributed
close to 1 mSv for five years, the number of workers who were exposed to radiation not smaller than the mean effective dose was the highest. It is because the radiological technolo- gists of the department of nuclear medicine are exposed to ra- diation more frequently than the other workers and their work hours are longer, though they handle low-dose radiation gen- erators for diagnosis. In addition, it is difficult to completely block the radiation only with a shielding facility, to which the patient or worker is exposed, when an isotope is injected into a patient in a distribution room of the department of nuclear medicine.
In the case of radiation oncology where high-dose radiation generators are used, the 5 year average was measured to be 0.22 mSv, which is only about 20% of 1.2 mSv, the 5 year average of the department of nuclear medicine. This implies that even in the case that low-dose radiation generators are handled, the workers are required to wear a shielding device and have safety consciousness in the aspect of radiation protection.
In Table 3, the averages of annual depth doses and surface doses were the highest in 2012 and, though the number of workers increased, the values overall showed a decreasing trend. This seems to be because a radiation safety manager has continuously managed the shielding facilities of radiation-con- trolled areas and thoroughly managed the exposure dose of workers. The overall radiation work and source management cannot be completely controlled with only the education of ra- diation workers by a safety manager. Exposure dose manage- ment can be achieved continuously and properly only when the effort of each individual worker is accompanied.
As a result of analyzing the personal exposure dose by age, both depth doses and surface doses were shown to be high in the forties and fifties as shown in Table 4. In the thirties, which had the biggest number of workers, the dose was not measured to be high and this is because, though the thirties is the age group that performs radiation works most actively, the number of workers among the thirties who recorded exposure doses below 1 mSv was a minimum 80% to a maximum 92%.
This result appears because the number of workers who are not actually exposed to radiation is large.
In Table 5, which shows depth doses and surface doses by gender, the exposure doses of male workers were measured to
be higher than those of female workers. The number of male workers showed a difference of 25% at minimum to 65% at maximum, and though the numbers of both male and female workers increased from 2011 till 2015, the distribution of workers with small exposures was shown to have contributed greatly to a decrease in the annual dose in practice.
Fig. 2 shows that the measured spatial dose rates were serious. Values of (20±13) μSv/h and (14±55) μSv/h were recorded in both the radioactive pharmaceuticals research team (P2) in 2011 and neutron therapy facility (P1) in 2012, respectively. When workers should complete a work in a place of which the spatial dose rate was measured to be high, the workers should be informed not to stay in the place except working hours by frequently checking the EPD (Electronic Personal Dosimeter) and unnecessary external exposure is re- quired to be prevented.
If the exposure dose of a worker has a risk of exceeding the annual limit, preventing the cause of the increase in the spatial dose rate in advance by limiting the work will help in securing the safety of workers.
In the case of the surface contamination level shown in Fig.
3, a concentrated distribution was shown in the Iodine-131 treatment ward (P5). The measurement spots with exceeding reference values were all shown to be the entrance door of io- dine-131 treatment ward, rest room, and the section in front of the bed. For this results, the patients should be controlled and regulated lest either urine or saliva of patients should cause secondary contamination. Additionally, quick actions of decon- tamination should be taken by frequently checking the surface contamination of the rooms of patients in which patients are hospitalized. It is important to prevent contamination and dif- fusion of air and to manage the surface contamination level below the reference value through secondary measurements. As to the spatial dose rate shown in Fig. 2, the trends of the neu- tron therapy facility (P1) and radioactive pharmaceuticals re- search team (P2) are similar to a graph of the total spatial dose rate of the five locations, and the level of total surface contamination in Fig. 3 is shown to be similar to that of the iodine-131 treatment ward (P5). In common with the personal exposure dose, the spatial dose rate and surface contamination level of a specific department were shown to greatly contribute to annual change. As the neutron therapy facility (P1) is a fa-
generators for experiment and research are operated, it was ex- cluded from the surface contamination level measurement. As there is a risk of leakage or discharge from the body because unsealed sources are used for research and treatment in the re- maining P2, P3, P4, and P5 facilities, surface contamination level measurements were made for these facilities.
As it is impossible to measure the spatial dose rate and sur- face contamination level at the same time when the same radi- ation work is performed even though measured by same meas- urer, it is difficult to consider them as absolute values.
Accordingly, for radiation safety management, it is required to manage the real-time exposure doses by installing a real-time monitoring device like wearing an EPD and setting an alarm system. This institute has given an EPD to each worker of the radioactive pharmaceuticals production team (P3) where the largest amount of unsealed source is handled among the de- partments specified as radiation-controlled areas to manage the entrance/exit records. EPDs should be additionally given to the major radiation workers who handle the largest amount of un- sealed source in the radioactive pharmaceuticals research team (P2) where the biggest personal exposure dose for five years has occurred so that the personal exposure dose could be man- aged in real time.
Conclusion
As a result of analyzing the work environment and doses of the workers for 5 years, we could find that the annual change in the personal exposure doses and spatial dose rates of the ra- dioactive pharmaceuticals research team (P2) were similar to the annual change trend of this entire institute. Accordingly, it is shown that the work environment of radiation workers should be upgraded by improving the distribution facility or shielding device. The radiation workers who handle a high-dose unsealed source should bring a real-time radiation dose measuring instrument such as an EPD or a portable ra- dioscope without fail to check the exposure dose and spatial dose in real time and to prevent unnecessary exposure to
the I-131 treatment ward (P5) was found to be significant.
Accordingly, as the decontamination work of a patient’s room is accomplished as soon as patients treated with radioiodine are discharged from the hospital, a secondary decontamination work is required after identifying whether a concerned con- taminant is detected by measuring the surface contamination level.
Analyzing only the work environment and doses of workers of this institute has limitations and the relative exposure trend is also required to be identified by comparing the data with those of other institutes or hospitals.
References
1. Korean Association for Radiation Application: Survey on the Status of Radiation/RI Utilization in 2014, Seoul (2016), pp.
3-5
2. Seok GK, Yong MK, Chang KK, Ho YY, Si YJ, Eun OH:
Introduction to radiation management, Radiat Sci 3-5 (2012) 3. Jai KL: Elements of radiation protection. Korean Assoc Radiat
Appl 2: 607-613 (2016)
4. Park JK, Cho EH: Measurement of the spatial dose rate for distribution room in department of nuclear medicine. J Digit Conten Soc 151-157 (2012)
5. Tack HH, Kang SC: Development of automatic smear equip- ment for measuring surface radioactivity contamination. J Korea Ind Inf Syst Res 37-44 (2011)
6. Jai KL: Elements of radiation protection. Korean Assoc Radiat Appl 1: 268-283, 305-311 (2016).
7. Nuclear Safety Act No. 13545: Definition of Radiation- controlled Area (2016)
8. Enforcement Ordinance of Nuclear Safety Act No. 2:
Definition of Dose Limit (2016)
9. ICRP Publication 94: Release of patients after therapy with unsealed radionuclides Ann. ICRP 34 (2): 53-58 (2005) 10. Radioisotope Journal: Measurement of the spatial dose rate,
17 (2): 97-102 (2002)
11. Notification of Nuclear Safety and Security Commis- sion No.14: Limit of external radiation rate (2014)
12. Moon JS, Park DS, Kim SK, Jeong HI: A study of meas- uring the surface contamination for patient’s clothes and bed- clothes after ablation therapy. Korean J Nucl Med Technol 3-12 (2008)
13. Article of Nuclear Safety and Security No.2014-34:
Reference about Radiation Protection (2014)