• 검색 결과가 없습니다.

Estimating Wildfire Fuel Load of Coarse Woody Debris usingNational Forest Inventory Data in South Korea

N/A
N/A
Protected

Academic year: 2021

Share "Estimating Wildfire Fuel Load of Coarse Woody Debris usingNational Forest Inventory Data in South Korea"

Copied!
8
0
0

로드 중.... (전체 텍스트 보기)

전체 글

(1)

Estimating Wildfire Fuel Load of Coarse Woody Debris using National Forest Inventory Data in South Korea

Choi, Suwon

*

, Lee, Jongyeol

**

, Han, Seung Hyun

**

, Kim, Seongjun

**

and Son, Yowhan

*,**†

*

Dept. of Climate Environment, Graduate School of Life and Environmental Sciences, Korea University, Seoul 136-713, Korea

**

Dept. of Environmental Science and Ecological Engineering, Graduate School, Korea University, Seoul 136713, Korea

ABSTRACT

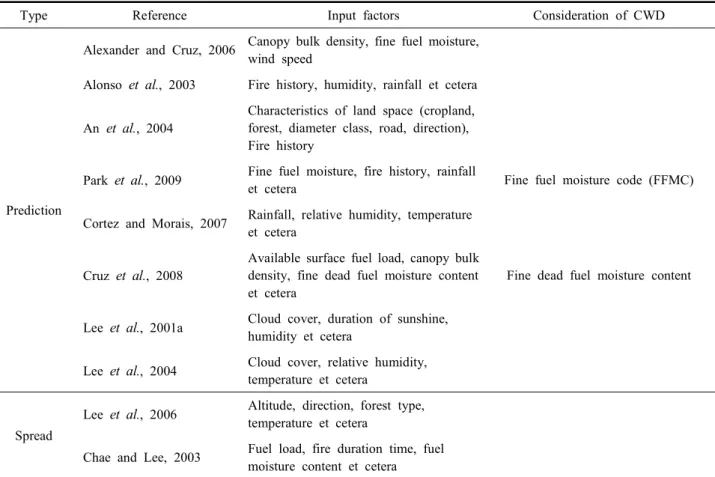
This study presents an estimate of on-site surface fuel loadings composed of coarse woody debris (CWD) using 5
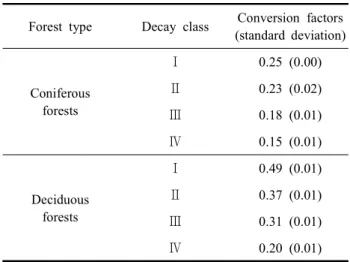
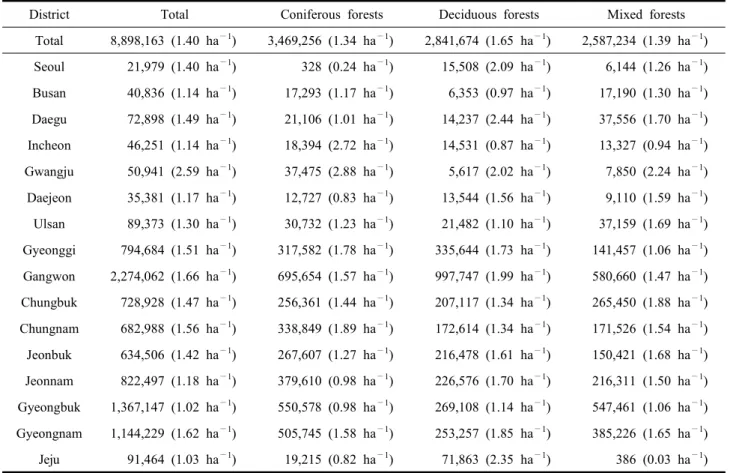
th

National Forest Inventory (NFI) data in South Korea. We classified CWD data into forest type, region and decay class, and used conversion factors by decay class and tonne of oil equivalent developed in the country. In 2010, the total wildfire fuel load of CWD was estimated as 8.9 million TOE; those of coniferous, deciduous and mixed forests were 3.5 million TOE, 2.8 million TOE and 2.6 million TOE, respectively. Gangwon Province had the highest wildfire fuel load of CWD (2.3 million TOE), whereas Seoul exhibited the lowest wildfire fuel load of CWD (0.02 million TOE).

Wildfire fuel loads of CWD were estimated as 2.9 million TOE, 1.9 million TOE, 2.4 million TOE and 1.7 million TOE for decay classes I, II, III and IV, respectively. The total wildfire fuel load of CWD corresponded to the calorific value of 8.2 million tons crude oil, 2.46% of that of living trees. Proportionate to the growing stock, total wildfire fuel load of CWD was in a broad distinction by region, while its TOE ha

-1

was not. This implies that there is no need to establish different guidelines by region for management of CWD. The results of this work provide a baseline study for scientific policy guidelines on preventing wildfires by proposing CWD as wildfire fuel load.

Key Words: Wildfire, Coarse Woody Debris, Forest Fuel, National Forest Inventory

Corresponding author : [email protected]

Received July 15, 2015 / Revised August 4, 2015(1st), September 7, 2015(2nd) / Accepted September 21, 2015

1. INTRODUCTION

Climate change has brought an increase in average global temperatures and resulted in extreme meteorological events such as drought, longer spells of dry heat or intense rain (IPCC, 2012), and with an increase in the risk of large fires across the land and forested areas threats imposed to nature and human society have risen (Lee et al., 2001b; Fried et al., 2004; KFS, 2010). In order to reduce the fire caused damages fire prediction or spread models needs to be more elaborated.

Coarse woody debris (CWD) is a piece of woody material in the form of sound or rotting logs like a fallen dead trees or snags known as dead standing trees resulted from anthropogenic activities and natural phenomena (Harmon et al., 1986; Kim et al., 2006). CWD plays key roles not only for biodiversity conservation (Böhl and Brändli, 2007; Jönsson and Jonsson, 2007; Manning et al., 2007; Yoon et al., 2014) but also for

wildfire occurrence (USDA, 2003). CWD is an important functional and structural component of forested ecosystems in that it can catch fire easier than living trees due to its low moisture content and density (Stevens et al., 2014). Furthermore, it can mediate the transition of ground fire into crown fire (USDA, 2003; Passovoy et al., 2006). In terms of wildfires, most studies consider only living trees to be wildfire fuel. Few studies have included CWD as wildfire fuel (Cruz et al., 2008;

Park et al., 2009). In case of wildfire models, most wildfire forecasts or spread models have not considered CWD data as input material (Table 1).

Growing stocks in South Korean forests has been expanding

steadily (KFS, 2014; Lee et al., 2014). In line with those steady

growth of growing stock has the large piles of CWD been in-

creased (KFRI, 2011; Lee et al., 2014; Lee et al., 2015). It

is directly associated with an increase in wildfire fuel loadings

of CWD which in turn has made the forested area exhibited

(2)

Table 1. Input factors of 10 reviewed principal wildfire models

Type Reference Input factors Consideration of CWD

Prediction

Alexander and Cruz, 2006 Canopy bulk density, fine fuel moisture, wind speed

Alonso et al. , 2003 Fire history, humidity, rainfall et cetera

An et al. , 2004

Characteristics of land space (cropland, forest, diameter class, road, direction), Fire history

Park et al. , 2009 Fine fuel moisture, fire history, rainfall

et cetera Fine fuel moisture code (FFMC)

Cortez and Morais, 2007 Rainfall, relative humidity, temperature et cetera

Cruz et al. , 2008

Available surface fuel load, canopy bulk density, fine dead fuel moisture content et cetera

Fine dead fuel moisture content

Lee et al. , 2001a Cloud cover, duration of sunshine, humidity et cetera

Lee et al. , 2004 Cloud cover, relative humidity, temperature et cetera

Spread

Lee et al. , 2006 Altitude, direction, forest type, temperature et cetera

Chae and Lee, 2003 Fuel load, fire duration time, fuel moisture content et cetera

to the growing fire hazard. Recent studies related to wildfires have only focused on suggesting ways to lower the fuel load of post-wildfire CWD while retaining its benefits (Tinker and Knight, 2000; USDA, 2003; Passovoy et al., 2006; IPCC, 2012).

However, no research on the estimate of wildfire fuel load of CWD has been undertaken presumably because of an under- valued CWD's significance and a lack of academic interest in quantification of its wildfire fuel load. In regards to these cha- llenges, this study aimed to estimate wildfire fuel load of CWD using the 5th National Forest Inventory data in South Korea.

To produce the estimate, we classified wildfire fuel load of CWD by forest type, region and decay class. The results of this study is projected to serve as a foundation for scientific policy guidelines on preventing wildfires.

2. MATERIALS AND METHODS

The process of identification and estimation of a total site load consists of three steps as follows. The first step is to

categorize CWD data into forest type (coniferous forests, de- ciduous forests and mixed forests), region (metropolitan area of city and province) and decay class ( Ⅰ, Ⅱ, Ⅲ and Ⅳ followed by NFI guideline), in which we created the GIS coordinates of CWD that was not present in the original data.

The second step is to apply the CWD data by volume, employ conversion factors by decay class, and convert it into CWD mass. The third step is multiplying CWD mass and its tonne of oil equivalent (TOE), from which we estimated wildfire fuel load of CWD consequently.

2.1 The 5th National Forest Inventory

The National Forest Inventory (NFI) in South Korea has been carried out for five year periods beginning in 1972 (Yim et al., 2015). The purpose of the NFI application is to provide basic information obtained by scientific methods of identifying the ecological dynamics of South Korean forests (KFRI, 2011).

The CWD data used in this study was acquired from the 5th

(3)

NFI, which had been collected utilizing fuel-sampling methods during 2006∼2010 (sample plots size: 20 m × 20 m, radius:

11.3 m, targeted-over middle diameter of CWD: ≥ 6 cm).

NFI CWD data includes middle diameter, length, tree species, decay classes and cause of death (KFRI, 2011). We selected 44,772 sample plots for CWD, excluding denuded and bamboo forests. While the original NFI data does not contain the GIS coordinates of CWD, we could estimate the GIS coordinate of CWD from the number of settlements in the original NFI data set; and through the estimated GIS coordinate, we deduced regional segment of CWD data as a result.

2.2 Conversion Factors by Decay Class

Conversion factors were used to convert CWD density data to CWD mass data. CWD density differs among decay class (Sandström et al., 2007) and the appropriate CWD density factors therefore need to be applied to each decay class. There have been previous studies which examined changes in con- version factors by decay class through sampling and analysis method (Cheung and Brown, 1995; Harmon et al., 2000; Sand- ström et al., 2007; Yoon et al., 2011). We used the conversion factors by decay class developed by Yoon et al. (2011) because of its high representativeness of the typical South Korean forest species Pinus densiflora and Quercus mongolica. We assumed that the conversion factors for Pinus densiflora would represent coniferous forests and the ones for Quercus mongolica would represent deciduous forests (Table 2). In cases of mixed forests, we used averages of coniferous and deciduous forest conversion factors, which were 0.37 for decay class Ⅰ, 0.30 for decay class

Ⅱ, 0.25 for decay class Ⅲ and 0.18 for decay class Ⅳ, respec- tively (Yoon et al., 2011).

2.3 Tonne of Oil Equivalent

Recent studies have frequently presented energy units by using TOE (Pimentel and Pimentel, 2007); 1 TOE is equivalent to energy of 10 million kcal (Han and Seo, 2010). According to South Korea Energy Basic Law Enforcement Regulations Article 5, 1 ton of firewood and charcoal can be converted to 0.45 TOE (KFRI, 2014).

3. RESULTS

Table 2. Conversion factors by decay class (Yoon et al. , 2011)

Forest type Decay class Conversion factors (standard deviation)

Coniferous forests

Ⅰ 0.25 (0.00)

Ⅱ 0.23 (0.02)

Ⅲ 0.18 (0.01)

Ⅳ 0.15 (0.01)

Deciduous forests

Ⅰ 0.49 (0.01)

Ⅱ 0.37 (0.01)

Ⅲ 0.31 (0.01)

Ⅳ 0.20 (0.01)

3.1 Wildfire Fuel Load of CWD

The total wildfire fuel load of CWD was estimated as 8.9 million TOE, which is comparable to the calorific value of 8.1 million tons of crude oil. The total wildfire fuel load of CWD was 2.46% of that of living trees previously reported, and those of coniferous, deciduous and mixed forests accounted for 2.91%, 2.24% and 2.23%, respectively (Son et al., 2014).

By forest type, coniferous, deciduous and mixed forests amoun- ted to 3.5 million TOE, 2.8 million TOE and 2.6 million TOE, respectively. Proportionate to regional growing stock, Gangwon Province had the highest CWD wildfire fuel load (2.3 million TOE), followed by Gyeongbuk Province (1.4 million TOE) and Gyeongnam Province (1.1 million TOE), whereas Seoul exhi- bited the lowest CWD wildfire fuel load (0.02 million TOE) (Table 3). Wildfire fuel loads of CWD by decay classes were estimated to be 2.9 million TOE, 1.9 million TOE, 2.4 million TOE and 1.7 million TOE for decay classes Ⅰ, Ⅱ, Ⅲ and Ⅳ, respectively.

3.2 Wildfire Fuel Load of CWD per Unit Area

The result of total wildfire fuel load of CWD per hectare by

forest areas turned out to be 1.40 TOE ha

—1

; coniferous forests,

deciduous forests and mixed forests were 1.34 TOE ha

—1

, 1.65

TOE ha

—1

and 1.39 TOE ha

—1

, respectively. Gwangju had the

highest wildfire fuel load of CWD (2.59 TOE ha

—1

), followed

by Gangwon (1.66 TOE ha

—1

) and Gyeongnam Province (1.62

(4)

Table 3. Wildfire fuel load of CWD in South Korea (Unit : TOE)

District Total Coniferous forests Deciduous forests Mixed forests

Total 8,898,163 (1.40 ha

—1

) 3,469,256 (1.34 ha

—1

) 2,841,674 (1.65 ha

—1

) 2,587,234 (1.39 ha

—1

) Seoul 21,979 (1.40 ha

—1

) 328 (0.24 ha

—1

) 15,508 (2.09 ha

—1

) 6,144 (1.26 ha

—1

) Busan 40,836 (1.14 ha

—1

) 17,293 (1.17 ha

—1

) 6,353 (0.97 ha

—1

) 17,190 (1.30 ha

—1

) Daegu 72,898 (1.49 ha

—1

) 21,106 (1.01 ha

—1

) 14,237 (2.44 ha

—1

) 37,556 (1.70 ha

—1

) Incheon 46,251 (1.14 ha

—1

) 18,394 (2.72 ha

—1

) 14,531 (0.87 ha

—1

) 13,327 (0.94 ha

—1

) Gwangju 50,941 (2.59 ha

—1

) 37,475 (2.88 ha

—1

) 5,617 (2.02 ha

—1

) 7,850 (2.24 ha

—1

) Daejeon 35,381 (1.17 ha

—1

) 12,727 (0.83 ha

—1

) 13,544 (1.56 ha

—1

) 9,110 (1.59 ha

—1

) Ulsan 89,373 (1.30 ha

—1

) 30,732 (1.23 ha

—1

) 21,482 (1.10 ha

—1

) 37,159 (1.69 ha

—1

) Gyeonggi 794,684 (1.51 ha

—1

) 317,582 (1.78 ha

—1

) 335,644 (1.73 ha

—1

) 141,457 (1.06 ha

—1

) Gangwon 2,274,062 (1.66 ha

—1

) 695,654 (1.57 ha

—1

) 997,747 (1.99 ha

—1

) 580,660 (1.47 ha

—1

) Chungbuk 728,928 (1.47 ha

—1

) 256,361 (1.44 ha

—1

) 207,117 (1.34 ha

—1

) 265,450 (1.88 ha

—1

) Chungnam 682,988 (1.56 ha

—1

) 338,849 (1.89 ha

—1

) 172,614 (1.34 ha

—1

) 171,526 (1.54 ha

—1

) Jeonbuk 634,506 (1.42 ha

—1

) 267,607 (1.27 ha

—1

) 216,478 (1.61 ha

—1

) 150,421 (1.68 ha

—1

) Jeonnam 822,497 (1.18 ha

—1

) 379,610 (0.98 ha

—1

) 226,576 (1.70 ha

—1

) 216,311 (1.50 ha

—1

) Gyeongbuk 1,367,147 (1.02 ha

—1

) 550,578 (0.98 ha

—1

) 269,108 (1.14 ha

—1

) 547,461 (1.06 ha

—1

) Gyeongnam 1,144,229 (1.62 ha

—1

) 505,745 (1.58 ha

—1

) 253,257 (1.85 ha

—1

) 385,226 (1.65 ha

—1

) Jeju 91,464 (1.03 ha

—1

) 19,215 (0.82 ha

—1

) 71,863 (2.35 ha

—1

) 386 (0.03 ha

—1

)

TOE ha

—1

), while Gyeongbuk Province exhibited the lowest wildfire fuel load of CWD (1.02 TOE ha

—1

) (Table 3).

4. DISCUSSION

4.1 Wildfire Fuel Load of CWD by Forest Type While coniferous forests had the highest wildfire fuel load among forest type, coniferous forests have the lowest conver- sion factors of woody density by decay class. The reason for this result is presumed that in 2010 the coniferous forested area was larger than other types of forested area (coniferous forests:

2,580,629 ha, deciduous forests: 1,718,916 ha, mixed forests:

1,864,925 ha) (KFS, 2010). We therefore concluded that wild- fire fuel load of CWD in same size and area would have the highest value in deciduous forests, followed by mixed and coniferous forests.

4.2 Wildfire Fuel Load of CWD by Region

Wildfire fuel load of CWD was positively correlated with growing stock quantity in that Gangwon Province had the highest CWD wildfire fuel load, whereas Seoul exhibited the lowest. The result shows the more growing stock the province has, a higher CWD wildfire fuel load would be. However, the correlations between wildfire fuel load of CWD and growing stock should be supported by further studies on the regional CWD input rate based on the development of NFI data.

4.3 Wildfire Fuel Load of CWD by Decay Class

Decay class Ⅰ had the highest wildfire fuel load of CWD

due to its highest CWD mass and conversion factors of woody

density among the four decay classes. We reasoned that wildfire

fuel load of CWD is reflected in different conversion factors

by forest type and decay class, however, certain degree of un-

certainties remains in the results in that calorific values differ

by tree species (Friedl et al., 2005; Hwang et al., 2011a; Hwang

et al., 2011b; Zeng et al., 2014). Therefore, it is recommended

(5)

that further studies develop the calorific value factors of CWD by tree species in order to deduce more precisely estimate of wildfire fuel load.

Proportionate to the growing stock, total wildfire fuel load of CWD was in a broad distinction by region, forest type and decay class, but that fuel load per hectare was not in a broad distinction by region. This result implies that different guidelines by region are not necessarily established for the management of CWD. Our results may serve as a foundation for scientific policy guidelines on preventing wildfires by proposing CWD as an indication of wildfire fuel load.

ACKNOWLEDGEMENTS

Full funding of for this research was provided by the Korea Ministry of Environment (MOE) as Graduate School Specia- lizing in Climate Change .

REFERENCES

Alexander ME, Cruz M. 2006. Evaluating a model for predic- ting active crown fire rate of spread using wildfire obser- vations. Canadian Journal of Forest Research 36(11):3015- 3028.

Alonso-Betanzos A, Fontenla-Romero O, Guijarro-Berdiñas B, Hernández Pereira E, Andrade M, Jiménez E, Carballas T.

2003. An intelligent system for forest fire risk prediction and fire fighting management in Galicia. Expert Systems with Applications 25(4):545-554.

An S, Lee S, Won M, Lee M, Shin Y. 2004. Developing the forest fire occurrence probability model using gis and map- ping forest fire risks. Journal of the Korean Association of Geographic Information Studies 7(4):57-64. (in Korean with English abstract)

Böhl J, Brändli U. 2007. Deadwood volume assessment in the third Swiss National Forest Inventory: Methods and first results. European Journal of Forest Research 126(3):

449-457.

Chae H, Lee C. 2003. Analysis of forest fire spread rate and fire intensity by a wind model. Korean Society of Agri- cultural and Forest Meteorology 5(4):213-217. (in Korean with English abstract)

Chueng N, Brown S. 1995. Decomposition of silver maple (Acer saccharinum L.) woody debris in a central Illinois bottomland forest. Wetlands 15(3):232-241.

Cortez P, Morais A. 2007. A data mining approach to pre- dict forest fires using meteorological data. University of Minho. Portugal.

Cruz M, Alexander M, Fernandes P. 2008. Development of a model system to predict wildfire behaviour in pine plan- tations. Australian Forestry 71(2):113-121.

Fried J, Torn M, Mills E. 2004. The impact of climate change on wildfire severity: A regional forecast for northern Cali- fornia. Climatic Change 64(1-2):169-191.

Friedl A, Padouvas E, Rotter H, Varmuza K. 2005. Prediction of heating values of biomass fuel from elemental compo- sition. Analytica Chimica Acta 544(1):191-198.

Han S, Seo Y. 2010. International comparative analysis for energy efficiency of transport sectors in OECD countries -using energy intensity method and malmquist approach-.

The Korea Transport Institute 17(4):1-12. (in Korean with English abstract)

Harmon M, Franklin J, Swanson F, Sollins P, Gregory S, Lattin J, Cummins K. 1986. Ecology of coarse woody debris in temperate ecosystems. Advances in Ecological Research 15(133):302.

Harmon M, Krankina O, Sexton J. 2000. Decomposition vec- tors: A new approach to estimating woody detritus decom- position dynamics. Canadian Journal of Forest Research 30(1):76-84.

Hwang J, Oh J, Ji B, Kim P, Lee J, Cha D. 2011a. Estimating the heating value of major coniferous trees by moisture content. Journal of Agricultural Science 38(4):619-624. (in Korean with English abstract)

Hwang J, Oh J, Cha D. 2011b. Estimation of the heating value of major broad-leaved trees due to moisture content.

Journal of Forest Environmental Science 27(2):119-125.

(in Korean with English abstract)

IPCC. 2012. Managing the risk of extreme events and di- sasters to advance climate change adaptation. Cambridge University Press. America.

Jönsson MT, Jonsson B. 2007. Assessing coarse woody de-

bris in Swedish woodland key habitats: Implications for

conservation and management. Forest Ecology and Mana-

(6)

gement 242(2):363-373.

Kim R, Son Y, Lim J, Lee I, Seo K, Koo J, Ihm B. 2006.

Coarse woody debris mass and nutrients in forest eco- systems of Korea. Ecological Research 21(6):819-827.

Korea Forest Research Institute (KFRI). 2011. The 5th national forest inventory report. Ridric. South Korea.

Korea Forest Research Institute (KFRI). 2014. The amount of resources of forest biomass in South Korea and map.

Ridric. South Korea.

Korea Forest Service (KFS). 2014. Statistical yearbook of forestry. 2014(44), pp 496.

Korea Forest Service (KFS). 2010. Wildfire policy changes and countermeasures by statistical analysis of wildfire.

University of Gangwon. South Korea.

Lee B, Chung J, Lee M, Kim D. 2006. Development of fo- rest fire growth prediction model. Korean Institute of Fire Science and Engineering 2006(4):231-237.

Lee J, Han S, Kim S, Chang H, Yi M, Park G, Kim C, Son YM, Kim R, Son Y. 2015. Estimating the changes in forest carbon dynamics of Pinus densiflora and Quercus variabilis forests in South Korea under the RCP 8.5 climate change scenario. Korean Society of Agricultural and Forest Mete- orology 17(1):35-44. (in Korean with English abstract) Lee J, Yoon TK, Han S, Kim S, Yi M, Park G, Kim C, Son

YM, Kim R, Son Y. 2014. Estimating the carbon dynamics of South Korean forests from 1954 to 2012. Biogeosci- ences 11(17):4637-4650.

Lee K, Yu J, Shin K. 2001a. Prediction model of estimating possibility of wildfire in Kangwon area. Atmosphere 11 (3):78-79.

Lee S, Shin Y, Kim S, An S, O J. 2001b. Statistical analysis of forest fire danger period by regions in Korea. Korean Institute of Fire Science and Engineering 2001(11):109- 113.

Lee S, Han S, Won M, An S, Lee M. 2004. Developing of forest fire occurrence probability model by using the me- teorological characteristics in Korea. Korean Journal of Agricultural and Forest Meteorology 6(4):242-249. (in Korean with English abstract)

Manning A, Lindenmayer D, Cunningham R. 2007. A study of coarse woody debris volumes in two box-gum grassy woodland reserves in the Australian Capital Territory.

Ecological Management and Restoration 8(3):221-224.

Park H, Lee S, Chae H, Lee W. 2009. A study on the develop- ment of forest fire occurrence probability model using canadian forest fire weather index occurrence of forest fire in Kangwon Province. Korean Society of Hazard Mitiga- tion 9(3):95-100. (in Korean with English abstract) Passovoy M, Fulé P. 2006. Snag and woody debris dynamics

following severe wildfires in northern Arizona ponderosa pine forests. Forest Ecology and Management 223(1):237- 246.

Pimentel D, Pimentel M. 2007. Food, energy, and society.

CRC Press. America.

Sandström F, Petersson H, Kruys N, Ståhl G. 2007. Biomass conversion factors (density and carbon concentration) by decay classes for dead wood of Pinus sylvestris, Picea abies and Betula spp. in boreal forests of Sweden. Forest Ecology and Management 243(1):19-27.

Son Y, Lee S, Kim S, Hwang J, Kim R, Park H. 2014. Map- ping and assessment of forest biomass resources in korea.

Journal of Korean Forest Society 103(3):431-438. (in Ko- rean with English abstract)

Stevens J, Safford H, Latimer A. 2014. Wildfire-contingent effects of fuel treatments can promote ecological resili- ence in seasonally dry conifer forests. Canadian Journal of Forest Research 44(8):843-854.

Tinker D, Knight D. 2000. Coarse woody debris following fire and logging in Wyoming lodgepole pine forests. Eco- systems 3(5):472-483.

United States Department of Agiculutre (USDA). 2003. Co- arse woody debris: managing benefits and fire hazard in the recovering forest. Rocky Mountain Research Station.

America.

Yim J, Kim R, Lee S, Son Y. 2015. Land-use change assess- ment by permanent sample plots in National Foret Inven- tory. Journal of Climate Change Research 6(1):33-40. (in Korean with English abstract)

Yoon TK, Chung H, Kim R, Noh NJ, Seo K, Lee S, Son Y.

2011. Coarse woody debris mass dynamics in temperate natural forests of Mt. Jumbong, Korea. Journal of Ecology and Environment 34(1):115-125.

Yoon TK, Han S, Lee D, Han SH, Noh NJ, Son Y. 2014.

Effects of sample size and temperature on coarse woody

(7)

debris respiration from Quercus variabilis logs. Journal of Forest Research 19(2):249-259.

Zeng W, Tang S, Xiao Q. 2014. Calorific values and ash

contents of different parts of Masson pine tree in southern

China. Journal of Forestry Research 25(4):779-786.

(8)

수치

Table  1.  Input  factors  of  10  reviewed  principal  wildfire  models
Table  2.  Conversion  factors  by  decay  class  (Yoon  et  al. ,  2011)
Table  3.  Wildfire  fuel  load  of  CWD  in  South  Korea (Unit  :  TOE)

참조

관련 문서

내삶을 바꾸는 숲, 숲 속의 대한민국.. KOREA FOREST

1 John Owen, Justification by Faith Alone, in The Works of John Owen, ed. John Bolt, trans. Scott Clark, "Do This and Live: Christ's Active Obedience as the

EPA, 2005, “Fuel Economy Labeling of Motor Vehicles : Revisions to Improve Calculation of Fuel

key words: forest healing, forest healing factor, forest healing program, forest for healing, urban forest.. 특히 급 격한 도시화 및 산업화에 따라 여가시간

Command and control type environmental policies such as regulation of technology and standard on the emission per unit of fuel used have different effects

Incheon Metropolitan City's green projects took first place in the 2016 Green Fund Support Program organized by the Korea Forest Welfare Institute. The ‘Eco Garden’ plan

Tao, Mechanical and Electrical Systems in Buildings, Prentice Hall,

load and differential output have a superior p p high frequency response over differential amplifiers with current mirror load and. amplifiers with current mirror load