The Macroeconomic Effects of
Dollarization: Ecuador and El Salvador
Mah, Jai-Sheen
The Macroeconomic Effects of Dollarization: Ecuador and El Salvador
This paper analyses and compares the economic performances of two recently dollarized countries. The background situation and motivations of dollarization in Ecuador and El Salvador were significantly different.
Ecuador had been undergoing high inflation rates and an unstable macroeconomic situation. Dollarization in Ecuador contributed to stabilizing macroeconomic performances, especially controlling inflation rates. Meanwhile, El Salvador had not been experiencing the same poor economic situation. Dollarization was implemented mainly for political reasons and did not contribute to improving the macroeconomic situation at all. The effects of dollarization appear to depend primarily on the background situation of the country in question.
[Key Words: dollarization / economic performances / inflation / Ecuador / El Salvador]
<Abstract>
Ⅰ. Introduction
Despite considerable research on exchange rate regimes, the consequences of dollarization have not often been studied. Dollarization in some Latin American countries has brought about contradictory opinions in predicting its performance. The experiences of Panama, where dollarization has been pursued for over 100 years, cannot be considered as a typical case because of its small size and geographical specificity. Two other countries in Latin America, Ecuador and El Salvador, also adopted the US dollar as their legal currency in 2001. Some other Latin American countries have also taken or seriously considered dollarization since then (Dean and Hira, 2004).
Examination of economic performances of the recently dollarized countries can provide clues to the understanding of the effect of dollarization on each country. The purpose of this paper is to analyze the background situation and the macroeconomic consequences of the recently dollarized economies, Ecuador and El Salvador. The examined economic performances of those countries are expected to provide policy implications of dollarization.
This paper poses the following questions among others: first, why and
when would a country adopt full dollarization; second, how is the
macroeconomic performance of the dollarized Latin American countries after
dollarization; and, third, whether or not dollarization fulfilled its expectations
in those countries. The structure of the paper is as follows. Section Ⅱ
reviews the theoretical effect of dollarization. Section Ⅲ deals with the
background and macroeconomic performances of the recently dollarized
economies, Ecuador and El Salvador. Macroeconomic indicators relating to
the actual consequences of dollarization are shown and analyzed in each
country. Section Ⅳ provides the policy implications of dollarization drawn
from the experience of those two countries to the developing countries that
may consider it. Conclusions are provided in Section Ⅴ.
Ⅱ. Dollarization: Pros and Cons
A. ‘De Facto’ versus ‘De Jure’ Dollarization
There are two types of dollarization, i.e. ‘de facto’ and ‘de jure’ (Dean, 2001;
Dean and Hira, 2004). ‘De facto’ dollarization is the general use of the U.S.
dollar, dollar hereafter, in a country where its own legal currency other than dollar exists. It is not formally supported by the government but use of the dollar is prevalent in practice. ‘De facto’ dollarization is widespread in Latin America, since individuals would try to replace their domestic currency holdings, with the dollar to protect the purchasing power of their income due to the high inflation rate. After the debt crisis of the early 1980s, many Latin American countries experienced high inflation rates, larger fiscal deficits, deeper external imbalances and continuous capital flight, which led to a decline of confidence in the domestic currency and, consequently, ‘de facto’ dollarization (Cardoso and Helwege 1995).
‘De jure’ dollarization denotes the adoption of the dollar by government legislation as the legal currency of the country. For ‘de jure’ dollarization, the dollar takes over all the formal functions of the national currency as a unit of account, as a medium of exchange and as a store of value (Dean 2001; Dean and Hira 2004). Panama, Ecuador and El Salvador are the current examples of ‘de jure’ dollarization to the fullest extent.
Panama has adopted the dollar as its legal currency since 1904, after it gained independence from Colombia with the assistance of the U.S. in 1903.
Panama’s macroeconomic performances since the 1970s have been mixed.
For instance, its annual average inflation rate during 1970-1999 was less
than 4%. The annual average real GDP growth rate during the same period
reached 4.1%. Meanwhile, its unemployment rate was between 14% and
20% during the 1990s. Furthermore, Panama’s external debt rate, defined as
the amount of external debt outstanding over GDP reached 77.1%, which
was the third highest in Latin America, after Nicaragua and Honduras
(Quispe-Agnoli 2001). Owing to its small size and geographical peculiarity, it would be difficult to generalize the case of Panama with respect to other developing countries which may consider dollarization.
B. Benefits and Costs of Dollarization
We can compare the benefits and costs of dollarization. The elimination of exchange rate changes as a result of dollarization is expected to lead to a more stable environment for foreign investment. Benefit from the lower transaction costs may promote international trade and investment because there is no need to buy and sell foreign currencies (Naranjo 2000). In addition, by adopting the dollar, higher confidence in the economy might promote investment and economic growth (Dean and Hira 2004). With dollarization, the inflation rate may remain low, assuming that the U.S.
inflation rate does the same, and low inflation may keep nominal interest rates low. Dollarization may lead to a convergence of domestic interest rates of the concerned country with those of the U.S. (Schuler 1999). Overall, in addition to keeping the inflation rate under control, dollarization may lead to lower interest rates, higher foreign direct investment(FDI) inflows, decreased transaction costs in international trade, and higher economic growth rate (Berg and Borensztein 2000; Towers and Borzutzky 2004).
Dollarization, on the other hand, is expected to impose costs on the
concerned countries as well. Similar to the weaknesses of the currency
board, dollarization loses seignorage when the domestic currency is
replaced. And, since it no longer has a domestic currency, a country cannot
conduct an independent monetary policy to moderate recessions (Salvatore,
2001). Consequently, the instability of short run business cycle may
deteriorate (Chu, et. al., 2002). That is, the concerned country may lose its
economic sovereignty as a result of dollarization. In addition, when the
situation of business cycle is different between the United States and the
concerned dollarized country, dollarization may have a negative effect on the
overall macroeconomy due to the differences in the effect of macroeconomic policies(Yang 2000, 108).
Since there theoretically exist pros and cons of dollarization, it is necessary to examine its actual consequences using the statistical data.
Examination of the experiences of Ecuador and El Salvador, which have experienced dollarization for the past several years, is expected to provide relevant information to those countries considering ‘de jure’ dollarization.
Although Jameson(2003) tried to analyze the effect of dollarization on the economy of Ecuador, his analysis was quite limited in the sense that it was able to cover the data for less than two years since dollarization.
Ⅲ. Economic Performances of Ecuador and El Salvador
A. Ecuador
The pre-dollarization period of Ecuador presents various events that culminated in aggravating the crisis the country experienced in 1999. From a border conflict with Peru in January 1995, to drought and the resignation of the Vice President who had been managing the economic policy, all these were unanticipated events in the same year and the bankruptcies of two relatively large banks in 1995 and 1996 only deepened the government’s difficulties. In 1998 the government had to deal with the El Niño rains and decrease of crude oil export prices,
1)leading to a pre‐dollarization crisis (Beckerman and Solimano 2002).
As is shown in Table 1, the deterioration in economic performance after 1997 is conspicuous, especially with respect to economic growth rate,
1) Crude oil has been the leading primary export product, sharing an average of 47.9%of Ecuador’s exports from 1980 to 1994 (source: ECLAC,
Statistical Yearbook 2005
).unemployment rate and inflation rate. Real GDP growth rate fell to - 5.7 percent in 1999. Inflation rate began to accelerate from 1997, recording 43.4% and 60.7%, respectively, in 1998 and 1999, and unemployment rate rose from 9.3% in 1997 to 11.5% and 15.1% in 1998 and 1999, respectively.
The government debt accumulated due to continuing budget deficits.
Ecuador faced continuing current account deficits, resulting in ballooning external debt. Although it recorded a current account surplus in 1999, it was due to substantially decreased imports, implying loss of long run economic growth potential. In January 2000, to stop skyrocketing inflation rates, the then President Jamil Mahuad, who was elected as the President in 1998, of the center‐right Popular Democracy Party which also took control of the National Congress announced ‘de jure’ dollarization (iExplore Ecuador 2006).
<Table 1> Macroeconomic Indicators of Ecuador, 1995-1999 (unit: %)
1995 1996 1997 1998 1999
Real GDP growth rate 2.1 3.0 5.2 2.2 ‐5.7
Export growth 10.7 1.2 5.7 ‐4.1 5.9
Import growth 7.4 ‐9.7 18.4 13.3 ‐36.4
Inflation rate
a)22.8 25.6 30.7 43.4 60.7
Unemployment rate 7.7 10.4 9.3 11.5 15.1
Budget deficit/GDP ‐0.8 ‐0.4 ‐1.2 ‐0.6 ‐0.6
Current account/GDP ‐3.6 ‐0.7 ‐3.0 ‐9.3 4.6
Source: ECLAC (2006); ILDIS (2005); IMF,
World Economic Outlook
2005 a) in consumer price indexThen the dollar became the country’s legal tender, replacing the sucre on
September 10, 2000. However, days later, this led to the downfall of
President Mahuad, and the Ecuadorian Congress confirmed Gustavo Noboa,
the elected Vice President, as the new President (Beckerman and Solimano,
2002), since the dollarization scheme did not gain political support and
consensus was not reached regarding the future of the plan.
2)Together
with the indigenous Indians, the Central Bank of Ecuador was among the
protestors strongly opposed to the adoption of the dollar. Gustavo Noboa, also being one of the right wing politicians, stuck with the dollarization plan and Ecuador became the ‘de jure’ dollarized country.
Since the adoption of the dollar as its legal currency, the real GDP growth rate has increased from 0.9% in year 2000 to 4.2% on annual average during 2001-2005, as is shown in Table 2. Real GDP growth rate after dollarization has been higher than that during 1995‐1998. A more striking, positive aspect is that dollarization dramatically brought inflation under control from 60.7% in 1999 and 91.0% in 2000 to 2.0% in 2004 and 4.4% in 2005. The inflation rate remained at a single digit during 2002-2005. Had it not been for dollarization, Ecuador might have undergone a continuing hyperinflation situation. The price stability that has been the main target of dollarization in Ecuador is well on its track. The other beneficial effect of dollarization in Ecuador can be seen in the fiscal situation. Public debt in percentage of GDP decreased substantially from 89% in 2000 to lower than 50% in 2004 and 2005. The continuing budget deficits until 2001 changed to budget surpluses in 2002, 2004 and 2005. The current account was recorded as the more or less balanced position in 2004 and 2005.
Dollarization was also introduced to lower the increasing interest rate.
The nominal lending interest rate was rising before 2000 with 15.9% in 1998
and 16.6% in 1999 as its highest peak. It decreased significantly during 2000
-2003, recording 12.6% in 2003. Such a decrease in the lending interest rate
2) Political consensus has not been easily observed in the policy and governance arena of Ecuador historically. Ecuador has been one of the countries with continuous social conflicts. The factionalism, political cannibalism and regional division have been helpless obstacles in introducing reforms in the country. In contrast to other countries in the region, it has not been possible for Ecuador to privatize state owned enterprises and to reform the pension system. Dollarization in 2000 was strongly supported by the international business sector, centered in Guayaquil coast region, in the nation while the indigenous party, the Confederation of Indigenous Nationalities of Ecuador(El Confederacion de Nacionalidades Indigenas del Ecuador (CONAIE)), led the opposition, calling for the resignation of the President (CLARIN 2000; FIE 2005).<Table 2> Macroeconomic Indicators of Ecuador, 2000-2005 (unit: %) 2000 2001 2002 2003 2004 2005
Real GDP growth rate 0.9 5.5 3.8 2.3 6.3 3.0
Export growth ‐3.2 7.8 5.4 8.5 5.8 n.a.
Import growth 5.3 2.2 0.9 ‐2.4 1.9 n.a.
Inflation rate
a)91.0 22.4 9.4 6.1 2.0 4.4
Unemployment rate 14.1 10.4 8.6 9.8 11.0 9.7
Public Debt/GDP 88.9 67.4 58.0 53.7 46.5 44.9
Budget deficit/GDP ‐0.1 ‐3.2 0.6 ‐1.2 0.1 0.9
Current account/GDP 5.3 ‐3.2 ‐4.9 ‐1.7 ‐0.5 0.8
Source: ECLAC (2006); ILDIS (2005); IMF,
World Economic Outlook 2005
a) in consumer price indeximplies a lowering of capital cost relating to investment. The increased investment as a result of decreased interest rate would have contributed to an increase in the economic growth rate.
FDI inflows have increased since the year 2000, as is shown in Table 3.
The stability achieved after dollarization appears to have attracted more FDI. For instance, although FDI inflows were as low as US$ 0.6 billion and US$ 0.7 billion in 1999 and 2000, respectively, they increased to US$ 1.3 billion in 2001 and 2002. They increased further to US$ 1.6 billion in 2003.
Likewise, FDI/GDP ratio increased from around 4‐5% during 1998‐2000 to 5.7% as of 2003, although in year 2004 it decreased a little to 4.2%.
<Table 3> Ecuador: Foreign Direct Investment Performance
1998 1999 2000 2001 2002 2003 2004 2005 Foreign Direct Investment
Inflows (U.S. $ millions)
870 648 720 1,330 1,275 1,555 1160 1913
Foreign Direct Investment Inflows/ GDP (%)
4.4 4.7 5.3 7.4 5.2 5.7 n.a. 4.2 ª
Sources : Banco Central del Ecuador(2006); UNCTAD,
World Investment Report 2006
a) estimated valueThe overall macroeconomic performance indicators since dollarization
show a recovery from the economic crisis, although this recovery cannot be fully credited to dollarization because of the increase of crude oil price in the same period. However, the substantial reduction of the inflation rate since 2000 should be attributed to dollarization. It would be necessary for the academic professionals and practitioners to keep a close watch on its effect on the economy, regardless of the changing levels of crude oil prices. As is shown in this sub-section on Ecuador, dollarization appears not to be essential with respect to stabilizing the macroeconomic situation except for controlling inflation rates.
B. El Salvador
In December 2000, the Legislative Assembly of El Salvador passed the law stipulating dollarization, which began to be implemented on January 1, 2001 under the presidency of Francisco Flores of the conservative Nationalist Republican Alliance (Alianza Republicana Nacionalista (ARENA) party. El Salvador’s economy was not in such extreme difficulties as that of Ecuador in 2000. Dollarization was sought for reasons of integration into the United States.
3)The process, therefore, has been criticized by the left‐
wing political parties
4)as being implemented by primarily political, i.e.
3) For instance, the President of the Central Bank, Rafael Barraza, stated: “We are entering this process from a position of strength. We didn’t have to dollarize, we chose to.” (Wyss, 2001).
4) The process of dollarization in El Salvador has been heavily criticized and contested by the opponent parties and non-governmental organizations (NGOs). A simple majority in the Legislative Assembly, i.e. 47 out of 84, passed the law to implement dollarization, even though a constitutional change such as this required a two-thirds vote in the subsequently seated Assembly. ARENA forced the legislation through and began dollarization in less than two months. Fundacion de Estudios Juridicos para la Aplicacion del Derecho (FESPAD), a legal NGO, the Farabundo Marti National Liberation Front (FMLN), and the United Democratic Center (CDU), the third most powerful political force in the country, have all filed court challenges to dollarization (CISPES, 2001).
rooted in imperialism, rather than economic reasons.
The macroeconomic performance of El Salvador before dollarization was remarkably stable. The annual average inflation rate had been as low as 5%
since 1992, which was one of the lowest for the region(Del Castillo 2002).
As is shown in Table 4, inflation rates remained at a single digit rate during 1996-1999. The inflation rate in 1999 was actually recorded as -1.0%.
Interest rates have been relatively low. For instance, in 2000 the nominal interest rate of El Salvador was 13.5%, which was one of the lowest among the Latin American countries. The real GDP growth rate during 1995‐1999 has been modest, i.e. between 2% and 6%. El Salvador’s unemployment rate was fairly stable at lower than 8% during 1995-1999, having been only 6.5%
in 2000. The government maintained budget surpluses during 1995-1999, although it turned into deficits in 2000.
<Table 4> Macroeconomic Indicators of El Salvador, 1995-2000 (unit: %)
1995 1996 1997 1998 1999 2000
Real GDP growth rate 6.2 1.8 4.2 3.8 3.4 2.0
Export growth 1.7 9.0 28.7 3.6 11.3 15.9
Import growth 20.6 ‐5.6 16.3 4.5 6.2 14.7
Inflation rate
a)11.4 7.4 1.9 4.2 ‐1.0 4.3
Unemployment rate 7.0 7.5 7.5 7.6 6.9 6.5
Budget deficit/GDP 1.5 1.6 3.2 2.6 0.8 ‐2.3
Current account/GDP ‐3.8 ‐1.6 0.9 ‐0.7 ‐1.9 ‐3.3
Sources: ECLAC(2005); Banco Central de Reserva de El Salvador(2006); Inter‐
American Development Bank(2006); Dresdner Bank Lateinamerika(2006).
a) in consumer price index
With an already relatively stable economy, the economic performances of
El Salvador have not improved significantly since dollarization, as is shown
in Table 5. Real GDP growth rate was held at around 2% during 2001-2005,
which was actually about 2% lower than before dollarization. In comparison
to other countries in the region, the economic growth performance of El
Salvador has been weak. The real GDP growth rate of El Salvador during
2000-2004 was lower than the average real GDP growth rate of the Latin American countries as a whole(excluding Argentina) (IMF 2005a).
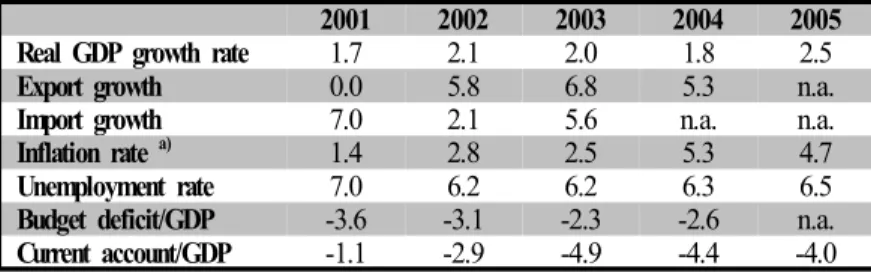
<Table 5> Macroeconomic Indicators of El Salvador, 2001-2005 (unit: %)
2001 2002 2003 2004 2005
Real GDP growth rate 1.7 2.1 2.0 1.8 2.5
Export growth 0.0 5.8 6.8 5.3 n.a.
Import growth 7.0 2.1 5.6 n.a. n.a.
Inflation rate
a)1.4 2.8 2.5 5.3 4.7
Unemployment rate 7.0 6.2 6.2 6.3 6.5
Budget deficit/GDP ‐3.6 ‐3.1 ‐2.3 ‐2.6 n.a.
Current account/GDP ‐1.1 ‐2.9 ‐4.9 ‐4.4 ‐4.0
Sources: ECLAC(2005); Banco Central de Reserva de El Salvador(2006); Inter‐
American Development Bank(2006); Dresdner Bank Lateinamerika(2006).
a) in consumer price index
Table 5 also demonstrates that, although inflation rate had decreased for a short period right after dollarization, it increased gradually to exceed the previous rates in years 2004 and 2005. Neither has the unemployment rate changed significantly, either. That is, the average unemployment rate during 2001-2005 was 6.5%, which was only slightly lower than that during 1995- 2000, i.e. 7.2%. In addition, nominal interest rates were already declining steadily before dollarization. Although interest rates tended to increase during the latter half of the 1990s, peaking in 1999, they have tended to decrease since 2000. Therefore, it would be difficult to say that the decreased interest rate was due to dollarization. External debt outstanding increased from US$21.7 billion in 1995 to US$28.3 billion in 2000 and then to US$39.9 billion in 2002 due to the continuing current account deficits.
FDI inflows have not shown significant changes after dollarization, as is
shown in Table 6. The FDI inflows/GDP ratio has increased slightly to
3.5% in 2002, while that of the following years shows a relatively lower rate
compared to the pre‐dollarized period. For instance, FDI/GDP ratio has
decreased from 1.4% in 2000 to lower than or equal to 1.0% since 2003.
Hence in El Salvador, dollarization appears not to have contributed to attracting FDI inflows significantly.
<Table 6> El Salvador: Foreign Direct Investment Inflows Performance 1998 1999 2000 2001 2002 2003 2004 2005 Foreign Direct Investment
Inflows (U.S.$ million)
1,104 216 173 279 208 142 376 518
Foreign Direct Investment Inflows/ GDP (%)
4.4 1.3 1.4 2.1 3.5 0.5 1.0 0.9
aSource: IMF,
World Economic Outlook 2005
; UNCTAD,World Investment Report 2006
a) estimated value