Geochemical Environment of Daerae Gold Mine, Sangju Area, Kyoungsangbukdo Pr ovince, Kor ea
Chul-Ho Heo and J ae-Ho Lee
*경상북도 상주지역 대래 금광산의 지구화학적 환경
허철호1)·이재호2)*
요 약
:
경상북도 상주지역 대래광산의 중열수 금 광화작용은 소백산육괴내 흑운모 호상편마암의 북서방향단층 전단대를 충진하고 있는 괴상의 단성 석영맥내에 배태하고 있다. 열수변질대 견운모에 대한 Ar-Ar 연령은 188.3±0.1로서 광화작용이 초기 쥬라기에 일어났음을 지시한다. 본광산의 석영맥내 광물조성은 단순하며, 주로 미약한 황화물과 금으로 구성되어 있다. 금은 세립자의 에렉트럼(64.8~72.1 atom.% Au)으로 산출한다. 황화광물로 는 유비철석, 황철석, 섬아연석, 자류철석, 황동석 및 백철석이 산출된다. 열화학적 연구에 의하면, 광화 1기의 초기 및 후기 광화작용에 대한 지구화학적 침전조건을 나타내는 온도 및 황분압은 각각 370°~455℃와 -5.2~-7.8 atm과 355°~ 400℃와 -5.0~-7.1 atm 이다. 유체포유물 연구에 의하면, 3개 유형의 포유물이 산출한다. 제 1형 포유 물은 탄소종이 우세하며, 제 2형 포유물은 3상이며 액상 CO2를 함유하고 있고, 제 3형 포유물은 수용성이 우세하 다. 제 1형 포유물의 고상 CO2의 용융온도 범위는 -58.2°~-58.0℃이며, CO2외에 CH4의 존재를 지시한다. 제 2형 포유물의 고상 CO2의 용융온도 범위는 -63.4°~-57.2℃이며, 제 1형 포유물에 비해 메탄 함량과 탄소상(이산화 탄소+메탄) 밀도의 변이가 다양함을 알 수 있다. 제 2형 포유물은 균질화가 이루어지기 전에 파열하며, 이는 높은 CO2 함량과 관련되어 내부압이 높아진 것으로 사료된다. 제 2형 포유물의 균질화온도는 230°~300℃로, 비교적 좁은 온도범위(265°± 30℃)를 나타내며 대래광상의 중열수 금 광화작용은 이 온도 범위에서 일어났음을 지시해 준다. 광화작용 진행중에 균질화 온도와 염농도의 관계는 유체의 불혼화작용이 250°~330℃에서 발생했음 을 지시한다. 따라서, 금 침전은 주로 유체불혼화 작용에 의하여 황화광물의 침전이 진행되면서 광화유체내 황 분압의 감소를 유도한 것으로 사료된다.
주요어
:
중열수 금, 지구화학, 광물학, 유체포유물Abstract :
Mesothermal gold mineralization of the Daerae mine was deposited in a single stages of massive quartz veins which filled the mainly NE-trending fault shear zones in the banded biotite gneiss within the Sobaegsan Massif.Hydrothermal alteration sericite yields a Ar-Ar date of 188.3±0.1 Ma. This radiometric age indicates that gold mineralization of Daerae deposit is linked temporally to the Early Jurassic, granitic magmatism related to the Daebo orogeny. The ore mineralization of veins is simple and consists mainly of rare sulfides with gold. Gold occurs as fine-grained electrum ranging from 64.8 to 72.1 atom. % Au. The sulfides occur as dominantly arsenopyrite, pyrite, sphalerite, pyrrhotite, chalcopyrite and marcasite. Thermochemical study indicates that temperature and logfS2of the early and late ore fluids for stage I mineralization are 370° to 455℃ and -5.2 to -7.8 atm, and 355° to 400℃
and -5.0 to -7.1 atm, respectively. According to the fluid inclusion data, there are three main types of fluid inclusions as follows: type I (predominatly carbonaceous), type II (three-phase, liquid CO2-bearing), and type III (dominantly aqueous). In type I inclusions, final melting temperatures of the carbonaceous phase(Tmcarb.) occurred at temperatures of -58.2° to -58.0℃, indicating the presence of CH4in addition to CO2. Tmcarb. of type II inclusions are -63.4°
to -57.2℃, indicating variations of CH4concentration and carbonaceous phase (CO2+ CH4) density compared with type I inclusions. Type II inclusions decrepitate before total homogenization, due to high internal pressures related
Vol. 42, No. 6 (2005) pp. 541-551
2005년 4월 27일 접수, 2005년 9월 16일 채택 1) 국립공원관리공단 국립공원연구원 2) 한국지질자원연구원 지질기반정보연구부
*Corresponding Author
(이재호) E-mail; [email protected]Address; Geology and Geoinformation Division, Korea Institute of Geosciences and Mineral Resources, 305-350, Korea 연구논문
ot their high CO2contents. It is noteworthy that type II inclusions have Thtotalvalues of 230° to 300℃. This relatively narrow temperature range (265°± 30℃) most likely represents the depositional conditions of gold mineralization at Daerae deposit. Coexistence of type I and II inclusions in vein quartz are thought to represent immiscible fluids generated by fluid unmixing. This fluid evolutiion implies a bulk chemical evolution toward end members in H2O-CO2(-CH4) with time and is thought to indicate progressive fluid unmixing. The relationship between Thtotal
and Tmice and/or Tmclathrate values of fluid inclusion indicates fluid unmixing over the temperature range of 250°
to 330℃. Therefore, deposition of sulfide minerals by fluid unmixing was induced to decrease fs2of ore fluids.
Key words :
Mesothermal-type gold, Geochemistry, Mineralogy, Fluid inclusionIntroduction
Most Au-Ag vein deposits in South Korea are associated intimately with major peroids of Jurassic (Daebo series) and Cretaceous (Bulgugsa series) grani- tism (Shelton et al., 1988, 1990). Three main types of Au-Ag deposits have been previously documented which display a consistent relationship between miner- alization age, depth, water to rock ratio, and Au/Ag ratio (Shelton et al., 1988, 1990): gold-rich, mesother- mal-type deposits (Jurassic); Korean-type, gold-silver deposits (Late Cretaceous); and silver-rich, epithermal- type deposits (Late Cretaceous). Among these, meso- thermal-type deposits are extremely rare in South Korea (Shelton et al., 1988; So et al., 1995; So and Yun, 1997; Heo et al., 2003), and are little known about their genesis and ore fluid characteristics.
The Daerae Au mine is located about 160 km southeast of Seoul, and lie closely with the Youngdong mining district, one of the most productive precious metal district in Korea. The Daerae mine have similar characteristics (such as vein texture, host-rock, ore mineral assemblages and Au/Ag ratio) with group-IIA gold mineralization in the Youngdong mine district thought to correspond to Jurassic mesothermal-type condition (Choi and Wee, 1992). Peak gold production in 1942 was about 10 kg gold. The average ore grade and reserves are unknown.
In this paper, we document the nature and physicochemical conditions, focusing on the origin and evolution of auriferous hydrothermal fluids responsible for the formation of mesothermal-type Au deposits at the Daerae mine.
General Geology and Ore Deposits
The Daerae mine area is located within the central
portion of the Sobaegsan Massif of South Korea, which is composed mainly of Precambrian metam- orphic rocks.
Banded biotite gneiss occupies most of the mine area and is composed of quartz, plagioclase, biotite, muscovite and chlorite. Lee(1986) suggested, from study of the southwestern region of the Sobaegsan Massif, that the metamorphic rocks were formed from shale and graywacke protoliths exposed to upper amphibolite to amphibolite facies metamorphism under 2- to 5-kbars pressure. A granitic stock intrudes metamorphic rocks at the southwestern portion of the study area. It is composed of medium grained quartz, orthoclase, plagioclase, microcline, biotite, and horn- blende. The northwest trending faults are mainly developed in the area (Fig. 1).
Gold deposits of the Daerae mine are composed of hydrothermal quartz veins which were formed by open-space filling along 30° NW trending, 80° NE- dipping fault shear zones. Veins can be traced for about 250 m along strike. Vein thickness varies considerably from 0.02 to 1.5 m (avg. 0.1 m), with repeated pinching and swelling (Fig. 1).
Ore mineralization is contained within a single stage of quartz veining which was formed by two episodes of fracturing and healing. Quartz veins are massive and commonly show ribbon structure. A later stage of barren calcite veins crosscuts quartz veins. Ore mineralogy is simple and consists of sulfides (domi- natly sphalerite and pyrite) with electrum.
Weak hydrothermal wall-rock alteration (<0.3 m wide adjacent to vein margins) is recognized by green or white bleaching of wall-rock gneiss. Alteration zones do not associate with economic gold grade.
Hydrothermal alteration sericite yields a Ar-Ar date of
188.3±0.1 Ma (Table 1). This radiometric age indicates
that Daerae gold mineralization is linked temporally to
the Early Jurassic, granitic magmatism related to the Daebo orogeny.
Vein Mineralogy and Paragenesis
Hypogene open-space filling at mine area is divided into two main paragenetic stages which are separated by a major faulting event (Fig. 2). During stage I mineralization, quartz, sulfides, and economic concen- trations of gold were deposited. Stage II is a post ore mineralization represented by barren calcite stage.
Stage I veins consist mainly of quartz with pyrite and sphalerite, minor pyrrhotite, chalcopyrite, galena, and marcasite, and electrum. Textural relationships indicate that at least two episodes of fracture opening and vein filling occurred during stage I mineralization. Stage I mineralization began with deposition of massive, white quartz containing rare amounts of disseminated, fine- grained arsenopyrite (31.1 to 32.5 atomic % As) and pyrite. In late mineralization of stage I, pale brown to brown, Fe-rich sphalerite (4.3 to 7.4 mole % FeS) and pyrite are the most abundant sulfide and occurs as sub- to anhedral masses. Most sphalerite is intensely fractured and healed by later quartz, galena, chalco- pyrite, and electrum. Pyrrhotite is also typically
Fig. 1. Geological map of the Daerae mine areas, showingthe detailed map of the mine geology. The location of the Daerae gold mine (rectangular box) is shown on the inset map of Korea.
Table 1. Ar-Ar dating of alteration sericite from the Daerae gold mine
Temperature(℃) 39Ar(×10-14) 40Ar(%) Cumulative 39Ar(%) Calculated Age(Ma±1σ)
390 165.00 1.86 2.23 156.00±1.90
460 335.00 3.89 6.77 160.70±1.90
540 195.00 2.54 9.41 178.90±2.20
610 322.00 4.42 13.77 188.50±2.21
700 360.00 4.98 18.64 189.20±2.20
780 415.00 5.64 24.26 186.40±3.20
830 545.00 7.45 31.64 187.70±2.20
890 485.00 6.61 38.21 186.90±3.20
950 290.00 39.82 77.47 188.40±2.20
1025 967.00 13.28 90.56 188.40±2.20
1100 342.00 4.69 95.19 188.10±2.20
1185 145.00 1.99 97.16 188.50±2.10
1250 120.00 1.66 98.78 189.50±2.20
1335 90.00 1.17 100.00 179.40±4.60
Total 188.30±0.10
replaced by marcasite along the fracture boundaries.
Gold occurs as fine-grained electrum (<10 to 150 μ m, avg. 20 μ m). In sulfide aggregates, gold grains frequ- ently fill fractures in sphalerite and quartz, and are intergrown intimately with galena or as isolated grains in quartz. Electrums show low Ag contents ranging from 27.9 to 35.2 atomic % Ag. Gold-rich electrum is characteristic of Jurassic gold vein deposits in central
Korea (Shelton et al., 1988; Choi and Wee, 1992).
Thermochemical Studies
Assuming that the hydrothermal fluids were at internal chemical equilibrium, and that the mineral assemblages once equilibrated with the fluids, thermo- chemical considerations using equilibrium thermodyna- mic parameters were attempted to estimate the ore- forming conditions of hydrothermal fluids.
Ranges of temperature and fugacity of sulfur (f
S2) for the base-metal and gold-silver deposition in stage I mineralization were estimated from the phase relations, and mineral compositions in the system Fe-As-S (Kretschmar and Scott, 1976), Fe-Zn-S (Barton and Toulmin, 1966), and Au-Ag-S (Barton and Toulmin, 1964). Figure 3 shows the calculated conditions of temperature and fs
2during stage I mineralization.
Early arsenopyrite-pyrite to late electrum-sphalerite mineralization during stage I will be considered separately. The sulfidation limit for substage early and late of the stage I vein is provided by compositions of the arsenopyrite, sphalerite and/or electrum in equilibrium with pyrite.
The presence of pyrite + arsenopyrite (31.1 to 32.5 atomic % As; Table 2) assemblage in the early substage restricts the lower limit of the f
S2. The upper limit of f
S2is set by the pyrite-arsenopyrite reaction, as the assemblage of pyrite+native arsenic is not observed.
Ranges of temperature and log f
S2for early minerali-
Table 2. Chemical compositions of stage I arsenopyrite from the Daerae gold mine
sample Weight % Atomic %
No. Fe S As Sb Co Ni Total Fe S As Sb Co Ni
DR2
34.40 21.89 44.21 0.06 0.01 0.10 100.67 32.57 36.10 31.20 0.03 0.01 0.09 34.65 21.20 44.90 0.00 0.00 0.00 100.75 32.98 35.16 31.86 0.00 0.00 0.00 34.24 20.53 44.42 0.00 0.00 0.00 99.19 33.20 34.68 32.11 0.00 0.00 0.00 34.15 20.99 44.59 0.00 0.03 0.02 99.78 32.84 35.16 31.96 0.00 0.03 0.02
DR1
34.41 21.17 44.02 0.00 0.09 0.03 99.72 33.02 35.39 31.49 0.00 0.08 0.03 34.41 21.47 44.74 0.00 0.14 0.08 100.84 32.66 35.49 31.65 0.00 0.13 0.07 34.45 20.74 45.58 0.02 0.00 0.00 100.79 32.95 34.55 32.49 0.01 0.00 0.00 34.91 20.96 45.91 0.00 0.00 0.10 101.88 33.01 34.53 32.37 0.00 0.00 0.09 34.90 21.74 44.06 0.00 0.00 0.12 100.82 33.01 35.82 31.06 0.00 0.00 0.11 Fig. 2. Generalized paragenetic sequence of vein
minerals from the Daerae mine.
zation of stage I are 370° to 455℃ and -5.2 to -7.8 atm, respectively (Fig. 3).
Geochemical conditions of late mineralization of stage I were determined from phase relations in the systems Ag-Au-S (Barton and Toulmin, 1964) and Fe-
Zn-S (Scott and Barnes, 1971). Silver contents of electrum (0.30 to 0.35 atomic % Ag; Table 3) in equilibrium with sphalerite (4.3 to 7.4 mole % FeS;
Table 4) constrain temperature and log f
S2to ranges of 355° to 400℃ and -5.0 to -7.1 atm, respectively.
Fluid Inclusions
Twenty vein quartz samples in stage I from the Daerae Au mine were investigated by fluid inclusion microthermometry. No suitable inclusions were found in sphalerite and calcite because they contain only minute (4 μ m) inclusions. Microthermometric data were obtained on a Fluid Inc. gas-flow-type, heating-freezing stage calibrated with synthetic H
2O and CO
2inclusi- ons and various organic solvents. Heating rates were maintained near 3℃/min for measurements of total homogenization temperatures (Th
total). Unfortunately, many inclusions decrepitated upon heating; decrepi- tation temperatures were recorded and represent mini- mum Th. During freezing experiments, a sequential freezing technique (Haynes, 1985) was employed. Th
totalvalue and homogenization temperatures (Th
carb) of the carbonaceous phase (CO
2+CH
4) have standard errors of
±1.0℃, whereas melting temperatures of carbonaceous phase (Tm
carb), ice (Tm
ice), and clathrate (Tm
clathrate)
Fig. 3. fs2 versus temperature diagram showingsulfidaion reactions relevant to the Daerae mine(Barton and Toulmin, 1964 an 1966; Kretschmar and Scott, 1976).
Table 3. Chemical compositions of stage I electrum from the Daerae gold mine
Stage Sample
No.
Weight % Atomic %
Au Ag Total Au Ag
I(E)
DR1 81.94 18.26 100.20 71.08 28.92
83.06 17.76 100.82 71.92 28.08
DR2
82.52 16.27 98.79 73.53 26.47
82.50 18.07 100.57 71.43 28.57
82.80 17.54 100.34 72.12 27.88
80.41 17.95 98.36 71.05 28.95
82.12 17.86 99.98 71.58 28.42
80.83 18.70 99.53 70.31 29.62
I(L)
DR5-2 81.05 20.52 101.57 68.39 31.61
DR8
76.31 22.45 98.76 65.06 34.94
76.18 22.67 98.85 64.79 35.21
76.70 22.77 99.47 64.85 35.15
76.99 22.39 99.38 65.31 34.69
have errors of ±0.2℃.
Occurrence and compositional types of fluid inclusions Massive quartz samples are inclusion rich, probably due to repeated fracturing and healing. Three main
types of fluid inclusions, ranging in size <4 to >30 μ m (avg. 10 μ m), were identified on the basis of phase relations during cooling and slight heating (up to 20℃).
These are type I (predominatly carbonaceous), type II (three-phase, liquid CO
2-bearing), and type III (domi-
Table 4. Chemical compositions of stage I sphalerite from the Daerae gold mineStage Sample No
Weight % Atomic %
Zn Fe Mn Cd Cu S Total Zn Fe Mn Cd Cu S
I(E)
DR2
55.85 9.82 0.00 1.28 0.18 33.54 100.67 40.86 8.41 0.00 0.54 0.14 50.04 56.35 9.84 0.01 1.89 0.21 33.41 101.71 41.03 8.39 0.01 0.80 0.16 49.61 56.16 9.00 0.00 1.41 0.14 33.71 100.42 41.17 7.72 0.00 0.60 0.11 50.40 55.46 9.46 0.00 0.87 0.00 32.98 98.77 41.30 8.25 0.00 0.38 0.00 50.08 55.76 9.16 0.03 1.07 0.00 33.08 99.10 41.43 7.97 0.03 0.46 0.00 50.12 55.71 9.30 0.02 0.87 0.20 32.76 98.86 41.53 8.12 0.02 0.38 0.15 49.80 56.52 9.58 0.00 1.30 0.15 33.36 100.91 41.35 8.21 0.00 0.55 0.11 49.78 56.48 9.35 0.05 1.10 0.14 33.22 100.34 41.53 8.05 0.04 0.47 0.11 49.81 57.57 8.50 0.00 1.03 0.09 32.98 100.17 42.50 7.35 0.00 0.44 0.07 49.65 55.20 9.57 0.02 1.15 0.26 33.07 99.27 40.95 8.31 0.02 0.50 0.20 50.03 55.13 9.39 0.00 1.39 0.11 32.63 98.65 41.27 8.23 0.00 0.61 0.08 49.81 55.34 9.99 0.08 1.29 0.19 32.76 99.65 41.03 8.67 0.07 0.56 0.14 49.53 56.30 9.14 0.00 1.13 0.07 33.13 99.77 41.61 7.91 0.00 0.49 0.05 49.94 56.93 8.42 0.05 0.96 0.13 33.18 99.67 42.11 7.29 0.04 0.41 0.10 50.05 56.78 7.95 0.09 1.36 0.00 32.69 98.87 42.48 6.96 0.08 0.59 0.00 49.88 55.04 9.20 0.02 1.47 0.01 32.58 98.32 41.34 8.09 0.02 0.64 0.01 49.90
DR1
56.64 8.83 0.00 0.98 1.15 33.32 100.92 41.44 7.56 0.00 0.42 0.87 49.71 56.41 8.85 0.01 1.28 1.03 32.84 100.42 41.61 7.64 0.01 0.55 0.78 49.40 57.65 8.53 0.00 1.31 1.19 32.88 101.56 42.18 7.31 0.00 0.56 0.90 49.06 56.17 8.75 0.01 1.26 0.17 32.30 98.66 42.17 7.69 0.01 0.55 0.13 49.45 57.21 8.58 0.00 0.98 0.19 33.59 100.55 41.91 7.36 0.00 0.42 0.14 50.18 55.94 9.23 0.02 1.31 0.00 32.61 99.11 41.74 8.06 0.02 0.57 0.00 49.62 56.43 8.91 0.01 1.18 0.16 32.88 99.57 41.87 7.74 0.01 0.51 0.12 49.75 56.29 9.14 0.05 1.24 0.00 33.00 99.72 41.68 7.92 0.04 0.53 0.00 49.82 55.28 9.90 0.00 1.06 0.00 33.23 99.47 40.87 8.57 0.00 0.46 0.00 50.10 56.15 9.73 0.00 1.20 0.17 33.36 100.61 41.15 8.35 0.00 0.51 0.13 49.86
DR-1
56.43 9.34 0.00 1.05 0.01 32.82 99.65 41.83 8.10 0.00 0.45 0.01 49.61 56.15 9.31 0.04 1.14 0.13 33.30 100.07 41.35 8.03 0.04 0.49 0.10 50.01 57.68 8.16 0.00 1.34 0.15 33.30 100.63 42.39 7.02 0.00 0.57 0.11 49.91
I(L) DR-4 57.14 6.28 0.13 1.53 2.94 33.12 101.14 41.98 5.40 0.11 0.65 2.22 49.63 59.64 4.93 0.08 1.45 0.12 32.84 99.06 44.69 4.32 0.07 0.63 0.09 50.19 DR-5-2 57.73 8.39 0.00 1.24 0.02 32.94 100.32 42.62 7.25 0.00 0.53 0.02 49.59
nantly aqueous). The order of drecreasing abundance is type II > type III >> type I.
Type II inclusions were further classified into two sub-types based on their carbonaceous phase volumes and modes of total homogenization: type IIa (car- bonaceous phase volumes >55%, homogenizes totally to the carbonaceous phase) and type IIb (carbonaceous phase of 25-45 vol %, homogenizes to the aqueous phase or homogenizes critically or near critically).
Type III inclusions are composed of two subtypes (IIIa and IIIb). Type IIIa inclusions contain a gas bubble of 10 to 40 vol percent and frequently nucleate a clathrate during freezing, indicating the presence of minor CO
2(<0.85 molal CO
2; Hedenquist and Henley, 1985). Type IIIb inclusions are very irregular in shape and contain a vapor bubble of <10 percent.
Repeated fracturing and healing, both during and after quartz deposition, make it difficult to relate fluid inclusions within examined quartz to any primary growth pattern. However, in some cases, it was possible to establish a relative chronology of inclu- sions, using the criteria of Roedder (1984).
Type I inclusions are found in isolate, randomly distributed occurrences. They are typically dark and show negative or rounded crystal forms. Most type II inclusions are isolated with no planar array and are typically regular in shape, suggesting a primary origin.
Type IIIa inclusions show a variety of forms ranging from irregular to rounded of negative crystal shapes.
All type IIIb inclusions show large variations in size and shape, and occur in planes which cut other inclusion types. Therefore, type IIa and IIb inclusions, which show no fracture control, and considered to reflect earlier fluid, whereas type IIIb inclusions, which occur in intergrain fractures, appear to be later.
Fracture-controlled type IIIb inclusions are considered to be secondary origin.
Heating and freezing data
About 150 fluid inclusions in quartz were examined.
However, due to their small size and decrepitation on heating only about one-third of the inclusions yielded both freezing and homogenization data. Freezing experiments were performed before heating runs.
Salinities were estimated based on clathrate-melting
temperatures (Tm
clathrate) for CO
2-bearing inclusions and on freezing point depression (Tm
ice) in the system H
2O-NaCl (Potter et al., 1978) for dominantly aqueous inclusions.
Type I inclusions: Cooling to about -90℃ nucleated a gas bubble prior to eventual freezing of the inclusion fluid. In type I inclusions, temperatures of final melting of the carbonaceous phase (Tm
carb) range from -58.2° to -58.0℃ (Fig. 4), indicating the presence of CH
4in addition to CO
2. Homogenization of the carbonaceous phase to a liquid (Th
carb) occurred between 9.1° and 9.3
℃ (Fig. 5).
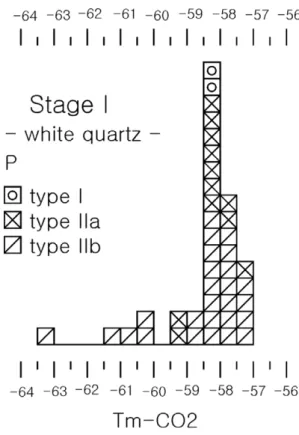
Type II inclusions: Tm
carbvalues of type II inclusions are type IIa, -59.3° to -57.2℃; type IIb, -63.4° to -57.2
℃ (Fig. 4). The ranges of Th
carbvalues, all to the liquid phase, are type IIa, 9.7° to 25.5℃; type IIb, 14.5° to 28.7℃(Fig. 5). Tm
carband Th
carbvalues are variable within a given sample, indicating variations of CH
4Fig. 4. Frequency histogram of the last melting temperature of carbonic phase in liquid CO2-bearing fluid inclusions in stage I quartz from the Daerae gold mine.
P = primary inclusion.
concentration and carbonaceous phase (CO
2+ CH
4) density. Ranges of Tm
clathratevlaues are type IIa, 7.3° to 9.4℃; type IIb, 4.3° to 10.1℃. Type II inclusions generally decrepitate before total homogenization, due to high internal pressures related to their high CO
2contents (Burruss, 1981). When decrepitation occurred, the decrepitation temperature was used as a minimum estimate of Th
total. Ranges of Th
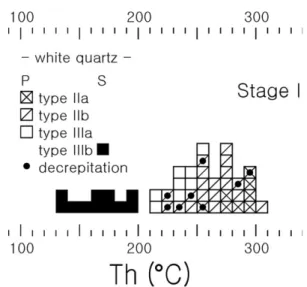
totalvalues are type IIa, to the carbonaceous phase, 230° to 294℃; type IIb, to the aqueous phase, 220° to 300℃ (Fig. 6).
Type III inclusions: Tm
icevalues are type IIIb -5.0°
to -1.4℃. Clathrate formation was observed within some type IIIa inclusions, and Tm
clathratevalues range from 5.1° to 9.5℃. Th
totalvalues of thpe III inclusion (to the liquid) are type IIIa, 210° to 259℃; and type IIIb, 137° to 196℃ (Fig. 6).
It is noteworthy that type IIa inclusions have Th
totalvalues between 230° to 300℃. This relatively narrow temperature range (265°± 30℃) most likely represents depositional conditions of mesothermal gold minerali- zation at Daerae. Based on fluid inclusions, sulfur isotope compositions, and equilibrium thermodynamic interpretation of mineral assemblages, So and Yun (1997) determined a similar temperature range (240°- 330℃) for gold deposition at the Samhwanghak mine, example of mesothermal-type gold vein deposits in the Youngdong area.
Estimation of fluid compositions
Most CO
2-bearing, type I and II inclusions have Tm
carbvalues below -57℃, which are interpreted to indicate the
presence of other species such as CH
4(Burruss, 1981).
Tm
carbvalues of <-60℃ for type II inclusion indicate
>10 mole percent CH
4in the liquid carbonaceous phase carbonaceous phase, because CH
4is strongly partitioned into the vapor phase (Hollister, 1981). Estimated salinities (wt % NaCl equiv) are type IIa, 1.4 to 5.2, type IIb, 3.0 to 10.3. Salinities of type III inclusion are estimated to vary between 1.8 and 9.5 wt percent NaCl equiv (type IIIa, 5.1 to 9.5; type IIIb, 1.8 to 7.9) by interpreting Tm
clathrateand Tm
icevalues, respectively (Fig.
7), using data for the system H
2O- CO
2-NaCl (Collins, 1979) and H
2O-NaCl (Potter et al., 1978).
Fluid immiscibility
Type I and II inclusions in vein quartz are thought to represent immiscible fluids generated by fluid unmixing because (1) type II inclusions commonly contain highly variable CO
2+CH
4contents within individual samples; (2) for type IIa and IIb inclusions, the Th
totalvalues of CO
2-CH
4-rich (type IIa) and H
2O-rich (type IIb) inclusions are in the same range (≈ 250° to 300℃, Fig. 8); and (3) the estimated salt contents increase in more H
2O-rich inclusions (a high-salinity, H
2O-rich fluid as in type IIb inclusions is produced by unmixing of a relatively low-salinity,
Fig. 5. Frequency histogram of homogenizationtemperature of carbonic phase in liquid CO2-bearing fluid inclusions in stage I quartz from the Daerae gold mine.
P = primary inclusion.
Fig. 6. Frequency histogram of total homogenization temperatures of fluid inclusions in stage I quartz from the Daerae gold mine. P = primary inclusion. S = secondary inclusion.
CO
2-H
2O fluid, because salt will preferentially partition into the H
2O-rich liquid rather than into the CO
2-rich vapor (Bowers and Helgeson, 1983).
For each inclusion type, the overall fluid inclusion chronology proposed from the modes of occurrence, pregressive decrease in fluid temperature, and con- comitant increases in salinity indicate a fluid evolution in the order; types IIa and IIb → types IIIa and I → type IIIb. This fluid evolutiion implies a bulk chemical evolution toward end members in H
2O-CO
2(-CH
4) with time and is thought to indicate pregressive fluid unmixing (CO
2-CH
4effervescence).
The relationship between Th
totaland Tm
iceand/or Tm
clathratevalues (Fig. 8) indicates fluid unmixing over the temperature range of 250° to 330℃. As shown in the inset of Figure 8, type IIb and some high- temperature type IIIa inclusions show a trend of increasing salinity (up to ≈ 10 wt % NaCl equiv) with decreasing temperature, whereas all type IIa inclusions define a trend of low, but nearly constant salinity. Such a salinity pattern could have been produced by progressive fluid unmixing. Type IIIb inclusions, are thought to represent remnants of early fluids which evolved through fluid unmixing.
Some type IIb inclusion which have a constant phase ratio (≈ 45% CO
2-H
2O) and homogenize critically or near critically are thought to represent the initial homogeneous fluid from which the other types of inclusion fluids with variable composition were derived by unmixing.
Most type IIIb inclusions appear to be secondary and display a trend of decreasing salinity (from ≈ 8-2 wt
% NaCl) with decreasing temperature (Fig. 8). This indicate later cooling and dilution of ore fluids, probably due to mixing with deeply circulating meteo- ric waters. If true, the majority of aqueous type IIIb inclusions may be unrelated to the early fluid unmixing of the aurifrous hydrothermal system.
Conclusions
1. Mesothermal gold mineralization of the Daerae mine was deposited in a single stage of massive quartz veins which filled the mainly NE-trending fault shear zones in the banded biotite gneiss within the Sobaegsan Massif.
2. Hydrothermal alteration sericite yields a Ar-Ar age date of 188.3±0.1 Ma indicating that mesothermal gold vein mineralization at Daerae is linked temporally to the Early Jurassic, granitic magmatism related to the Daebo orogeny.
3. The mineralogy of the mesothermal-type vein is simple and consists mainly of rare sulfides with economic quantity of electrum ranging from 64.8 to 72.1 atom. % Au. The dominant sulfides are arsenopyrite, pyrite, sphalerite, pyrrhotite, chalcopyrite and marcasite.
4. Thermochemical studies may indicate that the ranges of temperature and sulfur fugacity (logf
S2)
Fig. 7. Frequency histogram of salinities of fluid inclusionsin stage I quartz from the Daerae gold mine.
Fig. 8. Salinity versus homogenization temperature diagram for fluid inclusions in stage I quartz from the Daerae gold mine.
showing the geochemical conditions for the early and late mineralization of stage I are 370° to 455℃ and -5.2 to -7.8 atm, and 355° to 400℃ and -5.0 to -7.1 atm, respectively.
5. In type I (predominantly carbonaceous) inclusions, final melting of the carbonaceous phase (Tm
carb) occu- rred at temperatures of -58.2° to -58.0℃, indicating the presence of CH
4in addition to CO
2. Tm
carb. of type II (three-phase, liquid CO
2-bearing) inclusions are -63.4°
to -57.2℃, indicating variations of CH
4concentration and carbonaceous phase (CO
2+ CH
4) density compared with type I inclusions.
6. Type II inclusions decrepitate before total homo- genization, due to high internal pressures related ot their high CO
2contents. It is noteworthy that type II inclusions have Th
totalvalues between 230° to 300℃.
This relatively narrow temperature range (265° ± 30℃) most likely represents the depositional conditions of mesothermal gold mineralization at Daerae.
7. Coexistence of type I and II inclusions in vein quartz are thought to represent immiscible fluids generated by fluid unmixing because (1) type II inclusions commonly contain highly variable CO
2+ CH
4contents within individual samples; (2) for type IIa and IIb inclusions, the Th
totalvalues of CO
2-CH
4-rich (type IIa) and H
2O-rich (type IIb) inclusions are in the same range (≈ 250° to 300℃); and (3) the estimated salt contents increase in more H
2O-rich inclusions.
8. Fluid evolutiion implies a bulk chemical evolution toward end members in H
2O-CO
2(-CH
4) with time and indicate progressive ore fluid unmixing. The relation- ship between Th
totaland Tm
iceand/or Tm
clathratevalues indicates fluid unmixing over the temperature range of 250° to 330℃.
References
Barton, P. B. Jr. and Toulmin, P. III., 1964, “The electrum tarnish method for the determination of the fugacity of sulfur I laboratory sulfide system”,
Geochimica et Cos- mochimica Acta
, Vol. 28, pp. 619-640.Barton, P. B. Jr. and Toulmin, P. III., 1966, “Phasr relations involving sphalerite in the Fe-Zn-S system”,
Economic Geology
, Vol. 61, pp. 815-849.Bowers, T. S. and Helgeson, H. C., 1983, “Calculation of the thermodynamic and geochemical consequenes of nonideal mixing in the system H2O-CO2-NaCl on phase
relations in geologic systems: Metamorphic equilibria at high pressures and temperatures”,
American Mineralo- gists
, Vol. 68, pp. 1059-1075.Burruss, R. C. 1981, “Analysis of fluid inclusions: Phase euilibria at constant volume”,
American Journal of Scie- nce
, Vol. 281, pp. 1104-1126.Choi, S.G., Wee, S.M., 1992, “The genetic characteristics of gold and/or silver deposits related to chemical composition of electrum in central Korea”.
Journal of Geological Society of Korea
Vol. 28, pp. 196-217.Collins, P.L.F., 1979, “Gas hydrates in CO2-bearing fluid inclusions and the use of freezing data for estimation of salinity”. Economic Geology, Vol. 74, pp. 1435-1444.
Haynes, F.M., 1985, “Determination of fluid inclusion compositions by sequential freezing”.
Economic Geolo- gy.
, Vol., 80, pp. 1436-1439.Hedenquist, J.W., Henley, R.W., 1985, “The importance of CO2on freezing point measurements of fluid inclusions:
Evidence from active geothermal systems and impli- cations for epithermal ore deposition”.
Economic Geoo- gyl.
, Vol. 80, pp. 1379-1406.Heo, C. H., Yun, S. T. and So, C. S., 2003, “Sulfur isotope characteristics of mesothermal-type gold deposits in the Boseong-Jangheung area, Korea”,
Neues Jahrbuch für Mineralogie Abhandlungen
, Vol. 178, pp. 107-129.Hollister, L.S., 1981, “Information intrinsically available from fluid inclusions”.
Mineralogical Association of Canadian, Short Course Handbook
, Vol. 6, pp. 1-12.Kretschmar, U. and Scott, S. D., 1976, “Phase relations involving arsenopyrite I the Fe-As-S and their appli- cation”,
Canadian Mineralogists
, Vol. 14, pp. 364-386.Lee, S. W., 1986, “Metamorphism of the gneiss complex in the southwestern region of the Sobaegsan Massif”,
In Memoirs in celebration of the sixtiethirthday of Professor Sang Man Lee
,Seoul National Univesity
,Seoul
, pp.1131-1140.
Potter, R.W., Clynne, M.A., Brown, K.L., 1978, “Freezing point depression of aqueous sodium chloride solutions”.
Economic Geology
., Vol. 73, pp. 284-285.Roedder, E., 1984, “Interpretation and utilization of inclu- sion measurements: temperature, pressure and density at trapping”.
In: Roedder E (eds.) Fluid inclusions. Reviews in Mineralogy
Vol. 12 pp. 252-289.Scott, S. D. and Barnes, H. L., 1971, “Spalerite geother- mometry and geobarometry”,
Economic Geology
, Vol.66, pp. 653-669.
Shelton, K. L., So, C. S. and Chang, J. S., 1988, “Gold-rich mesothermal vein deposits of the Republic of Korea:
Geochemical studies of the Jungwon gold area”,
Eo- nomic Geology
, Vol. 83, pp. 1221-1237.Shelton, K.L., So, C.S., Haeussler, G.T., Lee, K.Y., Chi, S.J., 1990, “Geochemical studies of the Tongyoung
gold-silver deposits, Republic of Korea: Evidence of meteoric water dominance in a Te-bearing epithermal system”.
Economic Geoogyl
., Vol. 85, pp. 1114-1132.So, C.S., Yun, S.T., Shelton, K.L., 1995, “Mesothermal gold vein mineralization of the Samdong mine, Young- dong mining district, Republic of Korea”.
Mineralium
Deposita
, Vol. 30, pp. 384-396.So, C.S., Yun, S.T., 1997, “Jurassic mesothermal gold mineralization of the Samhwanghak mine, Republic of Korea: Geochemistry of magmatic hydrothermal gold deposits”.
Economic geology
, Vol. 92, pp. 60-80.허 철 호 이 재 호
현재 한국지질자원연구원 지질기반정보연구부 선임연구원 (本 學會誌 第42卷 第5号 參照)
현재 국립공원관리공단 국립공원연구원 책임연구원 (本 學會誌 第42卷 第5号 參照)