A Study on Comparison of Road Surface Images to Provide Information on Specific Road Conditions
1)Eun-Gyeom Jang*
도로 상태 정보 안내를 위한 도로표면 영상 비교에 관한 연구
장 은 겸*
Abstract
On rainy days, water films form on wet road surfaces and reduce the braking force of vehicles, which often ends up in accidents. For safe driving, the road information signage provides information on road and weather conditions warning drivers of wet road conditions. Still, current information on road conditions is neither localized nor detailed but universal. The present study used the images on CCTVs installed on roads to compare the images of road surfaces in an attempt to suggest a mechanism determining factors that hamper safe driving based on the images. In the image comparison, a normal road image taken on a sunny day is used as an original image, against which road conditions occurring on rainy days are categorized and determined on a case-by-case basis to provide drivers with early warning for the sake of safe driving.
▸Keyword : Image Comparison, Road Information, Road Condition, Road Image
요 약
우천시 도로에 내린 비로 인해 도로 표면에 수막현상이 일어나서 맑은 날의 도로 보다 제동력이 떨어져 빗길 사 고가 빈번하게 발생한다. 이러한 빗길의 주의정보를 포함한 안전운전을 위해 운전자에게 도로 상황 안내판에 도로 의 상황 및 기후정보를 제공하고 있다. 그러나 이러한 안내 정보는 국부적이고 세부적인 도로상태 정보를 제공하지 못하고 범용적이다. 이에 본 논문에서는 도로에 설치되어 있는 CCVT의 영상을 활용하여 도로 표면의 영상을 비교 하여 안전운전을 저해하는 요소를 영상으로 판별하는 메커니즘을 제안한다. 영상 비교는 평상시 맑은 날의 도로 영 상을 원본 영상으로 활용하여 우천시 발생하는 도로의 상태를 상황별로 나누어 판별하여 조기에 운전자에게 주의
∙제1저자 : 장은겸
∙투고일 : 2011. 11. 03, 심사일 : 2011. 11. 30, 게재확정일 : 2011. 12. 08.
* 대전대학교 컴퓨터공학과(Dept. of Computer Science, Daejeon University)
정보를 제공하여 안전운전을 할 수 있도록 하였다.
▸Keyword : 영상비교, 도로정보, 도로상태, 도로영상
I. Introduction
On rainy days, drivers have trouble with low visibility and the remaining water films on road surfaces cause hydroplaning, leading vehicles to skid, ending up in accidents. Water films and hydroplaning on wet roads double the normal braking distance and increase fatalities. Above all, about 10-mm water films forming between the tires and road surfaces increase traffic accidents by more than 50% on rainy days. Due to the water films on wet roads, the breaking distance grows up to 1.5~2 times or more compared to 12m when driving at 60km/h on normal days. Considering a 30-cm difference in the braking distance brings a fatal consequence in a car crash, the accidents on wet roads are very fatal. In particular, on S-shaped road sections or on more than 45˚ curves, 40km/h proves a normal and safe speed, whereas when the road surface is wet, even 35km/h may result in a road departure[1].
For safe driving on wet roads, the tire pressure needs raising by up to 10%, and worn tires need replacing beforehand as they lower the breaking force on wet roads. More than anything else, speed reduction while driving is most important.
Currently, the road condition signage informs and warns drivers of road and weather conditions.
However, the unspecified warnings and information the current system provides are likely to differ from real road conditions.
Hence, the present study investigates an image comparison technology that determines road conditions in real time, detects road status including water films or freezing caused by rain or snow and analyzes road images to provide appropriate warnings and alarms.
II. Analysis of image comparison technology
1. Overview of image comparison technology Image comparison technology is largely divided into compressed and non-compressed modes. The compressed mode relies mostly on DCT coefficients, using only the data restored from the compressed areas, and motion vectors. However, this approach uses partial data only for image comparison, so the reliability of detection is compromised due to data loss. The non-compressed approach compares histograms or pixels across the entire area. The histogram-based comparison is most widely in use[2].
Images are compared and detected in light of threshold values and different values in frames, so setting a threshold value is most important to extract similarities from compared images. However, threshold values set as such cannot actively deal with difference values varying upon sudden appearance of objects or distortion of frames.
Notably, flash lights form high difference values resulting from abrupt changes in gray values, which makes it very hard to detect images by setting threshold values[3].
2. Pixel- or histogram-wise comparison
Pixel-wise comparison takes advantage of little change of pixel values in a same shot. In the formula 1, Fi(x,y) is the ith frame’s pixel values (x,y). Here, 1 means that the difference in the values of corresponding pixels in contiguous frames exceeds the threshold value t.
i f
(1)
In the formula 2, when the percentage of pixels of 1 out of the entire pixels goes beyond a certain threshold value, Tp, it is considered a cut. X and Y represent maximum height and width of the image.
(2)
The pixel-based comparison leads to errors depending on movements of cameras and objects.
Likewise, camera movements such as Fade and Zoom In/Out as well as moving objects are associated with quite a lot of changes in pixels, resulting in incorrect detection results[4].
Histogram-wise comparison is the most universal detection method, capitalizing on the attribute that frames in a same shot share a similar color distribution. As in the formula 3, neighboring frames in a video image are calculated in terms of differences in histograms and the results are compared with the given threshold value, Th to detect similarities between images. Here, i is the frame number, and j represents the color value on the histogram. H is the frequency of the given color value.
(3)
The histogram-based comparison is more accurate in detection results than the pixel-wise approach as the entire histogram does not much change even when objects move fast. Still, the histogram comparison is prone to errors due to brightness intensity variation. That is, sudden changes in lighting, flashes or similar backgrounds or atmospheres may lead to incorrect detection of scene transition[5].
3. Entropy-wise comparison
The formula 4 represents likelihood-based entropy of complexity in image information. Using the entropy, the complexity of an image is measurable.
log (4)
Here, aj is the number of the jth pixel value, while P(aj) is the likelihood of aj.
In a video image, the difference of entropies between two contiguous frames is measured to determine the difference between them. A sudden change in lighting leads to a big difference in color distribution in the histogram. However, despite changes in objects, backgrounds or brightness of an image, neither its complexity nor entropy value changes significantly. Therefore, difference in entropies between two contiguous frames can be used to prevent incorrect detection resulting from changes in lighting.
The formula 5 represents the difference in entropies between two contiguous frames. The formula 6 represents, when the difference in color histogram is Dh, the total difference combining the entropy difference, De from the formula 5. This indicates that difference between two frames is the addition of the differences of color histograms and entropies.
(5)
(6)
(7)
Here, is a weight. When the difference between two frames exceeds a certain threshold value, as in the formula 7, they are considered to have no similarities. The entropy-based method does not result in incorrect detection results when lighting changes abruptly[6].
4. Comparison using edge images in compressed areas
As in the formula 8, 5 AC coefficients equivalent to low frequencies are used to calculate the low-frequency edge intensity, PL, which is then compared with the threshold value, so that the edge blocks and images are found. As in the formula 9, similarities are detected by comparing the horizontal and vertical edge histograms ′ and′ in the reference frame with motions compensated with the horizontal and vertical edge histograms, and in the current frame.
(8)
n.
′
′
(9)
and and
dim
and and
Compared to AC coefficients, image restoration using DCT coefficients proves more accurate, resulting in better detection results[7].
III. Proposed image comparison technology
For the image comparison, the road image on a sunny day is used as a normal image, while the target images to be compared with the normal one are taken with image input devices like CCTVs.
From the target image frames, DC images are extracted and similarities between frames are calculated.
Using the differences in pixel values and histograms between extracted DC images, FFD(Frame-to-Frame Difference), representing the
degree of differences between frames, is calculated.
By moving the sliding window over the FFD value, when the difference between the maximum and the 2nd maximum values within the window is bigger than the threshold value, two frames are considered different. The DC image requires much less calculation than the entire frame decoding used to get a real image.
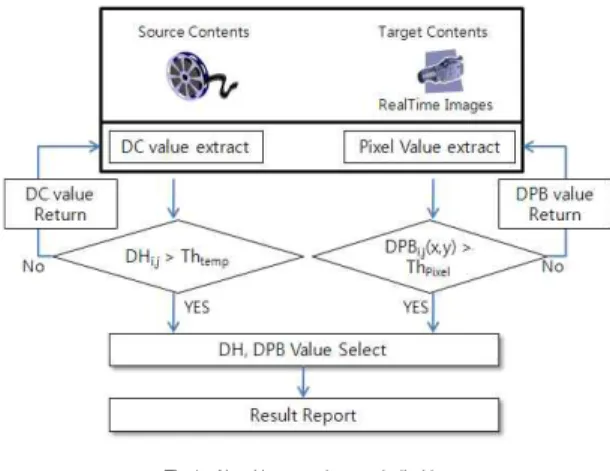
Fig. 1 is the algorithm for the image frame comparison. The original key frame is a normal road image, and the target key frame represents a CCTV image.
Fig.1. Algorithm to detect similarities
By extracting the target key frames for comparison, each frame’s luminance and DC value are derived, and the absolute values of the differences in histograms (DH) are summed. If the DH value is bigger than the threshold value(Th), the image is considered to have changed. If DH ≤ Th, the frames are considered similar.
If DH is larger than the threshold value(Thtemp), the absolute values of the differences in luminance values of the pixels in the frames are summed(DPB). If DPB is larger than the threshold value(Thpixel), the frames are considered similar, and the extracted DH and DPB values are returned. If DPB ≤ Thpixel, the image is considered to have changed.
The image frame comparison uses two techniques.
One is to detect differences between pixel values, and the other is to use the similarities in color distribution. Two algorithms are used for the key frame comparison because the technique using the differences between pixel values is sensitive to object motions or frame noises, and the other approach using luminance and DC values of color blocks is inefficient for images under varying lights.
1. A technique using luminance and DC values of color blocks
The first technique for frame comparison follows the formula 10, where luminance and DC values of color blocks in frames are used.
(10) K: Luminance or the total number of color levels Hi(k): The function of the histogram that has a luminance value, k, in theith frame.
|Hi(k)–Tj(k)|: The absolute value of the histogram that has a luminance value, k, between the original I frame and the target jth frame.
DHi,j(k): The sum of the absolute values of differences between histograms that represent similarities between the original i frame and the target j frame.
Thtemp: The threshold value of similarities
If DHi,j(k) is found smaller than the threshold value, the frames are considered similar. If DHi,j(k) is larger than the threshold value, the frames are regarded to have no similarities.
When DHi,j(k) is larger than the threshold value in a frame, it is applied with the 2nd algorithm to detect similarities between frames. The first detection algorithm is inefficient for color brightness, so the 2nd algorithm is applied to make up for the shortcomings of the 1st algorithm. When DHi,j(k) is smaller than the threshold values, two frames are determined to be similar, and the road condition is considered normal.
2. A technique using differences between pixels The second technique for image comparison is applied when the first technique results in a DHi,j(k) value exceeding the threshold value. In the 2nd technique using differences between pixels, when the sum of the absolute values of the difference between pixel values in two frames located in the same place exceeds a certain threshold value, the image is considered to have changed. That is, the road image has changed. The difference between pixel values is calculated as in the formula 11.
(11) M: Number of vertical pixels
N: Number of horizontal pixels
Pi,j(x,y): The luminance value of the pixel on the point (x,y) in i frame
: The absolute value of the difference in luminance values between pixels on the points(x,y) in i and j frames
DPBi,j(x,y): The sum of the absolute values of the difference in luminance values, representing the similarities between i and j frames
Thpixel: The threshold value of similarities
In similar frames, the difference value between pixels is very small. However, when frames have no similarities, there is a big difference between pixels.
When the threshold value is smaller than DPBi,j(x,y), two frames are determined not to be similar, and DH and DPB values are returned.
Then, a warning or an alarm is determined. Also, when the threshold value is larger than Thpixel, the 1st and the 2nd techniques to detect similarities between frames are applied to determine whether the road condition is normal.
The first and the second algorithms to detect similar frames depend on the threshold values.
Higher threshold values increase accuracy, but may not be capable of extracting a risk, when one is
present, whereas lower threshold values lead to high sensitivity even to small changes in road conditions and require unnecessary cautions of drivers.
Therefore, it is important to find the optimal threshold values by assessing the performance of algorithms.
IV. Analysis and assessment of the proposed mechanism
1. Road image comparison mechanism 1.1 Extracting key frames from CCTV images
A key frame representing a real-time CCTV image is extracted. The key frame extracted goes through sampling to convert its RGB scheme to Y-Cb-Cr.
The converted Y-Cb-Cr color scheme is coded by DPCM using the predictable information from the previous and the following frames. The coded data arrangement is converted into the sum of the cosine function. The converted data arrangement is compressed by Huffman coding to extract the key frame.
To find the coefficient and the sum of the cosine function of the data arrangement, follow the formulae 12 and 13. Here, f is the data arrangement, and F is the DCT coefficient.
cos
(12)
≠
cos
(13)
The original data (f) can be found using the DCT coefficient. N data, f, need be converted into DCT to get N DCT coefficients, F.
1.2 Image comparison mechanism
To compare road image frames, luminance and
color difference block values as well as pixel values are used. The formula 14 is to detect similarities using luminance. As for the value of the histogram for the level thekth frame, G, which is the number of bins in the h(k,l) histogram, is not 256 which is equivalent to the pixel value but 64 bins, resulting from grouping a few levels to reduce the effects of noises in the image.
(14) Where, h(k,l): The histogram for the level l in the kth frame.
The formula 15 uses a mean(mk) and a variance(vk) based on differences between pixel values or between DC coefficient values. As in the formula 16, the frame is divided into a few areas to find the likelihood. Then, the threshold values are compared to apply comparison techniques across the entire frame. For the proposed method, setting the threshold value is very important. Diverse trial settings need building to find applicable threshold values.
i f
×
(15)
for
∈
(16)
2. Case-by-case trials to compare road surface images
In this section, normal and usual road surface images and DH and DPB values for road surface conditions are extracted for comparative analyses.
The target road surface images were taken on a sunny day using a CCVT infrared imager. The cases included are as below.
For the image comparison, 10 frames from each case are selected and applied to the formulae 10 and 11.
▸Normal road surface on a sunny day
▸Case①, Road surface wet in rain
▸Case②, Road surface with a rainwater puddle
▸Case③, Rain falls on the road surface
▸Case④, Road surface under unfavorable weather condition
As in Fig. 2~5, 4 cases(①~④) are used for image comparison, and DH and DPB values are derived in each case.
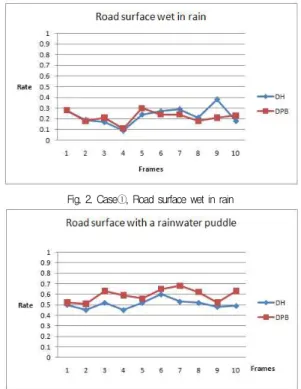
Fig. 2. Case①, Road surface wet in rain
Fig. 3. Case②, Road surface with a rainwater puddle
Fig. 4. Case③, Rain falls on the road surface
Fig. 5. Case④, Road surface under unfavorable weather condition
3. Results of analyzing the proposed mechanism To analyze and assess the proposed mechanism, 4 cases with 10 images per case were used in the image frame trial. The original (reference) image is the road surface image frame for a sunny day, against which each image frame for each selected case is compared to extract DH and DPB values.
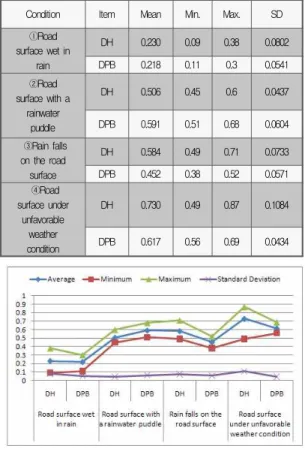
Table 1 and Fig. 6 are the result of the analysis.
Condition Item Mean Min. Max. SD
①Road surface wet in
rain
DH 0.230 0.09 0.38 0.0802
DPB 0.218 0.11 0.3 0.0541
②Road surface with a
rainwater puddle
DH 0.506 0.45 0.6 0.0437
DPB 0.591 0.51 0.68 0.0604
③Rain falls on the road surface
DH 0.584 0.49 0.71 0.0733
DPB 0.452 0.38 0.52 0.0571
④Road surface under
unfavorable weather condition
DH 0.730 0.49 0.87 0.1084
DPB 0.617 0.56 0.69 0.0434
Table 1. Analysis of the trial
Fig. 6. Result of analysis
In sum, the case ① is a road surface wet in rain, where the extracted DH and DPB values are 0.09~0.38 and 0.11~0.30, respectively. The DH and DPB values extracted show a relatively uniform distribution. Case ② is a road surface with rainwater puddle, where DH and DPB values extracted are 0.45~0.60 and 0.51~0.68, respectively. Here, the DPB value is higher than the
DH value by 0.085 or so. Case ③ shows rain falls on a road surface, where DH and DPB are 0.49~0.71 and 038~0.52, respectively. Here, DH is higher than DPB by about 0.13. Case ④ is a road surface under unfavorable weather condition, where DH and DPB extracted are 0.49~0.87 and 0.56~0.69 each.
Although it may be a temporary condition in the 4th frame, DH is lower than DPB, but overall, DH values extracted are higher.
DH and DPB values are opposite between Case ② and ③. In case ②, DPB is higher than DH, whereas in case ③ DH is higher than DPB.
The extracted mean values of DH for cases ①-④ are 0.23, 0.506, 0.584 and 0.730. In cases ② and
③, the values are similar, so the extracted DH values can be grouped into 3 types. The case ① is a low-risk road condition; the cases ② and ③ are a medium risk; and the case ④ belongs to a high risk.
The mean values of DPB for cases ① -④ are 0.218, 0.591, 0.452 and 0.617. DPB values, as in the DH values, can be categorized into three levels.
Although cases ② and ③ show similar results in regard of DH and DPB, when DH and DPB values are compared with each other, the values are crossed with higher and lower values. In other words, DH is higher in the case ②, while DPB is higher in case ③. Thus, the DH and DPB values compared and extracted are applicable to specify 4 cases of road risks.
To sum up the results of the trial, the level 1 warning on road surface conditions is issued in case
①, where DH and DPB values are less than 0.38.
The level 2 warning on road surface conditions is issued in case ②, where DH and DPB values are 0.45 ∼ 0.68 and DH is lower than DPB. The level 3 warning is issued in case ③, where DH and DPB are 0.4 ∼ 0.7 and DPB is lower than DH. The level 4 warning is issued in case ④, where DH and DPB values extracted are above 0.54. However, it is implausible to passively use the values extracted here because those numbers are influenced by temporary changes of images to a great extent.
Hence, it is plausible and useful to extract and apply mean and standard deviation values per case from time to time. The present study tried 4 cases as target images. Further trials are needed using a number of cases.
V. Conclusion
The present study suggested a base technology to provide drivers with information on road conditions for safe driving. By taking into account the case-specific characteristics of road surface conditions, road images are compared here to ensure safe driving on slippery wet roads when it rains.
In the trial, the proposed technology was applied to 4 cases, where DH and DPB values extracted were distinct enough to categorize the road surfaces.
The information derived here can be used to provide drivers with early warnings, alerts and alarms for careful and cautious driving.
The cases used for the trial in this study were not applied to the road freezing conditions caused by snow in winter. It seems possible to provide drivers with warning information for safe driving based on the proposed technology and suitable threshold values for a range of conditions.
Reference
[1] Jeong Jae-Wook, “A Study on Problems Shown in Light of a Practical Application of the Road Traffic Law“, Korean Law Association, Vol. 34, May, 2009.
[2] ITU-T RECOMMENDATION H.264 “Advanced Video Coding for Generic Audiovisual Services”, May 2003.
[3] Dong Seok Lee, Jisang Yoo, “New Prefiltering Methods based on a Histogram Matching to Compensate Luminance and Chrominance Mismatch for Multi-view Video” , The Institute of Electronics Engineers of Korea, Vol 47, No.6, Nov., 2010.
[4] C. Doutre, P. Nasiopoulos, “A Colour Correction Preprocessing Method for Multiview Video Coding,” Department of Electronic and Computer Engineering, University of British Columbia.
[5] U. Fecker, M. Barkowsky, and A. Kaup, “Time-constant histogram matching for colour compensation of multi-view video sequences,” in Proc. 26th Picture Coding Symp. (PCS 2007), Lisbon, Portugal, Nov.
2007.
[6] Eun-Geom Jang, Byoungsoo Koh, “The Original Similarity Extraction Mechanism for Digital Content Copyright Protection in UCC Service Environment”, MUE, 4thinternationalConferenceon,Sep., 2010.
[7] Bovic, Al C. "Handbook of Image Video Processing", Communications, Networking and Multimedia Series, Edition Feb., 2005.
저 자 소 개
장 은 겸
2007 : 대전대학교 컴퓨터공학과 공학박사.
2008-현재 : (주)엔투스 부설연구소장 2009-현재 : 대전대학교 컴퓨터공학과 겸
임교수
관심분야 : DRM, 컴퓨터 포렌식스, 모바일 보안
Email : [email protected]