This is an Open Access article distributed under the terms of the Creative Commons Attribution Non-Commercial License (http: //creativecommons.org/licenses/by- nc/4.0/) which permits unrestricted non-commercial use, distribution, and reproduction in any medium, provided the original work is properly cited.
Copyright: © 2019 Korean Journal of Agrcultural Science
https://doi.org/10.7744/kjoas.20190004
ENGINEERING
Comparison of reference evapotranspiration estimation methods with limited data in South Korea
Min-Gi Jeon
1, Won-Ho Nam
2,†,*, Eun-Mi Hong
3,†,*, Seonah Hwang
4, Junghun Ok
4, Heerae Cho
4, Kyung-Hwa Han
4, Kang-Ho Jung
4, Yong-Seon Zhang
4, Suk-Young Hong
41
Department of Bioresources and Rural Systems Engineering, Hankyong National University, Anseong 17579, Korea
2
Department of Bioresources and Rural Systems Engineering, Institute of Agricultural Environmental Science, Hankyong National University, Anseong 17579, Korea
3
Department School of Natural Resources and Environmental Science, Kangwon National University, Chuncheon 24341, Korea
4
National Institute of Agricultural Sciences, Rural Development Administration, Wanju 54875, Korea
*
Corresponding authors: [email protected], [email protected]
†
These authors equally contributed to this study as first author
Abstract
Accurate estimation of reference evapotranspiration (RET) is important to quantify crop evapotranspiration for sustainable water resource management in hydrological, agricultural, and environmental fields. It is estimated by different methods from direct measurements with lysimeters, or by many empirical equations suggested by numerous modeling using local climatic variables. The potential to use some such equations depends on the availability of the necessary meteorological parameters for calculating the RET in specific climatic conditions. The objective of this study was to determine the proper RET equations using limited climatic data and to analyze the temporal and spatial trends of the RET in South Korea. We evaluated the FAO-56 Penman-Monteith equation (FAO-56 PM) by comparing several simple RET equations and observed small fan evaporation. In this study, the modified Penman equation, Hargreaves equation, and FAO Penman-Monteith equation with missing solar radiation (PM-Rs) data were tested to estimate the RET. Nine weather stations were considered with limited climatic data across South Korea from 1973 - 2017, and the RET equations were calculated for each weather station as well as the analysis of the mean error (ME), mean absolute error (MAE), and root mean square error (RMSE). The FAO-56 PM recommended by the Food Agriculture Organization (FAO) showed good performance even though missing solar radiation, relative humidity, and wind speed data and could still be adapted to the limited data conditions. As a result, the RET was increased, and the evapotranspiration rate was increased more in coastal areas than inland.
Keywords: FAO Penman-Monteith, Hargreaves, modified Penman, reference evapotranspiration
OPEN ACCESS
Accepted: January 29, 2019 Revised: January 22, 2019 Received: December 11, 2018 DOI:
Citation: Jeon MG, Nam WH, Hong EM, Hwang S, Ok J, Cho H, Han KH, Jung KH, Zhang YS, Hong SY. 2019. Comparison of reference evapotranspiration estimation methods under limited data in South Korea. Korean Journal of Agricultural Science. https://doi.org/10.7744/
kjoas.20190004
Introduction
증발산량(
evapotranspiration
)은 기상학과 수문학에 사용되는 주요한 농업기상 매개 변수이며, 수문순환과 강우-유출모 형의 검증과 개발, 기후예측 및 기상예측모형 등의 기초자료로 활용된다(Allen et al
.,1998
;Sentelhas et al
.,2010
;Rim et al
.,2011
;Kim et al
.,2018
). 또한 작물의 성장에 필요한 물 수요 및 관개 용수를 산정하는데 중요한 역할을 한다(Allen et al
.,2011a
;Nam et al
.,2015b
;Hong et al
.,2016
;Djaman et al
.,2017
;Nam et al
.,2017
;Lee and Kim 2017
). 증발산량의 관측 방법은 측정기기를 통해 실측하는 방법과 구조화된 알고리즘을 이용하여 산출하는 방법이 있다. 증발산량을 실측하는 방 법에는 증발산계(lysimeter
)를 이용하여 관측하거나 물수지 기법 혹은 기상변수를 이용하여 추정한다. 그러나 우리나라의 경우 증발산계가 전국적으로 분포되어 있지않아 이용하기 어려움이 있으며, 물수지 기법이나 기상 변수를 이용한 추정 방 법은 정확하고 정밀한 실험을 통해 도출한 값들이 요구된다(Jeong and Kang
,2009
;Rim
,2010
). 또한 증발산량은 기상, 식 생, 토지 피복 등 다양한 요인들에 의해 영향을 받기 때문에, 이를 실측하는 것은 현실적으로 어렵다(Yun et al
.,2004
;Lee et al
.,2008
). 따라서 증발산량과 밀접한 관련이 있는 기상 또는 식생 변수를 이용한 간접적인 추정이 현실적이며, 기상자료를 기초로 하는 경험적인 접근법이 증발산량을 추정하는데 일반적으로 사용되고 있다(Allen et al
.,1989
;Allen et al
.,2011b
).구조화된 알고리즘을 이용한 방식으로는 식생 인자의영향을 포함한 잠재증발산량(
potential evapotranspiration
,PET
) 모 형이 소개되었고, 이를 기준으로 실제증발산량(actual evapotranspiration
,AET
)을 추정하는 연구가 수행되고 있다(Pereira et al
.,1999
).PET
은 주어진 기상조건에서의 단위면적당, 단위시간당 자유 수면에서의 가능한 증발량으로(Penman
,1948
;Thornthwaite
,1948
;Jensen et al
.,1990
), 토양함수가 포화된 상태에서의 가능한 증발량으로 정의될 수 있으며, 이때 피복 작 물이alfafa
나grass
일 경우의PET
가 기준증발산량(reference evapotranspiration
,RET
)이 된다. 과거에는AET
을 직접 추정하 는 방식으로 접근하였으나, 식생 인자의 중요성이 부각되면서 이를 포함한 모델이 주를 이루고 있다(Moon et al
.,2013
).따라서 제한된 환경에서 모델링 된 공식과 특성계수를 이용하고 있으며, 여러
RET
공식들 중 우리나라 기후에 맞는 공 식을 검토할 필요가 있다. 우리나라의 경우 여러 증발산량 공식들을 통한 증발산량 산정과 산정된 증발산량의 추세를 분 석하는 연구들이 수행되었다(Rim
,2008
;Hong et al
.,2015
;Nam et al
.,2015a
).Kim and Kim
(2005
)은 엽면적지수(leaf area index
,LAI
)를 고려한FAO
-56 Penman
-Monteith
(FAO
-56 PM
)공식을 이용하여RET
를 산정하였으며,Kim and Kim
(2008
)은Penman
-Monteith
식으로 산정된RET
와 증발접시 증발량을 비교하였다.Choi et al
. (2010
)은reference evapotranspiration calculator software
(REF
-ET
)의17
개의RET
식을 활용하였다. 하지만 이러한 연구들은 한정된 지역을 분석하여, 우리나라 전반적인 특성을 설명하기 어려웠으며, 연구에 사용된 자료들의 기간이 짧아 기후변화에 따른 지역적 특성을 설명하는데 한계가 있다.본 연구에서는 우리나라
9
개 측후소(춘천, 서울, 인천, 수원, 대전, 부산, 목포, 여수, 진주) 소형접시에서 계측된 소형pan
증발량 데이터를 기준으로 해당9
개 지역의 기상관측소 데이터를 활용하여modified Penman
공식,Hargreaves
공식,FAO
-56 PM
공식, 태양복사 에너지 관련 자료가 부족하여 기온 자료를 바탕으로 유추하여 산정한Penman
-Monteith
(PM
-Rs
)공 식의RET
값을 비교하여 우리나라 적정 증발산량 공식을 검토하였다. 또한 우리나라 도서지역을 제외한56
개 지역의 기상 관측소에 대하여1973
년부터의 기상자료를 수집하여 산정한 지역별RET
들을 비교하고, 시공간 추세를 분석하였다.Materials and Methods
연구 지역 및 데이터
증발산량 공식들과
r
증발접시 데이터의 비교를 위해 소형pan
증발량 자료가 있는9
개 지역(춘천, 서울, 인천, 수원, 대전,부산, 목포, 여수, 진주)의 소형
pan
증발량 데이터와 해당9
개 지역의 기상자료를 수집하였다. 또한 우리나라 증발산량의 시 공간 추세를 분석하기 위하여1973
년부터2017
년까지 기상자료가 있는 도서지역을 제외한56
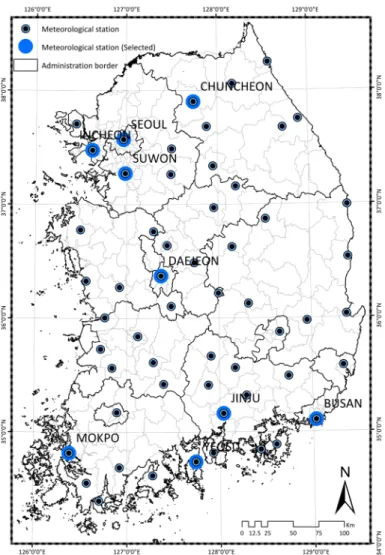
개 기상관측소 자료를 사용 하였고, 연구 대상지역을Fig
.1
로 나타내었다.Fig. 1. Spatial distribution of the 56 meteorological stations and 9 small evaporation observe stations. The
nine stations identified with a letter are used as selected examples.Modified Penman 공식
modified Penman
공식은FAO
에서Penman
(1948
) 공식을 수정한 공식이다. 바람 함수, 지역 조건을 고려한 조정 요소를 산정하여RET
을 산정하며, 식(1
)과 같다.RET C W R G
W f u e e
MP w
1
n s a
t m
= -
+ - -
] g ] g ] ] g g
; E
(1
)W D c
=
D
+ (2
)( ) . ( . )
f u
=0 27 1
+0 86 u
2 (3
)이때 RETMP는 기준증발산량(
mm
/day
), W 는 온도로 계산되는 가중치, C 는 주야간 기후차이에 의한 보정계수,t
w는 물의 밀도(1000mkg3), Rn은 이용가능 복사열(m day2MJ
/
), G는 토양유속밀도(m day2MJ/
), m 는 증발잠열(MJkg ), es는 포화증 기압(kPa
), ea는 실제증기압(kPa
), D 는 포화증기압과 온도곡선의 기울기(kPa
/℃),γ
는 건습계상수(kPa
/℃), ( )f u
는 풍속 함수, u2는2 m
지점의 풍속(m
/s
)이다.Hargreaves 공식
Hargreaves
공식(Hargreaves and Samani
,1985
)은 기상자료가 제한적인 상황에서 최고 및 최저기온과 대기권 상층부 태 양복사열(extraterrestrial radiation
) 자료만을 이용하여RET
를 산정 하는 방법으로, 국내외 연구자들에 의해 제한된 기상 자료 조건 하에서Hargreaves
공식의 적용성을 확인하였다(Hargreaves and Samani
,1982
;Jensen et al
.,1990
;Allen et al
.,1998
;Hargreaves and Allen
,2003
;Temesgen et al
.,2005
;Lee and Park
,2008
).Hargreaves
공식은 식(4
)와 같다.( . )
RET
Har=K
ET#R
a#T
mean+17 8
#TD
0 5.
(4
)이때 RETHar는 기준증발산량(
mm
/day
), KET는 지역 매개변수, Ra는 성층권에 도달한 태양에너지(mm
/day
),T
mean는 일 평균기온(℃), TD는 최대기온과 최소기온 온도의 차이다.FAO-56 Penman-Monteith 공식
FAO
는 작물 계수(crop coefficients
)에 기반하여RET
를추정하는 방법을 개발하였으며(Doorenbos et al
.,1997
),FAO
-56 PM
공식(Allen et al
.,1998
)을RET
산정 공식으로 추천하였다(Pereira et al
.,2015
). 또한,FAO
-56 PM
공식은 세계관개 배수위원회(International Commission on Irrigation
&Drainage
,ICID
), 세계기상기구(World Meteorological Organization
,WMO
)에서 추천하였다(Chiew et al
.,1995
;Allen et al
.,1998
;Garcia et al
.,2004
;López
-Urrea et al
.,2006
;Cai et al
.,2007
;Suleiman et al
.,2009
).FAO
-56 PM
공식은 식(5
)와 같다.( . )
.
RET u
R G e e
T u 1 0 34
0 408 273
900
PM
n s a
mean 2
2
c c D
D
= + +
- + +
] g < ]
-g F
(
5
)이때 RETPM은 기준증발산량(
mm
/day
), D 는 포화증기압과 온도곡선의 기울기(kPa
/℃), Rn은 이용가능 복사열 (m day2MJ/
), G 는 토양유속밀도 (m day2MJ/
), es는 포화증기압(kPa
), ea는 실제증기압(kPa
), c 는 건습계상수(kPa
/℃),T
mean는 일 평균기온(℃), u2는2 m
지점의 풍속(m
/s
)이다.기상자료를 추정하여 산정한 FAO-56 Penman-Monteith 공식
과거기상관측소에 제공되는 기상자료의 경우 제공되는 기상자료의 종류가 적어 장기간에 걸쳐
FAO
-56 PM
공식을 적용 하여RET
를 산정하기 어렵다. 기상 자료가 부족한 조건에서 기상 자료의 추정 방법이 제시되었으며(Allen et al
.,1998
), 불 가리아, 캐나다, 튀니지 등에서 적용되었다(Popova et al
.,2006
;Jabloun and Sahli
,2008
;Sentelhas et al
.,2010
). 본 연구에 서는 태양복사에너지(Rs)를 최대 최소 기온으로 추정하는 방법(Allen et al
.,1998
)을 사용하였으며, Rs를 추정하는 공식 은 식(6
)과 같다. 그 외에는FAO
-56 PM
공식과 동일하다.R
s=k
rsT
max-T
minR
a (6
)여기서 Ra는 대기권 밖에서의 복사에너지(m day2MJ
/
), Tmax는 최고기온(℃), Tmin은 최저기온(℃), krs는 조정 계수(℃0.5)이다. krs는 내륙지역과 해안지역에서 각각 다르다고 알려져 있으며, 경험적으로 내륙지역의 경우
0
.16
을, 해안지역의 경우0
.19
를 사용한다. 본 논문에서는 krs을 추정하는 식을 사용하였으며(Hargreaves and Samani
,1982
), 식(7
)과 같다.k k P P .
rs r 0
0 5
= 0
c m
(7
)여기서 P 는 평균 대기압(
kPa
)이고, P0는 해수면 기준 평균 대기압(101
.3 kPa
), kr0는 조정계수로 경험적으로 내륙지역에서
0
.17
℃ − 0.5, 해안지역에서0
.20
℃ − 0.5으로 알려져 있다(Kim et al
.,2017
).소형증발량 및 기준증발산량 비교 방법
기상청에서 제공하는 춘천, 서울, 인천, 수원, 대전, 부산, 목포, 여수, 진주
9
개 지역 소형pan
증발량 자료와 해당9
개 지 역 기상자료를 바탕으로 산정한 각각의RET
값의 상관성을 분석하였다. 이를 위해 평균오차(mean error
, ME), 평균절대 오차(mean absolute error
, MAE), 평균제곱근편차(root mean square error
, RMSE)를 적용하였으며 산정 식은 식(8
), (9
), (10
)과 같다.( )
ME N
X
iE
i pan,
i N
= 1
-
/ =
(
8
)MAE N
X
iE
i pan,
i N
= 1
-
/ =
(
9
)( )
RMSE N
X E ,
.
i i pan iN 1
0 5
=
-
> / = H
(
10
)이때
X
i는 월별 월평균 일RET
(mm
/day
), Ei pan,
은 소형pan
증발량(mm
),N
은 자료의 수(months
)이다.MAE
는 극한 값에서RMSE
보다 덜 민감하며, 직관적으로 인위적인 제곱근을 적용하지 않았다는 면에서 선호될 수 있으 며,RMSE
는 수리 및 통계학적 분석에서 심층적으로 적용될 수 있다(Fox
,1981
).RMSE
나MAE
가0
에 가까울수록 유사한 결과를 의미한다.ME
의 경우 각각의 검토된RET
공식으로부터 산정된 증발산량 값이 소형증발접시에서 측정된 증발량값 과 비교하여 평균적으로 크게 산정되는지 혹은 작게 산정되는지 등의 경향을 판단할 수 있다. 예를 들어ME
값이 양(+)의 값 을 가지는 경우 계산치의 과다추정에 해당하는 것을 의미하며, 음(-)의 값을 가지는 경우는 계산치의 과소추정에 해당하는 것을 의미한다.기준증발산량 추세분석 방법
시계열에 따른
RET
를 분석하기 위해56
개 지역의 연별, 월별Pearson
상관계수 (Pearson correlation coefficient
)를 산정 하여 분석하였으며 공식은 식(11
)과 같다.( ) ( )
( )( )
r
x x y y
x x y y
i i n
i i n
i i
i n
1 1
1
2 2
=
- -
- -
= =
=
/ /
/
(11
)Pearson
상관계수는 두 계량형 변수 사이의 선형 관계를 평가하는 방법이다. 값의 범위는 -1
부터 +1
이며1
은 한쪽의 변 수의 값이 증가함에 따라 비교하는 쪽의 변수 값도 증가함을 뜻하고, 반대로 -1
은 한쪽의 변수 값이 증가할 때 비교측의 변 수 값이 감소함을 뜻한다. 따라서Pearson
값이 -1
에 가까울수록RET
가 감소하는 추세이며,1
에 가까울수록RET
가 증가 하는 추세로 해석이 된다.Table 1. Results of the ME, MAE, RMSE as determined by the RET model.
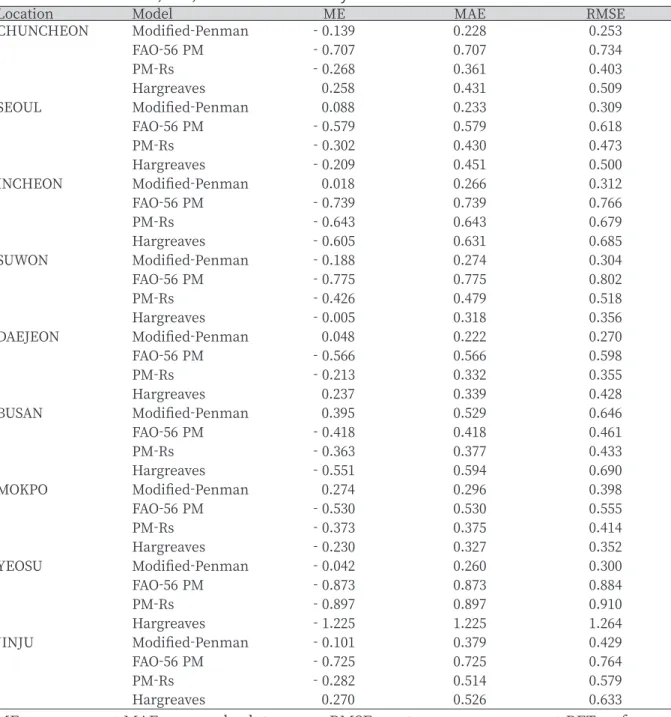
Location Model ME MAE RMSE
CHUNCHEON Modified-Penman - 0.139 0.228 0.253
FAO-56 PM - 0.707 0.707 0.734
PM-Rs - 0.268 0.361 0.403
Hargreaves 0.258 0.431 0.509
SEOUL Modified-Penman 0.088 0.233 0.309
FAO-56 PM - 0.579 0.579 0.618
PM-Rs - 0.302 0.430 0.473
Hargreaves - 0.209 0.451 0.500
INCHEON Modified-Penman 0.018 0.266 0.312
FAO-56 PM - 0.739 0.739 0.766
PM-Rs - 0.643 0.643 0.679
Hargreaves - 0.605 0.631 0.685
SUWON Modified-Penman - 0.188 0.274 0.304
FAO-56 PM - 0.775 0.775 0.802
PM-Rs - 0.426 0.479 0.518
Hargreaves - 0.005 0.318 0.356
DAEJEON Modified-Penman 0.048 0.222 0.270
FAO-56 PM - 0.566 0.566 0.598
PM-Rs - 0.213 0.332 0.355
Hargreaves 0.237 0.339 0.428
BUSAN Modified-Penman 0.395 0.529 0.646
FAO-56 PM - 0.418 0.418 0.461
PM-Rs - 0.363 0.377 0.433
Hargreaves - 0.551 0.594 0.690
MOKPO Modified-Penman 0.274 0.296 0.398
FAO-56 PM - 0.530 0.530 0.555
PM-Rs - 0.373 0.375 0.414
Hargreaves - 0.230 0.327 0.352
YEOSU Modified-Penman - 0.042 0.260 0.300
FAO-56 PM - 0.873 0.873 0.884
PM-Rs - 0.897 0.897 0.910
Hargreaves - 1.225 1.225 1.264
JINJU Modified-Penman - 0.101 0.379 0.429
FAO-56 PM - 0.725 0.725 0.764
PM-Rs - 0.282 0.514 0.579
Hargreaves 0.270 0.526 0.633
ME, mean error; MAE, mean absolute error; RMSE, root mean square error; RET, reference evapotranspiration; FAO 56-PM, FAO-56 Penman-Monteith equation; PM-Rs, FAO Penman-Monteith equation with missing solar radiation.
Fig. 2. Relationships between estimated ETo (reference evapotranspiration) by FAO-56 PM (FAO-56 Penman-
Monteith equation) and PM-Rs (FAO Penman-Monteith equation with missing solar radiation) at nine selected meteorological stations using scatter plots.Results and Discussion
기준증발산량 공식비교
본 연구에서는 소형증발접시의 증발량과
4
가지RET
산정공식을 통해 산정한RET
값을 비교하였으며, 결과는Table 1
과 같다.ME
값을 비교한 결과modified Penman
공식은5
개 지역(서울, 인천, 대전, 부산, 목포)에서 양(+)의 값을 보이며,FAO
-56 PM
공식은9
개 모든 지역에서 음(-)의 값이 나왔고,Hargreaves
공식의 경우3
개 지역(춘천, 대전, 진주)에서 양(+) 의 값을 보이고 있다.MAE
와RMSE
를 살펴보면 두 결과 모두FAO
-56 PM
공식이7
개 지역(춘천, 서울, 인천, 수원, 대전, 목포, 진주)에서 증발량과 유사하였다. 모든 내륙 지역(춘천, 서울, 수원, 대전, 진주)에서modified Penman
공식이 유사하였 으며,Hargreaves
공식의 경우 인천과 목포지역을 제외한2
개 해안 지역(부산, 여수)에서Hargreaves
공식이 소형pan
증발 량과 유사한 것으로 나타났다.소형
pan
증발량 자료가 있는9
개 지역(춘천, 서울, 인천, 수원, 대전, 부산, 목포, 여수, 진주)에서PM
-Rs
공식을 이용하여 산정된RET
와FAO
-56 PM
공식으로 산정한RET
를 비교 하여Fig
.2
로 나타내었다.또한
IWMI
(International Water Management Institute
)에서 제시된 전 지구 기후자료를 이용하여FAO
-56 PM
공식과Hargreaves
공식을 비교 한 결과Hargreaves
공식이FAO
-56 PM
공식과 유사한 결과(Droogers and Allen
,2002
)를 얻은 연 구를 바탕으로FAO
-56 PM
공식과Hargreaves
공식을 비교하여Fig
.3
으로 나타내었다.FAO
-56 PM
공식을 기준으로PM
-Rs
공식과Hargreaves
공식의R
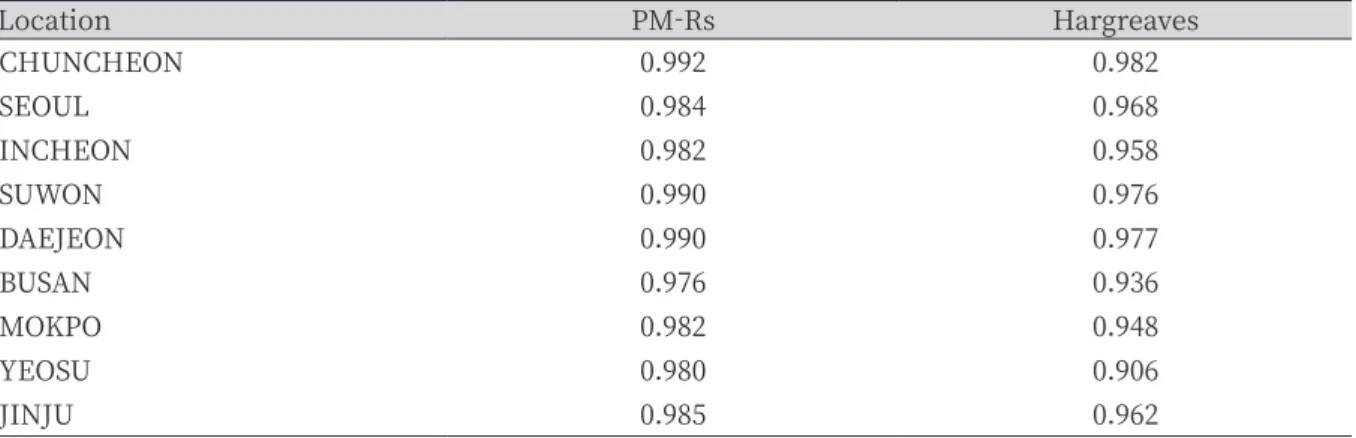
2값을 정리하여Table 2
로 나타내었다.9
개 지역에서 두 공식 모두R
2값이0
.9
를 넘는 높은 정밀도를 보이고 있으며, 모든 지역에서PM
-Rs
공식이Hargreaves
공식보다R
2값이 크다. 그리고 두 공식 모두 해안지역인4
개 지역(인천, 부산, 목포, 여수)에서의R
2값이 내륙지역보다 작게 산정되었다.기준증발산량 추세 분석
우리나라
RET
추세를 파악하기 위하여FAO
-56 PM
공식의RET
자료를 사용하였다. 과거30
년(1973
-2002
년)과 최근Table 2. Results of the coefficient of determination as determined by the reference evapotranspiration
model.Location PM-Rs Hargreaves
CHUNCHEON 0.992 0.982
SEOUL 0.984 0.968
INCHEON 0.982 0.958
SUWON 0.990 0.976
DAEJEON 0.990 0.977
BUSAN 0.976 0.936
MOKPO 0.982 0.948
YEOSU 0.980 0.906
JINJU 0.985 0.962
PM-Rs, FAO Penman-Monteith equation with missing solar radiation.
Fig. 3. Relationships between estimated ETo (reference evapotranspiration) by FAO56-PM (FAO-56 Penman-
Monteith equation) and Hargreaves at nine selected meteorological stations using scatter plots.Fig. 5. Normal distribution of mean FAO56-PM (FAO-56 Penman-Monteith equation ) reference.
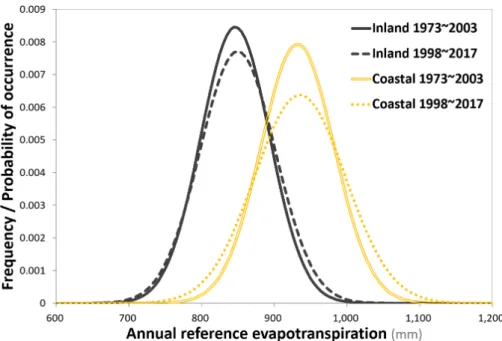
Fig. 4. Normal distribution of mean FAO56-PM (FAO-56 Penman-Monteith equation) reference
evapotranspiration to 56 meteorological stations.30
년(1998
-2017
년)56
개 지역RET
의 정규분포를 구하여,Fig
.4
로 나타내었다. 또한 해안지역과 내륙지역의RET
차이와 변화를 보기 위하여 연구 지역인56
개 지역을 내륙 지역과 해안지역으로 나누어 최근30
년과 과거30
년의RET
변화를Fig
.5
와 같이 나타내었다. 전체 기간 모두 내륙지역보다 해안지역의RET
의 평균이 높았으며 내륙지역 해안지역 모두RET
의 평균과 표준편차가 증가하였으며, 증가율은 해안지역이 더 큰 것을 알 수 있다. 두 정규분포 그래프를 보아 우리나라RET
은 평균과 표준편차가 증가하는 추세임을 알 수 있으며, 이는RET
증가로 인한 관개필요수량의 증가를 보여준다.시계열에 따른
RET
를 분석하기 위해56
개 지역 연별, 월별Pearson
상관계수를 산정하였다. 연별 추세를 보면, 전주 지역이
0
.69
로 가장 큰 증가추세를 보이고 있으며, 부여 지역이 -0
.542
로 가장 크게 감소하는 추세를 보이고 있다. 월별 자료를 보면 봄철인3
월에56
개 모든 지역에서 양의 값을 가지며, 전국적으로RET
가 증가하는 추세임을 알 수 있다. 겨울철(12
월 -2
월)을 제외한 기간에서 강릉, 서울, 포항, 울산4
개 지역이 모두 증가함을 보이고 있으며, 기간 전체에 걸쳐 감소하는 추세 로 결과가 나온 지역은 없다.Conclusion
본 연구에서는
1973
년부터 소형pan
증발량 자료가 있는9
개 지역(춘천, 서울, 인천, 수원, 대전, 부산, 목포, 여수, 진주) 과 연구에서 사용한4
가지 기준증발산량 공식들을 비교하였다. 연구 결과modified Penman
공식이 우리나라 소형증발량 과 가장 유사하게 기준증발산량을 산정하는 것을 알 수 있다. 하지만 증발량의 경우 작물의 증산작용을 포함하지 않으므로 실제 증발산량보다 작게 산정된다. 따라서ME
값이9
개 지역 모두 음수값이 나와 기준증발산량이 과소추정된FAO
-56 PM
과Pm
-Rs
식을 소형증발량이 아닌 기준증발산량과 비교하는 후속연구를 통해, 우리나라 최적 기준증발산량 식을 분석하 는 연구가 필요하다.Hargreaves
공식으로 산정한 기준증발산량은 해안지역과 내륙지역의 기준증발산량 비교 결과 해안지 역에서의 기준증발산량값이 내륙지역보다 추정 값의 오차가 높았다. 또한 기상관측데이터가 제한적일 경우PM
-Rs
공식이FAO
-56 PM
공식과 높은 유사성을 가지고 있음을 확인할 수 있었다. 소형pan
증발량과4
개의 서로 다른 기준증발산량 공 식별 기준증발산량 값을 비교하여modified
-Penman
공식이 소형pan
증발량과 유사하는 결과를 도출하였다.FAO
-56 PM
공식은Hargreaves
공식보다 기상자료를 추정하여 산정한PM
-Rs
공식과 유사하였다. 기준증발산량의 추세를 분석하기 위 해FAO56
-PM
공식을 사용하여 우리나라 기준증발산량 추세를 분석한 결과 우리나라에서 전반적으로 기준증발산량이 증 가하는 추세임을 보였으며 내륙보다 해안지역의 기준증발산량의 값의 변화가 크게 나타났다.FAO
-56 PM
공식에서 내륙 과 해안지역에 따라 기준증발산량이 갖는 편향을 분석하는 후속연구를 통해 지역별로 구분된 기준증발산량 산정이 필요하 다.Acknowledgements
본 연구는 농촌진흥청의 공동연구사업 (과제번호:
PJ012569022018
)의 지원을 받아 연구되었음.Authors Information
Min
-Gi Jeon
,https
://orcid
.org
/0000
-0002
-1479
-1611 Won
-Ho Nam
,https
://orcid
.org
/0000
-0002
-9671
-6569 Eun
-Mi Hong
,https
://orcid
.org
/0000
-0001
-9202
-5296
Jung
-Hun Ok
,Soil and fertilizer division
,National Institute of Agricultural Sciences
,Rural Development Administration
,Researcher
Hee
-Rae Cho
,Soil and fertilizer division
,National Institute of Agricultural Sciences
,Rural Development Administration
,Researcher
Seon
-Ah Hwang
,Soil and fertilizer division
,National Institute of Agricultural Sciences
,Rural Development Administration
,Researcher
Kyung
-Hwa Han
,Soil and fertilizer division
,National Institute of Agricultural Sciences
,Rural Development
Administration
,Researcher
Kang
-Ho Jung
,Soil and fertilizer division
,National Institute of Agricultural Sciences
,Rural Development Administration
,Researcher
Yong
-Seon Zhang
,Soil and fertilizer division
,National Institute of Agricultural Sciences
,Rural Development Administration
,Researcher
Suk
-Young Hong
,Soil and fertilizer division
,National Institute of Agricultural Sciences
,Rural Development Administration
,Researcher
References
Allen RG, Jensen ME, Wright JL, Burman RD. 1989. Operational estimates of reference evapotranspiration.
Agronomy Journal 81:650-662.
Allen RG, Pereira LS, Raes D, Smith M. 1998. Crop evapotranspiration-guidelines for computing crop water requirements. FAO Irrigation and Drainage Paper 56. FAO, Roma, Italy.
Allen RG, Pereira LS, Howell TA, Jensen ME. 2011a. Evapotranspiration information reporting: I. Factors governing measurement accuracy. Agricultural Water Management 98:899-920.
Allen RG, Pereira LS, Howell TA, Jensen ME. 2011b. Evapotranspiration information reporting: II.
Recommended documentation. Agricultural Water Management 98:921-929.
Cai J, Liu Y, Lei T, Pereira LS. 2007. Estimating reference evapotranspiration with the FAO Penman- Monteith equation using daily weather forecast messages. Agricultural and Forest Meteorology 145:22- 35.
Chiew FHS, Kamaladasa NN, Malano HM, McMahon TA. 1995. Penman-Monteith FAO-24 reference crop evapotranspiration and class-a pan data in Australia. Agricultural Water Management 28:9-21.
Choi W, Choi M, Oh H, Park J. 2010. Estimation on trends of reference evapotranspiration of weather station using reference evapotranspiration calculator software. Journal of the Korean Society of Civil Engineers 30:219-231. [in Korean]
Djaman K, Irmak S, Futakuchi K. 2017. Daily reference evapotranspiration estimation under limited data in Eastern Africa. Journal of Irrigation and Drainage Engineering 143:06016015.
Doorenbos J, Pruitt WO, Aboukhaled A. 1997. Crop water requirements. FAO Irrigation and Drainage Paper 24. FAO, Roma, Italy.
Droogers P, Allen RG. 2002. Estimating reference evapotranspiration under inaccurate data conditions.
Irrigation and Drainage Systems 16:33-45.
Fox DG. 1981. Judging air quality model performance: A summary of the AMS workshop on dispersion model performance. Bulletin of the American Meteorological Society 62:599-609.
Garcia M, Raes D, Allen R, Herbas C. 2004. Dynamics of reference evapotranspiration in the Bolivian highlands (Altiplano). Agricultural and Forest Meteorology 125:67-82.
Hargreaves GH, Samani ZA. 1982. Estimating potential evapotranspiration. Journal of the Irrigation and
Drainage Division 108:225-230.
Hargreaves GH, Samani ZA. 1985. Reference crop evapotranspiration from temperature. Applied Engineering in Agriculture 1:96-99.
Hargreaves GH, Allen RG. 2003. History and evaluation of Hargreaves evapotranspiration equation.
Journal of Irrigation and Drainage Engineering 129:53-63.
Hong EM, Nam WH, Choi JY. 2015. Climate change impacts on agricultural drought for major upland crops using soil moisture model–focused on the Jeollanam-do-. Journal of the Korean Society of Agricultural Engineers 57:65-76. [in Korean]
Hong EM, Nam WH, Choi JY, Pachepsky YA. 2016. Projected irrigation requirements for upland crops using soil moisture model under climate change in South Korea. Agricultural Water Management 165:163- 180.
Jabloun MD, Sahli A. 2008. Evaluation of FAO-56 methodology for estimating reference evapotranspiration using limited climatic data: Application to Tunisia. Agricultural Water Management 95:707-715.
Jensen ME, Burman RD, Allen RG. 1990. Evapotranspiration and irrigation water requirements. ASCE Manuals and Reports on Engineering Practice 70.
Jeong DI, Kang J. 2009. An analysis of changes in pan evaporation and climate values related to actual evaporation. Journal of Korea Water Resources Association 42:117-129. [in Korean]
Kim D, An H, Jang M, Kim S. 2018. Development of a distributed hydrological model considering hydrological change. Korean Journal of Agricultural Science 45:521-532. [in Korean]
Kim JH, Kim KT. 2005. Estimation of potential evapotranspiration using LAI. Journal of the Korean Association of Geographic Information Studies 8:1-13. [in Korean]
Kim S, Kim HS. 2008. The integrational operation method for the modeling of the pan evaporation and the alfalfa reference evapotranspiration. Journal of the Korean Society of Civil Engineers 28:199-213.
[in Korean]
Kim SJ, Kim MI, Lim CH, Lee WK, Kim BJ. 2017. Applicability analysis of FAO56 Penman-Monteith methodology for estimating potential evapotranspiration in Andong Dam watershed using limited meteorological data. Journal of Climate Change Research 8:125-143. [in Korean]
Lee G, Kim YH. 2017. Estimating the economic value of agricultural water using the virtual water concept.
Korean Journal of Agricultural Science 44:636-641. [in Korean]
Lee KH, Cho HY, Oh NS. 2008. Calibration and validation of the Hargreaves equation for the reference evapotranspiration estimation in Gyeonggi bay watershed. Journal of Korea Water Resources Association 41:413-422. [in Korean]
Lee KH, Park JH. 2008. Calibration of the Hargreaves equation for the reference evapotranspiration estimation on a nation-wide scale. Journal of the Korean Society of Civil Engineers 28:675-681. [in Korean]
López-Urrea R, de Santa Olalla FM, Fabeiro C, Moratalla A. 2006. Testing evapotranspiration equations using lysimeter observations in a semiarid climate. Agricultural Water Management 85:15-26.
Moon JW, Jung CG, Lee DR. 2013. Parameter regionalization of Hargreaves equation based on climatological characteristics in Korea. Journal of Korea Water Resources Association 46:933-946. [in Korean]
Nam WH, Hong EM, Choi JY. 2015a. Has climate change already affected the spatial distribution and temporal trends of reference evapotranspiration in South Korea? Agricultural Water Management 150:129-138.
Nam WH, Hayes MJ, Svoboda MD, Tadesse T, Wilhite DA. 2015b. Drought hazard assessment in the context of climate change for South Korea. Agricultural Water Management 160:106-117.
Nam WH, Kim T, Hong EM, Choi JY. 2017. Regional climate change impacts on irrigation vulnerable season shifts in agricultural water availability for South Korea. Water 9:735.
Penman HL. 1948. Natural evaporation from open water, bare soil and grass. Proceedings of the Royal Society of London 193:120-146.
Pereira LS, Perrier A, Allen RG, Alves I. 1999. Evapotranspiration: Concepts and future trends. Journal of Irrigation and Drainage Engineering 125:45-51.
Pereira LS, Allen RG, Smith M, Raes D. 2015. Crop evapotranspiration estimation with FAO56: Past and future. Agricultural Water Management 147:4-20.
Popova Z, Kercheva M, Pereira LS. 2006. Validation of the FAO methodology for computing ETo with limited data, application to South Bulgaria. Irrigation and Drainage 55:201-215.
Rim CS. 2008. Comparison of evapotranspiration estimation approaches considering grass reference crop.
Journal of Korea Water Resources Association 41:212-228. [in Korean]
Rim CS. 2010. Analysis of the spatial distribution of pan evaporation trends. Journal of The Korean Society of Civil Engineers 30:243-255. [in Korean]
Rim CS, Lim GH, Yoon SE. 2011. A study on the hydroclimatic effects on the estimation of annual actual evapotranspiration using watershed water balance. Journal of Korea Water Resources Association 44:915-928. [in Korean]
Sentelhas PC, Gillespie TJ, Santos EA. 2010. Evaluation of FAO Penman-Monteith and alternative methods for estimating reference evapotranspiration with missing data in Southern Ontario, Canada.
Agricultural Water Management 97:635-644.
Suleiman AA, Hoogenboom G. 2009. A comparison of ASCE and FAO-56 reference evapotranspiration for a 15-min time step in humid climate conditions. Journal of Hydrology 375:326-333.
Temesgen B, Eching S, Davifoof B, Frame K. 2005. Comparison of some reference evapotranspiration equations for California. Journal of Irrigation and Drainage Engineering 131:73-84.
Thornthwaite CW. 1948. An approach towards a rational classification of climate. Geographical Review 38:55-94.
Yun JI, Nam JC, Hong SY, Kim J, Kim KS, Chung U, Chae NY, Choi TJ. 2004. Using spatial data and land surface modeling to monitor evapotranspiration across geographic areas in South Korea. Korean Journal of Agricultural and Forest Meteorology 6:149-163. [in Korean]