1. Introduction
Landslide is one of the most frequent natural hazard in hilly and mountainous region all over the world. It is one of the major natural disaster that has caused loss of several lives and massive damage of infrastructures and properties (Bogardi, 2006). From environmental perspective, landslides are one of the important natural phenomenon which leads to evolution of landform i.e. change over time (Hergarten and Neugebauer, 2006).
Landslide is defined as a downward mass movement of rock, soil debris or earth detaching from the underlying slope(Cruden, 1993). It is a gravitational movement which does not require any transportation medium such as water, air or ice (Crozier, 1986). The concept of landslide has been defined by many researchers in various ways. Among them, most widely used definition was given by Varnes and IAEG, 1984as 'almost all varieties of mass movements on slopes, including some, such as rock-falls, topple, and debris flows, that involve little
or no true sliding'.
The occurrence of landslide depends on various factors such as geological and geomorphological processes, changes in vegetation cover, land use and hydrologic conditions (Ercanoglu et al., 2008; Tien Bui et al., 2015). Landslides are triggered by prolonged or torrential rain and earthquakes along with anthropogenic activities such as deforestation, unplanned landuse practices etc.
In recent years, geospatial technologies have become very important in the field of landslide investigation. Recognition and classification of spatial and temporal occurrence of landslide is a critical requirement in order to understand the pre and post-disaster hazard and risk management (Martha et al., 2010). Using various techniques, many researchers have identified, classified and studied landslides and for which a proper landslide inventory has been developed at different scales depending on the purpose and the available resources (Althuwaynee et al., 2012; Pradhan, 2013; Lee, 2013; Umar et al., 2014; Tien Bui et al., 2014). A landslide inventory
Received: 2016.06.13, accepted: 2016.06.30
* MemberㆍPh. D. Candidate, Department of Civil Engineering, Kangwon National University, [email protected]
** MemberㆍProfessor, Department of Civil Engineering, Kangwon National University, [email protected]
*** Corresponding AuthorㆍMemberㆍAssistant Professor, Department of Civil Engineering, Kangwon National University, [email protected]
Geospatial Technologies for Landslide Inventory: Application and Analysis to Earthquake-Triggered Landslide of Sindhupalchowk, Nepal
*
Acharya, Tri Dev*ㆍYang, In Tae**ㆍLee, Dong Ha***
Abstract
Landslide is one of the natural hazards, triggered by rainfall or earthquake and it leads to damage and loss of properties and lives especially in hilly and mountainous regions. Inventory maps of the area is of much importance in order to understand the landslide phenomena in detail , conduct further studies on landslide, prepare susceptibility map and minimize risk.. Inventory maps of landslides can be constructed by several methods, using multiple images through visual interpretation, using algorithms in multi-spectral or SAR images or verification from field investigation. The possible methods were explored for Sindhupalchowk district of Nepal, which was struck by massive earthquake on 2015 and landslide inventory was prepared. The inventory was analyzed for its frequency over elevation, slope aspect and dominant soil classes and also the information value for their occurrence probability.
Keywords : Geospatioal Technology, Earthquake, Landslides, Landslide Inventory, Nepal
95 Vol.24 No.2 June 2016 pp.95-106
Research Paper
ISSN: 2287-6693(Online) http://dx.doi.org/10.7319/kogsis.2016.24.2.095
map is the simplest form of landslide map that shows the location the date of occurrence, and the types of mass movements that have left discernable traces in the area (Guzzetti et al., 2005). It is essential for (a) showing the location and type of landslides in a region for single or multiple events triggered by rainfall, snowmelt or earthquake, (b) determining the frequency-area statistics of slope failures for landslide susceptibility hazard and risk studies, (c) to investigate the distribution, types, and patterns of landslides in relation to morphological and geological characteristics and (d) to study the evolution of landscapes dominated by mass-wasting processes.
Thus, the quality and completeness of the landslide maps is very crucial and it affects the reliability of the estimated results obtained from the inventories.
During 1990s, examination of historical archives, analysis of stereoscopic aerial photographs, geological and geomorphological field mapping, engineering geological slope investigations were most commonly used methodologies in landslide studies due to limited availability of remote sensing technologies (Mantovani et al., 1996; Guzzetti et al., 1999; Galli et al., 2008). With recent developments in geospatial advancement, detection and mapping of landslides has facilitated the production of landslide maps rapidly and accurately. Availability of high and very-high resolution satellite images, and improved digital visualization and analysis techniques, has encouraged investigators to exploit satellite images for landslide detection and mapping.
With the recent massive earthquake events that occurred on 25th April and 12th May 2015 in Nepal, many landslides have been triggered and many locations in hilly regions of Nepal have been in a vulnerable conditions. In those earthquake affected areas, life and properties are at high risk. Hence, proper investigation of landslides types, their mechanism and future susceptibility need to be performed. Moreover, for proper hazard-risk analysis and land use management needs to be performed and proper updated inventory of landslide needs to be maintained.
This paper provides a brief review of recent geospatial technologies for landslide inventory
preparation and examines the available technologies that have been used or could possibly be used to map landslides in the area of Sindhupalchowk, Nepal, where massive earthquake has recently occurred.
Several reviews on landslide inventory maps that have been performed earlier can be can be found on Guzzetti et al. (2012). Similarly, Xu (2015) has describes the principles for preparing inventory maps of earthquake-triggered landslides, focusing on various methods and their criteria.
2. Geospatial Techniques for Landslide Inventory
The following section discuss the various geospatial techniques that can be used for the preparation of landslide inventory after an earthquake event.
2.1 Field Investigation
Field investigation is the widely used in past before the development of remote sensing technology (Xu, 2015). It is a standard geomorphological mapping by visiting the field. Based on the investigator’s judgement, the boundary and type of the landslide is determined. In order to identify landslides, field investigation is one of the reliable method, but not always the accurate, especially in case of large and old landslide sites (Guzzetti et al., 2012). For recent, small areas with few events it may be easy, but for conditions other than that, it consumes much time and cost and is very difficult to investigate and map all the accurate polygons of landslide events.
Prior to field investigation, an extensive knowledge of the visiting area is necessary. It can be done by inspection of either recent map or aerial photographs.
The method is more used in validating the inventory maps prepared by other methods by marking the existing map or recording the coordinates using a GPS. Nowadays smartphones and camera are equipped with georeferencing capabilities, which provides very good field investigation evidence.
The 1783 Calabria, Italy M 7.0 earthquake is
considered to be the first case study with the
earthquake-triggered landslide inventory map based
on field investigations in the epicenter area (Keefer,
Sindhupalchowk, Nepal 97
2002). Recently, the filed investigation methods were
also used in preparing landslide inventory maps related to moderate earthquakes (Alfaro et al., 2012;
Jibson and Harp, 2012), or only as a verification tool for a small part of landslides triggered by large earthquakes (Harp et al., 2013; Xu et al., 2014).
2.2 Visual Interpretation of Photographs In landslide inventory mapping, images with good spatial resolution are most widely. Conventional Aerial Photography included only photographs in RGB or NIR bands, but now it has been widely replaced by digital photogrammetry and also by high resolution satellite imagery such as GeoEYE, QuickBird, IKONOS, SPOT-5 etc. With introduction of Unmanned Aerial Vehicles (UAV) difficult area with high and ultra-high resolution imageries can also be acquired.
Visual interpretation of high resolution photographs is one of the most accurate way of mapping landslides (Petley, 2012) and is a benchmark against new technologies (Guzzetti et al., 2012). It is one of the key technique to prepare inventories for multiple synchronous landslides occurred during earthquakes.
The process helps to reduce unnecessary and redundant field work (Xu, 2015) and the inventories made are more likely to be resonantly accurate (Petley, 2012). A trained expert can map the landslides by digitizing positions or boundaries of landslides on paper manually or on computer using computer assisted identification in digital environment, using either simple photograph or stereoscopic 3D visualization. Dunning et al. (2007) demonstrated that the highest resolution imageries have allowed mapping of very small-scale landslide features, such as tension cracks Hattian Bala landslide in Pakistan during Kashmir earthquake. But, it consumes more time and is not efficient for large coverage such as in case of massive earthquake occurred areas. However, the cost of these specially acquired images are usually high. In case of satellite imagery, data are dependent on cloudless conditions, whereas aerial imagery can generally be collected under high clouds.
This method was applied in the analyses of several
earthquake events (Keefer, 2002), such as the 1948 M 7.3 Fukui, Japan earthquake, the May 31, 1970 M 7.9 Rio Santa earthquake of Peru, and the February 4, 1976 M 7.5 Guatemala earthquake. However, the first well-known digital inventory map for earthquake-triggered landslides was compiled by Harp and Jibson (1996), in which large amount of landslides triggered by the 17 January 1994 Mw 6.7 Northridge earthquake were mapped from visual interpretation of aerial photography and selected field verification. Their results of digitalizing landslide inventories showed more than 11,000 landslides triggered by the Northridge earthquake.
The most notable examples to date are the huge number of landslides triggered by the 2008 Wenchuan earthquake in China. Dai et al. (2011) mapped 56,000 landslides triggered by the earthquake, mainly from aerial photographs. Similarly, Parker et al. (2011) used semi-automated detection algorithm using EO-1 and SPOT 5 imagery for very detailed inventory of landslides triggered by the 2008 Wenchuan earthquake and used these data to estimate the volume loss from the mountain range as a result of mass movements during the event.
A good example is Google Earth (GE), which uses high spatial and temporal resolution georeferenced images all over the earth. Google can provide imagery of disaster affected areas very quickly. Imagery for the area impacted in the Haiti earthquake was also quickly released by Google . QuickBird imagery was available soon after the 2005 Kashmir (Pakistan and India) earthquake, which occurred in late fall, when the skies were almost cloudless. In contrast, the 2008 Wenchuan (China) earthquake occurred in May, the start of the rainy season, severely limiting the use of optical satellite tools for many weeks.
In GE one can create landslide points, area by visual inspection and store and share to the public.
Sato and Harp (2009) tested the use of Google Earth
as a base map for imported imagery to map
landslides triggered by the 2008 Wenchuan
earthquake and concluded that “Google Earth is an
effective and rapid reconnaissance tool.”
2.3 Visual Interpretation of Photographs The recent optical sensors both aerial and space borne are provided with multispectral capacities, which provide data that can be processed and analyzed.
Firstly, the acquitted images are georeferenced, then analyzed digitally in GIS platform.
When a landslide occurs, the surface topography changes, which can be identified using various methods in multispectral imagery. By adjusting threshold of single band, deriving various indices (e.g. Normalized Difference Vegetation Index) and constructing color composite, landslides can be identified (Guzzetti et al., 2012). Moreover, based on their spectral signatures, various supervised or unsupervised classification techniques are also developed for identification of landslides in complex landuse. The resulting digital landslide inventory maps can be directly used for subsequent analysis of spatial distribution and hazard assessment of landslides triggered by earthquakes.
Successful results has been shown in automated landslide identification. But, these are not quite well developed for large scale complex earthquake triggered earthquakes. Some of the studies creating inventories of landslides after large earthquakes events were done by Saba et al. (2010) ; Parker et al. (2011) and Xu et al. (2014).
2.4 LiDAR
LIDAR uses a laser beam to scan the Earth’s surface. Using LiDAR, more accurate and high resolution terrain models can be generated for small (terrestrial or UAV) or large (aerial) areas. As landslide is movement of land mass, the change in surface topography can be easily visible in 3D models and can also be identified based on topographic curvatures. Similarly, differentiating two DEMs from different time or using proper algorithm or tool can point out surface change and furthermore aid in identification of landslides. Since the availability of Light Detection and Ranging (LiDAR), shaded-relief, slope, surface roughness and contour maps, and other derivatives have regained popularity for landslide inventory mapping, especially in forested areas (Van Den Eeckhaut et al., 2013).
Stumpf and Kerle (2011) used a post-event LiDAR DEM for the manual delineation of affected areas in four sites in the northern hemisphere recently affected by landslides (Haiti, Italy, China, and France).
The limitation of the LiDAR techniques are the unavailability of adequate data, complex processing methods and high cost. Data are available for mostly limited small part of the area and acquisition cost is usually high.
2.4 SAR
Radar instruments provide the capability of all weather data acquisition. Data captured by Synthetic Aperture Radar (SAR) sensors are used chiefly to detect and monitor the topographic surface deformation and create time series of deformation at single location. SAR data has been used for the detection and mapping of single, large, rapid landslides. Modern SAR sensors are characterized by high to low spatial and radiometric resolution, multiple polarimetric capabilities, and a reduced revisiting time.
These enhanced characteristics of the modern SAR sensors will improve landslide mapping through various change detection algorithms in coming days (Guzzetti et al., 2012). Wang et al. (2009) used high resolution airborne SAR images to document landslides in the aftermath of the 2008 Wenchuan earthquake and found that, with a spatial resolution of about 1 m, the technique used was reasonably effective in locating landslides, although it did not allow quantification of their volumes.
Even though the landslide inventory is result of field investigation and remotely sensed imagery, due to the lack of proper workflow or principle, such identified inventory will vary from person to person.
Thus, maintenance of central database by concerned authority is a proper way to assure the uniformity and updated landslide inventory map.
3. Analysis of Landslide based on
Frequency Ratio and Information Value
Potentiality of landslide hazards of any region can
Sindhupalchowk, Nepal 99
be estimated on the basis of the contribution of
causative factors and the relationship between them.
Frequency ratio is the simplest spatial relationship between landslide occurrence and factors contributing it. It is then used to calculate the ratio of the cells with event occurrence in each class for a reclassified factor or categorical factor (i.e., geology and land use), and the ratio is assigned to each factor class again (Lee and Sambath, 2006). The frequency ratio (FR) of each factor’s type or class, C, is then expressed in Eq. (1) as follow:
(1)
where, P(P) denotes the area ratio for the class or type for a given number of unit cells containing a percentage of pixels in the domain for the class, and P(O) denotes the percentage of occurrence in the total event.
In the relation analysis, the ratio is that of the area where landslides occurred in the entire area, so that a value of 1 represents an average value. If the value
is bigger than 1, this implies a higher correlation, and values lower than 1 stand for lower correlations. The Information Value Method is used to calculate the weight for each class of factor layer by ratioing landslide density of each class to the landslide density of total area. Weight of a factor class (Wi) is calculated as log of ratio of density of landslide within a class of a factor to the density of landslide within the study area (Sarkar et al., 2013). Eq. (2) shows equation of weight calculation as:
ln
∑ ∑
(2)
where, W
i= Weight of a factor class; N
pix(S
i) = Number of pixel of landslide within class i; N
pix(N
i)
= Number of pixel of class i; ΣN
pix(S
i) = Number of pixel of landslide within the whole study area; Σ N
pix(N
i) = Number of pixel of the whole study area.
The natural logarithm is used to give negative weights when the landslide density is lower than normal and positive weights when it is higher than
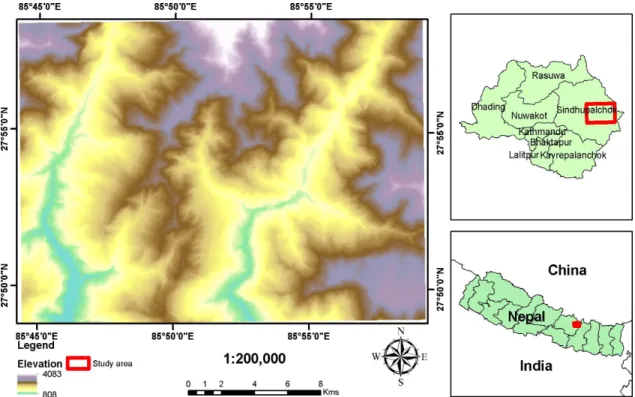
Figure 1. Location map of the study area with DEM
normal. Positive W
iindicates direct correlation between predictor factor and landslide occurrence and also represents the presence of predictor in landslide areas. Negative Wi indicates inverse correlation and absence of predictor in landslide areas.
4. Case of Sindhupalchowk, Nepal
The study area lies in Sindhupalchowk district, about 70 kilometers north-east of capital city Kathmandu, Nepal (Fig. 1). The climate of the area is subtropical, temperate, and alpine having temperature range of 28.5 to 4.0 degree Celsius and average annual rainfall of 3604.3 mm of which 80%
occurring in monsoon season (Nepal Tourism Board, 2008). It is hilly area ranging approximately from 800m to 7000m. The slopes are very steep and geology is very fragile. The dominant type of soil in the study area are cambisols and regosols formation.
The tributaries of Koshi flows through the study area
along with Araniko highway that connects Kathmandu with Kodari, Nepal’s border with People’s Republic of China. The district has suffered many frequent landslides especially in monsoon season. But after the recent earthquake along with many aftershocks that centered in the district shook the hills and left them scratched with many landslides. The area is left with fragile and ruptured landforms, which could possibly lead to more landslides in future. Immense need of updated landslide inventory map of these landslides is of great importance.
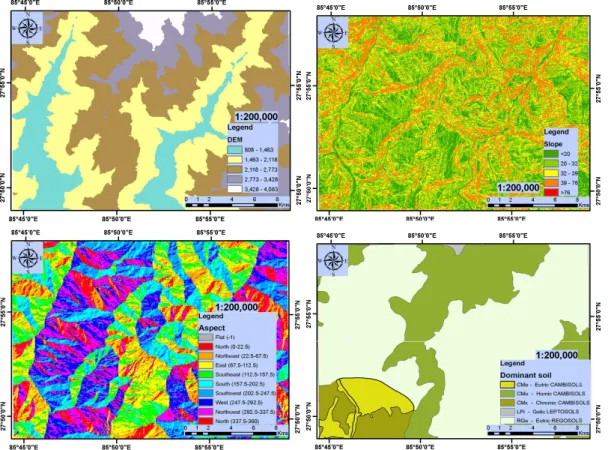
For the better understanding of topography, ASTER GDEM was used to derive slope and aspect at a resolution of 30m x 30m along with soil type.
Dominant soil classes were derived from Soil and Terrain (SOTER) database for Nepal at scale 1:50000. Fig. 2 shows the various class of topographic factors elevation, slope and aspect including dominant soil.
Figure 2. Map of elevation, slope, aspect and dominant soil in the study area
Sindhupalchowk, Nepal 101
Field investigation for landslide inventory mapping in case of Sindhupalchowk is a very difficult and risky as well. As the area is hilly and the roads are made by cutting the slopes of hills around the river, they are very fragile and can undergo slope failures any time. Another complexity is that the landslides are very complex and intertwined, hence mapping the boundary is very difficult. To cover all the area and map all the individual landslides not only consumes cost and time but also is almost impossible in many places. Fig. 3 shows the landslides events on the road sides of Araniko Highway which is very complex and massive.
Aerial photography with proper flight for the purpose of mapping has never yet done to the Sindhupalchowk area. It has been found that, initial reconnaissance was done using digital camera form helicopter flight. Fig. 4 shows the aerial photograph taken form helicopter immediately after the massive earthquake. Few small scale mapping of landslide in some areas has been done using UAVs which is very feasible and cost efficient method for densely populated risky areas.
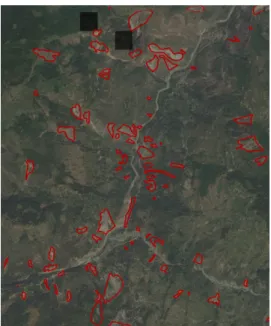
Satellite imagery such as of Landsat 8 are freely available and are very good data source for the identification of landslide in areas like Nepal. Proper landslide identification methods can be used to not include open area and other land covers. Also, pre
earthquake roads, open rock and lands could be subtracted from the recent image to get landslide pixels. Fig. 5 shows unsupervised classification of Landsat 8 image area from Sindhupalchowk where landslides were easily identified using unsupervised classification of Landsat 8 image. Field verification could be done afterwards to check the accuracy of
Figure 5. Unsupervised classification of Landsat 8 OLI image to identify landslides with earthquakes in study area section Figure 3. Photos of landslides events along Araniko
Highway during the field investigation
Figure 4. Aerial view from Helicopter reconnaissance
of landslides occurred in the study area
Figure 6. Google Earth showing landslides polygon digitized in high resolution image take on May 27, 2015 inside the study areas
identified landslides. Furthermore, object detection algorithms could be used to identify landslides more accurately.
With the introduction of Google Earth, high resolution aerial as well as satellite imagery has been available free of cost in a georeferenced GIS system.
In Google Earth, one can easily create point, line and polygons. The features created can be saved, could be shared to others and transformed to other environment as well. In case of Sindhupalchowk, recent high resolution images of various dates some panchromatic some natural color were immediately available to overview the affected area. The set of images covers most of the area with clear view and even smaller landslides are easily detectable. GE made available of images closest timeline to earthquake even NIR single band. Fig. 6 shows an image available in Google Earth with multiple complex slope failures, taken on June 03, 2015 i.e.
after the earthquake. The use of Google Earth could be very effective in case of difficult terrain of Nepal and could be a perfect tool to make preliminary landslide inventory.
Figure 7. Landslide inventory mapped in the study area
Sindhupalchowk, Nepal 103
LiDAR is so far not used in case of Nepal to map
Landslides in the study area due to its high cost of data acquisition.
SAR images could also be used for detecting the change in topography and identify the landslides in Sindhupalchowk. But, due to massive topographic change due to earthquake, identifying accurately landslides and separating it with collapsed building and structures would be very difficult in such case.
Using field investigation, Landsat 8 image classification and Google Earth images, a total of 9993 landslide pixels of 30m x 30m in the study area of 852 x 631 size i.e. 8.9 sq. km landslides were mapped in an area of 484 sq. km (Fig. 7).
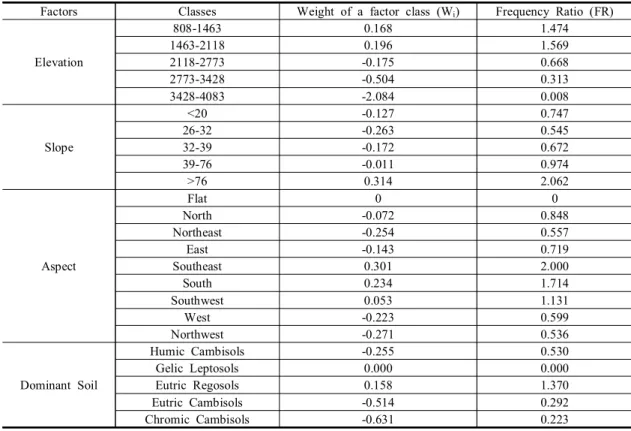
The landslide inventory created were analyzed for the distribution of the landslide based on the topographic parameters and dominant soil. Table 1 shows the statistics of the weightage of factor and frequency ratio in each class.
The elevation range were classified into five classes, where the distribution of most of the
landslides were mostly found in the range below 2118 meters. The range is mostly agricultural area and few settlements.
In order to understand and analyze landslide, slope is the most important factor. Slope were divided into five classes. Most of the landslide occurred in areas having slope higher than 76° and have positive weightage value compared to the rest of the categories. The area mostly lies nearby the bank of the river or roads, because of which the high slope area are predominant.
The aspect is defined as the direction of the maximum slope of the terrain surface and is related to factors such as exposure to sunlight, drying winds, rainfall (degree of saturation), and discontinuities, which may control landslide occurrence. The aspect was divided into nine classes for the study, including flat, north, north, northeast, east, southeast, south, southwest, west and northwest. The south part of the hills are exposed of much sun, leaving those areas to be dry and susceptible to landslides. It can be clearly
Factors Classes Weight of a factor class (W
i) Frequency Ratio (FR)
Elevation
808-1463 0.168 1.474
1463-2118 0.196 1.569
2118-2773 -0.175 0.668
2773-3428 -0.504 0.313
3428-4083 -2.084 0.008
Slope
<20 -0.127 0.747
26-32 -0.263 0.545
32-39 -0.172 0.672
39-76 -0.011 0.974
>76 0.314 2.062
Aspect
Flat 0 0
North -0.072 0.848
Northeast -0.254 0.557
East -0.143 0.719
Southeast 0.301 2.000
South 0.234 1.714
Southwest 0.053 1.131
West -0.223 0.599
Northwest -0.271 0.536
Dominant Soil
Humic Cambisols -0.255 0.530
Gelic Leptosols 0.000 0.000
Eutric Regosols 0.158 1.370
Eutric Cambisols -0.514 0.292
Chromic Cambisols -0.631 0.223
Table 1. Landslide distribution in various factor class and its weightage and frequency in the study area
seen from the table that south, south-east and south-west regions of the area show s positive relation and have high frequency to the landslide occurrence. Soil type is a very important factor to explain the landslide relationships to geology as they explains the strength and permeability of rocks and soils. Eutric Regosols showed have the most concentered landslide and positive probability of occurrence.
5. Conclusions
Globally, landslides one of the frequently occurring natural disaster resulting massive loss of natural resources as well as infrastructures and property in mountainous regions. These are triggered naturally by intense rainfall or earthquake. Proper maintenance of updated landslide could be very useful for various purposes. Such inventories could be prepared by field investigation, identification form aerial or satellite images.
In this study, the available landslide mapping geospatial technologies were briefly reviewed along with exploration of available technologies for one of the earthquake struck hilly region of Nepal -Sindhupalchowk was conducted. Field investigation in Sindhupalchowk is very risky, difficult. Thus, use of images from Landsat 8 or Google Earth could be a better option over field investigation for the preparation of landside inventory. The occurrence of landslides in the study areas shows very high correlation with mid-range elevation and steeper slopes in South direction. Similarly, the high correlation of landslide in Eutric Regosols soil type can also be observed.
Acknowledgement
This study was supported by 2015 Research Grant from Kangwon National University (No. 520150512).
References
1. Alfaro, P., Delgado, J., García-Tortosa, F. J., Lenti, L., López, J. A., López-Casado, C. and Martino, S.,
2012, Widespread landslides induced by the Mw 5.1 earthquake of 11 May 2011 in Lorca, SE Spain, Engineering Geology, Vol. 137, pp. 40-52.
2. Althuwaynee, O. F., Pradhan, B. and Lee, S., 2012, Application of an evidential belief function model in landslide susceptibility mapping, Computer & Geosciences, Vol. 44, No. 0, pp. 120-135.
3. Bogardi, J. J., 2006, Introduction, United Nations University Press, New York.
4. Bui, D. T., Ho, T. C., Revhaug, I., Pradhan, B. and Nguyen, D. B., 2014, Landslide susceptibility mapping along the national road 32 of Vietnam using GIS-based J48 decision tree classifier and its ensembles, Cartography from pole to pole, pp.
303-317.
5. Bui, D. T., Tuan, T. A., Klempe, H., Pradhan, B., and Revhaug, I., 2016, Spatial prediction models for shallow landslide hazards: a comparative assessment of the efficacy of support vector machines, artificial neural networks, kernel logistic regression, and logistic model tree, Landslides, Vol. 13, No. 2, pp.
361-378.
6. Crozier, M. J., 1986, Landslides: causes, consequences & environment, Croom Helm Ltd, London and Sydney.
7. Cruden, D. M., 1993, The multilingual landslide glossary, The International Geotechnical Societies UNESCO Working Party for World Landslide Inventory, Vol. 5.
8. Dai, F. C., Xu, C., Yao, X., Xu, L., Tu, X. B. and Gong, Q. M., 2011, Spatial distribution of landslides triggered by the 2008 Ms 8.0 Wenchuan earthquake, China, Journal of Asian Earth Sciences, Vol. 40, No. 4, pp. 883-895.
9. Dunning, S. A., Mitchell, W.A., Rosser, N. J. and Petley, D. N., 2007, The Hattian Bala rock avalanche and associated landslides triggered by the Kashmir Earthquake of 8 October 2005, Engineering Geology, Vol. 93, No. 3–4, pp. 130-144.
10. Ercanoglu, M., Kasmer, O. and Temiz, N., 2008, Adaptation and comparison of expert opinion to analytical hierarchy process for landslide susceptibility mapping, Bulletin of Engineering Geology and the Environment, Vol. 67, No. 4, pp. 565-578.
11. Galli, M., Ardizzone, F., Cardinali, M., Guzzetti, F.
and Reichenbach, P., 2008, Comparing landslide
inventory maps, Geomorphology, Vol. 94, No. 3–4,
pp. 268-289.
Sindhupalchowk, Nepal 105