http://dx.doi.org/10.7585/kjps.2013.17.1.65
Open Access
65
Evaluation of QuEChERS Method for Determination of pesticide Residues Using GC/NPD and GC/ECD
Tae Hee Cho*, Young Hye Park, Hye Won Park, Lae Hwong Hwang, In Soon Cho, Min Jung Kim, Hyun Jeong Kim, Mu Sang Kim and Young Zoo Chae
Kangnam Agro-Fishery Products Inspection Center,
Seoul Metropolitan Goverment Research Institute of Public Health and Environment, Seoul 138-701, Korea (Received on November 22, 2012. Revised on January 7, 2013. Accepted on February 1, 2013)
Abstract The modified QuEChERS method was evaluated for rapid determination of pesticide residues in spinach by gas chromatography-nitrogen phosphorous detector (NPD) and electron capture detector (ECD).
Fifty GC-amenable pesticides which were most frequently detected in monitoring were selected in the current study. Matrix-matched calibration was performed. The detector response for all pesticides was linear with determination coefficients higher than 0.995. LODs for most compounds ranged between 0.001 and 0.1 ug/g, and about 90% of the compounds had LODs of less than 0.05 ug/g. LOQs ranged from 0.001 to 0.32 ug/g, which were well below the MRLs permitted for most of pesticides. In the majority of cases, the recoveries (80-120%) and relative standard deviations (RSDs) (less than 20%) were within acceptable levels except for dichlorvos, propamocarb, chlorothalonil, dichlofluanid, cyhalothrin and fenvalerate. Also, this method which is applied to routine samples showed good results when comparing with traditional multi-residue method.
Key words GC-ECD, GC-NPD, Pesticide residues, QuEChERS
Introduction
Nowadays, analysis technology has sought strategies of being eco-friendly and easy to operate. QuEChERS, introduced by USDA scientists in 2003, meet the demands. The QuEChERS, which stands for quick, easy, cheap, effective, rugged, and safe, provided satisfactory results for the wide range of pesticids and the practical benefits desired by all laboratories (Anastassiades et al., 2003). Also, modifications of original method were validated successfully in analysis of over 200 pesticides and standardized as AOAC Official Method 2007.01 and European committee for standardization (CEN) standard method EN15662 (Lehotay et al., 2005).
QuEChERs method is very flexible and can be easily modified depending on the analyte properties, matrix composition of sample and analysis equipments (Lehotay et al., 2010). Due to such advantages, QuEChERS method has already applied to the determination of polycyclic aromatic hydrocarbons in fish, acrylamide and mycotoxin in food, drugs in blood and so on (Wilkowska et al., 2011). Three main steps of
QuEChERS procedure involve extraction with acetonitrile followed by liquid-liquid partitioning formed by addition of anhydrous Magnesium Sulfate (MgSO
4) plus Sodium Chloride (NaCl), dispersive SPE clean-up with anhydrous MgSO
4and primary secondary amine (PSA), and analysis by GC/MS and LC/MS/MS (Anastassiades et al., 2003). QuEChERS method is very attractive tool. However, acetonitrile as final solvent is not suitable for GC selective detector like NPD (Anastassiades et al., 2003). And also QuEChERS does not entail concentration step to achieve the desired limits of quanti- fication prior to instrument analysis. Although conventional multi-residue methods are criticized for multiple steps, time consuming and use of high amounts of solvent, many analysts have accustomed to these procedures for a long time and also it is not easy to furnish labs with costly analytical equipments.
Therefore, in this study, QuEChERS method was modified to apply to conventional operating systems and the possibility as multi-residues method was examined in comparison with the traditional multi-residue method.
Material and Methods
Reagents and chemicals
Pesticide standards with a purity higher than 97% were
*Corresponding author
Tel: +82-2-3401-6292, Fax: +82-2-3401-6742 E-mail: [email protected]
SHORT COMMUNICATIONS
obtained from Dr. Ehrenstorfer GmbH (Augsburg, Germany), Riedel-de Haën (Seelze, Germany) and Wako (Tokyo, Japan).
Stock standard solutions at 200 ug/mL were prepared in various solvents and were stored in the dark at 4
oC. Working standard pesticide mixtures were prepared freshly by dilution in the matrix-blank extract. All organic solvents were pesticide grade or HPLC grade and purchased from J.T. Baker, USA. 500 mg Sep-Pak Florisil cartridge were purchased from Agilent Technologies. Anhydrous MgSO
4and NaCl were obtained from Aldrich (Milwaukee, WI, USA). Primary secondary amine (PSA) sorbent was obtained from Varian (Harbor City, CA, USA).
Sample preparation
Sample preparation for conventional multi-residue method Chopped sample (50 g) was extracted with 100 mL acet- onitrile for 2 min at high speed with a homogenizer and filtered into a 150 mL glass bottle with a cap containing 10-15 g sodium chloride. The extract was vigorously shaken and allowed to stand for 30 min. Two 10 mL upper phases were transferred into each of two 100 mL beakers and evaporated to dryness in a steam bath at 60
oC with a gentle stream of air. The first dried acetonitrile extract was dissolved in 2 mL acetone and then filtered through a 0.2 mm nylon acro-disc for gas chromatography-nitrogen phosphorous detector (GC-NPD). The second residue was dissolved in 2 mL 20% acetone/hexane and loaded onto a 500 mg Sep-Pak Florisil cartridge, which was precon- ditioned with 5 mL hexane, followed by washing with 5 mL 20% acetone in hexane. The cartridge was eluted with 5 mL 20% acetone/hexane twice. The elution was evaporated at 60
oC and dissolved in 2 mL 20% acetone in hexane for gas chromatography-electron capture detector (GC-ECD).
Sample preparation for QuEChERS multi-residue method In this study, sample preparation was carried out based on original QuEChERS method (Anastassiades et al., 2003).
Chopped sample (10 g) was weighed into 50 mL Teflon centrifuge tube and 10 mL acetonitrile was added. The
centrifuge tube was vigorously shaken for 1 min by using Vortex mixer. 4 g anhydrous MgSO
4and 1 g NaCl were further added and shaken immediately for 1 min on a Vortex mixer. The extract was centrifuged for 5 min at 3500 rpm. 6 mL upper acetonitrile layer was transferred to 15 mL centrifuge tube containing 300 mg PSA and 900 mg anhydrous MgSO
4. The centrifuge tube was capped tightly, shaken for 30 s by hand and centrifuged for 5 min at 3500 rpm. 2 mL supernatant was evaporated to dryness in a steam bath at 50
oC with a gentle stream of air and the residue was dissolved in 1 mL 20% acetone/hexane for GC/
NPD, GC/ECD analysis.
Instrument analysis
Analysis was performed with the multi-residue method (MRM) No. 2 for pesticide residues according to the Korea Food Code, which is based on MRM of the California Department of Food and Agriculture (CDFA) (Lee et al., 1991).
The GC-NPD system for organophosphrous and nitrogen- containing compounds and the GC-ECD system for organo- chlorine and pyrethroid compounds were used. Agilent 6890 series gas chromatographs equipped with a nitrogen phosphorous detector (NPD) and a 63Ni electron capture detector (ECD) were employed. The chromatographic separation was performed on an HP-1701 and an HP-5 (Agilent Technologies). Confirmation of residues in field samples was carried out by an Agilent 6890 series gas chromatograph equipped with an HP 5973 mass selective detector. The mass spectrometer was operated in electron-impact ionization mode (ionizing energy = 70 eV) scanning from m/z 80 to 400 at 4.45 scan/s. The ion source and quadrupole temperatures were 230 and 150
oC, respectively. The operating conditions for GC and GC-MS are summarized in Table 1.
Quantification
Calculations were based on the matrix-matched and the standards method. The calibration standards were made from a 2 mg/mL stock solution. Quantification was carried out using peak area. The results were expressed in ug/g (parts per million).
Table 1. Analytical conditions of GC-ECD, GC-NPD and GC-MSD
GC-ECD GC-NPD GC-MSD
Column HP-1701 (30 m × 320 µm × 0.25 µm)
HP-5 (30 m × 320 µm × 0.25 µm) HP-1701 (30 m × 320 × 0.25)
HP-5 (30m × 320 × 0.25) HP-5MS (30 m × 250 µm × 0.25 µm) Gas Flow N
2(1 mL/min)
N
2(1.4 mL/min) Air (60 mL/min) H
2(3.5 mL/min)
He (1 mL/min)
Inj. Temp. 230
oC 210
oC 230
oC
Det. Temp. 280
oC 270
oC 280
oC (Interface Temp.)
Oven Temp.
150
oC (1 min)-12
oC/min- 240
oC (2 min)-10
oC/min-
280
oC (11 min)
100
oC (1 min)-15
oC/min- 200
oC (8 min)-10
oC/min-
260
oC (7 min)
100
oC (2 min)-10
oC/min-
280
oC (15 min)
Results and Discussion
Validation of QuEChERS method
Pesticide residue monitoring program has been operating for 285 pesticides in our lab under government control.
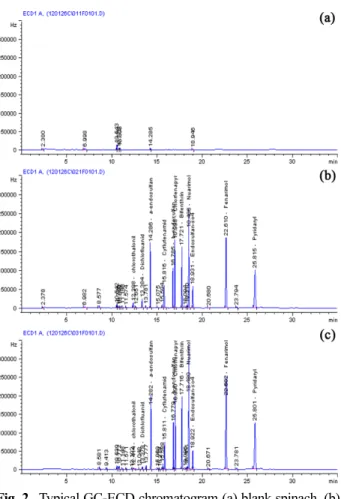
Among them, fifty GC-amenable pesticides which were most frequently detected in previous monitoring were selected in the current study (Cho et al., 2009). Validation was performed by using pesticide-free spinach. Spinach is a representative leafy vegetable with highly pigmented matrix like a chl- oryophyll. External matrix-matched calibration was carried out to exclude matrix effects. Fig. 1 and 2 show representative chromatogram for blank, matrix-matched standards, and spiked standards in spinach. The detector response for all pesticides was linear at concentrations within the tested interval with determination coefficients higher than 0.995.
The limit of detection (LOD) and limit of quantification (LOQ) were determined at signal-to-noise ratios of 3 and 10, respectively. Table 2 and 3 show the LOD and LOQ values of QuEChERS method obtained for each pesticides.
LODs for most compounds ranged between 0.001 and 0.1 ug/g, and about 90% of the compounds had LODs of less
than 0.05 ug/g. LOQs ranged from 0.001 to 0.32 ug/g.
LOQs for most of the pesticides were under Korean MRLs, but some pesticides need the concentration to reach into allowable MRLs. Modified method, through concentration step, seems to achieve desirable quantitation limit without large volume injection (LVI) system.(Gilbert-Lópeza, 2010) The recovery and reproducibility were evaluated by spiking at two levels of each pesticides. As shown in Table 2 and 3, in the majority of cases, the recoveries (80-120%) and relative standard deviations (RSDs) (less than 20%) were within acceptable levels except for some pesticides.
Comparison of QuEChERS method Verse conventional multi-residue method
In preliminary test of several agricultural products, the original method showed similar recoveries with other methods such as AOAC and EN methods in most of pesticides.
Therefore, in this study, modification based on original QuEChERS method was reviewed in comparing with traditional MRM. Traditional multi-residue method (MRM) was performed with Korea Food Code MRM No. II. The QuEChERS method was modified in order to be compatible
Fig. 1. Typical GC-NPD chromatogram (a) blank spinach, (b) matrix-matched standards, and (c) spiked standards in spinach.
Levels of pesticide mixtures were prepared ranging from 0.14 to 7.74 ug/g based on the GC signal. Spiking levels were shown in Table 2.
Fig. 2. Typical GC-ECD chromatogram (a) blank spinach, (b) matrix-matched standards, and (c) spiked standards in spinach.
Levels of pesticide mixtures were prepared ranging from 0.3 to
6.66 ug/g based on the GC signal. Spiking levels were shown in
Table 3.
with a GC-NPD and a GC-ECD. The QuEChERS method involved extraction with acetonitrile, partitioning by salt and clean-up step with dispersive SPE. Target compounds were extracted only by vortex mixing. QuEChERS sample preparation was achieved only in about 30 minute for ten samples by an analyst when compared with traditional multi-residue method which need over 2 hours. Also, reducing the use of solvents by 1/10 in QuEChERS contribute to economic benefits as well as environmental conservation. However, QuEChERS has limitation of clean- up by only dSPE. As mentioned above, most of pesticides in QuEChERS method gave excellent recoveries (80~120%).
However, propamocarb, dichlorvos, chlorothalonil, and dichlofluanid gave low recoveries, (< 75%), whereas fenvalerate and cyhalothrin gave high recoveries (> 140%).
In general, polar non-volatile pesticides like a Propamocarb result in poor reproducibility, due to erratic degradation of the analyte in the GC injector (Hiemstra et al., 2002). Thus, propamocarb is moresuitable for LC application and also
propamocarb is rapidly degraded not only in sample but also in standard (Lesueur et al., 2008). Dichlorvous is the most volatile pesticide which seems to be lost during solvent evaporation (Lethoy, 2007). Even though its low recovery make a significant difference with Anastassiades’s data (98% in lettuce) without evaporation step, it is better than the traditional MRM (Anastassiades et al., 2003). As mentioned in numerous articles, pesticides are more stable at lower pH. Aalkaline-sensitive pesticides such as chlorothalonil and dichlofluanid degraded rapidly as pH increase. Just like results of the other papers, they showed poor recoveries. Nevertheless, they had higher recovery rates in comparing with the traditional MRM. Meanwhile, fenvalerate gave > 140% and cyhalothrin gave > 200% high recovery. These results are thought to be caused by signal enhancement of instruments with combination target compound and matrix. However, recovery of cyhalothrin showed consider- able difference with results of Park in cooked foodstuffs (Park et al., 2011). Nevertheless, pesticides above mentioned Table 2. Recovery results of spiked pesticides in spinach from 2 versons of multi-residue method with GC-NPD
Pesticide
Spiked level (ug/g)
Recovery %(RSD %) Spiked level (ug/g)
Recovery %(RSD %) QuEChERS LOD (ug/g)
QuEChERS LOQ (ug/g) QuEChERS Traditional
MRM QuEChERS Traditional
MRM
Chlorpyrifos 1.22 105.0(3.5) 92.1(5.1) 0.30 84.7(6.0) 93.9(3.0) 0.009 0.029 Chlorpyrifos-methyl 1.42 90.9(5.6) 103.1(7.2) 0.36 82.0(4.6) 78.1(4.5) 0.006 0.020 Diazinon 1.31 107.1(4.2) 84.0(3.4) 0.33 86.1(5.4) 89.3(2.8) 0.007 0.023 Dichlorvos 2.70 72.5(13.4) 13.1(15.1) 0.67 48.7(13.2) 48.0(7.5) 0.037 0.123 Diethofencarb 6.24 102.5(5.9) 101.1(6.2) 1.56 104.2(8.9) 82.0(10.4) 0.062 0.208 EPN 2.66 104.0(2.6) 94.1(9.4) 0.66 92.5(6.1) 93.3(4.5) 0.019 0.064 Ethoprophos 1.59 110.1(1.6) 83.8(6.6) 0.40 98.5(4.2) 90.8(3.2) 0.006 0.020 Fenitrothion 2.00 108(6.7) 93.7(2.3) 0.50 89.8(1.9) 88.8(5.1) 0.009 0.030 Fenobucarb 3.12 90.3(4.8) 105.4(2.1) 0.78 97.7(4.8) 85.0(2.7) 0.022 0.073 Fludioxonil 4.52 106.3(3.1) 98.2(2.7) 1.13 106.3(5.1) 79.7(6.1) 0.044 0.145