INTRODUCTION
Algal blooms, particularly from cyanobacteria, are common phenomena in eutrophic lakes and ponds all over the world. Accordingly, the phys- iology and ecology of cyanobacteria have been extensively investigated due to their induction of serious environmental problems, such as a de- creased recreational value, increased cost of water treatment, and the production of toxic and mal- odorous compounds (Falconer, 1994). The pre- dominance of cyanobacteria over other algal spe- cies is attributed to their competitively advanta- geous characteristics: vertical migration (Rey- nolds, 1987), excessive accumulation of nutrients (Watson et al., 1997), and defiance against zoo- plankton grazing (Porter, 1977).
Environmental factors also influence the peri-
od and severity of cyanobacterial blooms. In par- ticular, large and small-scale meteorological conditions both determine the composition and succession of the plankton community. For exam- ple, the North Atlantic Oscillation (NAO) was recently found to drive the changes of weather patterns and plankton dynamics in Europe (Straile and Adrian, 2000). The NAO is a global oscillation of the atmospheric mass between the North Atlantic regions of subtropical high surface pressure and subpolar low surface pressure. A strong connection between water temperature, the aquatic food-web, and the NAO has already been established (Straile, 2000). In a small-scale meteorology, previous studies have demonstrat- ed that the phytoplankton composition varied depending on the amount of summer precipitation in the Daechung Reservoir, which is under the influence of the Asian monsoon (An and Jones,
─
─ 413 ──
Influence of Rainfall on Cyanobacterial Bloom in Daechung Reservoir
Ahn, Chi-Yong, Hee-Sik Kim, Byung-Dae Yoon and Hee-Mock Oh*
(Environmental Biotechnology Laboratory, Korea Research Institute of Bioscience and Biotechnology, Daejeon 305-333, Korea)
The water quality and algal communities in the Daechung Reservoir, Korea, were monitored from summer to autumn in 1999 and 2001. Although the average weekly precipitations during June and July were very similar in 1999 and 2001, they were much different during August and September, the so-called blooming season. The rainfall in 1999 increased about 70% after late August, whereas it decreased to the one-fifth level in 2001. The higher concentrations of chlorophyll-a, phycocyanin, and cyanobacteria were observed in 2001, which resulted in the dense algal bloom.
In addition, in 2001, the cyanobacterial percentage remained above 80% during the investigation period, and the cyanobacteria were exclusively composed of Microcystis spp. Conversely, there was no report on the algal bloom in 1999. However, the peak bloom seasons were the same for both years, from late August to early September, irrespective of the amount of precipitation. These results suggest that the magni- tude and duration of rainfall before bloom season are important factors determining the extent of cyanobacterial bloom in this system.
Key words : Asian monsoon, bloom, cyanobacteria, Daechung Reservoir, rainfall
* Corresponding Author: Tel: 042) 860-4321, Fax: 042) 860-4594, E-mail: [email protected]
2000). In 1993, diatoms dominated the Daechung Reservoir as a result of a strong monsoon, where- as cyanobacteria comprised over 80% of the total algal numbers with a weak monsoon in 1994.
Therefore, the current study compared the algal compositions in 1999 and 2001, as the rain- fall patterns were quite different between the two years. In 1999, the total precipitation was within the average range, yet in 2001, it was lowest since the dam construction in 1980. Since the Korean government established “the alert system for algal bloom” in 1997, “outbreak”, the highest state of the alert system, was first and uniquely declared in the Hoenam region of the Daechung Reservoir for 7 days in 2001, the year with the lowest precipitation. Meanwhile, even the lowest phase of the algal alert system was never declared in 1999. Thus, the current study was to evaluate the influence of rainfall on algal composition and water quality.
MATERIALS AND METHODS
Sampling
The Daechung Reservoir, located in the middle stream of the Geum River (36�50′N, 127�50′E), is a large branch-type lake that is influenced by the Asian monsoon. From June to October in 1999 and 2001, water samples were collected at weekly intervals from the surface water within 1 m. The sampling was performed from a floating wharf, 30 m offshore, near the Daechung Dam.
The water temperature, pH, conductivity, and dissolved oxygen (DO) were also measured at the site using YSI meters (63/100 and 95/100 FT, YSI Inc., Yellow Springs, OH). All other chemical and biological measurements were conducted in the laboratory, after transfer on ice.
Water analyses
The chlorophyll-a (Chl-a) was extracted using a chloroform-methanol mixture (2 : 1, v/v) and measured with a fluorometer (Turner 450, Barn- stead/Thermolyne, Dubuque, IA) (Wood, 1985).
The phycocyanin was measured using a spectro- photometer (UV-160A, Shimadzu, Kyoto, Japan) after extraction with 80% acetone and resuspen- sion in a 0.2 M sodium acetate buffer (Myers et
al., 1978).The algal cell numbers were counted using a
Fuchs-Rosenthal counting chamber (Paul Ma- rienfeld GmbH & Co., Lauda-Königshofen, Ger- many) under an optical microscope (Microphot- FXA, Nikon Corp., Tokyo, Japan). The data for precipitation and daily sunshine duration were obtained from the Korea Meteorological Admin- istration.
RESULTS
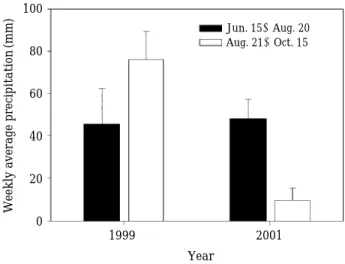
The most striking difference among the envi- ronmental conditions was the rainfall between 1999 and 2001. The total precipitation in 1999 was 1,455 mm, which was within the annual average range for the Daechung Reservoir. How- ever, the total precipitation in 2001 was only 835 mm, the lowest value since the construction of the Daechung Dam in 1980. In particular, the difference was more critical during the investiga- tion period (Fig. 1). Before August 20, the weekly average precipitation for 1999 and 2001 was sim- ilar (P = 0.879), yet after August 21 it became quite different (P = 0.00046). In 1999, the rainfall increased after August 21, whereas in 2001, it decreased significantly. In September of 1999, the precipitation was 2.3 times greater than the September average for the previous 22 years. In contrast, the precipitation in September of 2001 was only 1/6 of the average.
These contrasting patterns of precipitation were also reflected in the daily sunshine duration
Fig. 1. Weekly precipitation patterns for 1999 and 2001.
The period before and after August 21 indicate pre-bloom and post-bloom seasons, respectively.
Error bars represent standard errors.
1999 2001
Year 100
80
60
40
20
0
Jun. 15~Aug. 20 Aug. 21~Oct. 15
Weekly average precipitation(mm)
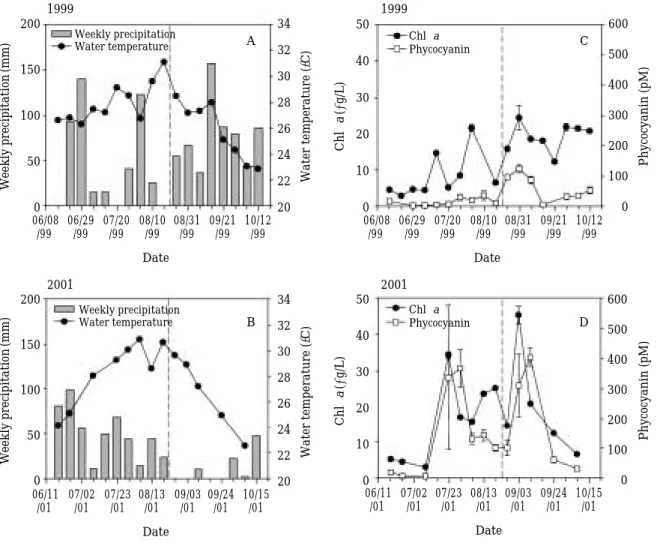
(Fig. 2). From June to September in 1999, the sunshine duration decreased continuously with minor fluctuations. However, during the same period in 2001, the duration increased and re- mained relatively high for about 40 days from late August to September. As such, the low pre- cipitation and high sunshine duration in the late summer of 2001 provided one of the most favor- able environmental conditions for cyanobacterial growth. Conversely, the environmental condi- tions were more unfavorable for cyanobacterial growth in 1999, with the passage of the bloom season in late August.
Meanwhile, the changes in the water tempera- ture were not so different, in spite of the com- pletely different rainfall patterns (Fig. 3). The water temperature peaked in mid-August in both years. In addition, the pH, dissolved oxy-
Fig. 2. Sunshine duration for 1999 and 2001. The aver- ages of ten days for the daily duration are present- ed. Error bars represent standard errors.
Fig. 3. Weekly precipitation and water temperature in 1999 (A) and 2001 (B), and concentrations of chlorophyll-a and phy- cocyanin in 1999 (C) and 2001 (D). The vertical dashed lines indicate the boundary between pre-bloom and post- bloom.
Jun. Jul. Aug. Sep. Oct.
Month 12
10
8
6
4
2
0
1999 2001
Average sunshine duration(hr)
200
150
100
50
0
Weekly precipitation
Water temperature Chl-a
Phycocyanin
Chl-a Phycocyanin Weekly precipitation
Water temperature
A
B
C
D 200
150
100
50
0
34 32 30 28 26 24 22 20
34 32 30 28 26 24 22 20
600 500 400 300 200 100 0
600 500 400 300 200 100 0 50
40
30
20
10
0
50
40
30
20
10
0 06/08 06/29 07/20 08/10 08/31 09/21 10/12
/99 /99 /99 /99 /99 /99 /99 Date
06/11 07/02 07/23 08/13 09/03 09/24 10/15 /01 /01 /01 /01 /01 /01 /01
Date
06/11 07/02 07/23 08/13 09/03 09/24 10/15 /01 /01 /01 /01 /01 /01 /01
Date
06/08 06/29 07/20 08/10 08/31 09/21 10/12 /99 /99 /99 /99 /99 /99 /99
Date
Weekly precipitation(mm)Weekly precipitation(mm) Chl-a(µg/L)Chl-a(µg/L) Phycocyanin (pM)Phycocyanin (pM)
Water temperature (�C)Water temperature (�C)
1999 1999
2001 2001
gen, and conductivity also reached their peaks about the middle of August and decreased there- after (data not shown). The peaks for Chl-a, phy- cocyanin, and the cyanobacterial cell density overlapped on August 31, 1999 (Figs. 3 and 4), while in 2001 their peaks were on September 3, except for phycocyanin (September 10). Although the amounts of precipitation after August 21 were totally different between the two years, the general pattern of cyanobacterial blooms from late August to early September was common for both years.
Since the establishment of “the alert system for algal bloom” in 1997 in Korea, which can declare 3 levels of alert according to predetermined crite- ria (Table 1), the Chl-a and cyanobacterial cell numbers have never exceeded the alert criteria in 1999, yet an “outbreak” level of cyanobacterial
bloom was declared in 2001 (Table 2). However, due to the use of different sampling sites, there are discrepancies in the measured concentrations of Chl-a and cyanobacteria between the current study and the alert system.
The concentrations of Chl-a and phycocyanin were much higher in 2001 and their peaks more outstanding compared to those in 1999. How- ever, the Chl-a concentration in 1999 remained
Fig. 4. Cyanobacterial cell number and percentage in 1999 (A) and 2001 (B), with two most dominant species in 1999 and 2001 shown in (C) and (D), respectively. The vertical dashed lines indicate the boundary between pre-bloom and post-bloom.
Table 1. Three levels of “the alert system for algal bloom”
in Korea
Level Chlorophyll-a Cyanobacteria Monitoring (µg/L) (cells/ml) interval (/week)
I. Caution ›15 ›500 1
II. Warning ›25 ›5,000 2
III. Outbreak ›100 ›1,000,000 2
106
105
104
103
102
101
cells/ml percentage
Microcystis Anabaena
Microcystis Oscillatoria cells/ml
percentage 100
80
60
40
20
0
100
80
60
40
20
0 106
105
104
103
102
101
106
105
104
103
102
101
106
105 104
103
102
101
Cyanobacteria(cells/ml) Cyanobacteria(%)Cyanobacteria(%)
Cyanobacteria(cells/ml) Cyanobacteria(cells/ml)Cyanobacteria(cells/ml)
06/08 06/29 07/20 08/10 08/31 09/21 10/12 /99 /99 /99 /99 /99 /99 /99
Date
06/08 06/29 07/20 08/10 08/31 09/21 10/12 /99 /99 /99 /99 /99 /99 /99
Date
06/11 07/02 07/23 08/13 09/03 09/24 10/15 /01 /01 /01 /01 /01 /01 /01
Date
06/11 07/02 07/23 08/13 09/03 09/24 10/15 /01 /01 /01 /01 /01 /01 /01
Date
1999 1999
2001 2001
A C
B D
relatively high even after late September, plus the phycocyanin concentration also increased during the same period, even though it was low.
In contrast, these concentrations decreased ab- ruptly in September of 2001.
The cyanobacterial cell density and percentage were greater in 2001 (Fig. 4). In particular, the cyanobacterial percentage remained above 80%
throughout the entire period of sampling in 2001.
However, greater fluctuation was observed in 1999 with a peak on August 31. In 1999, Anabae-
na spiroides and Microcystis incerta comprisedabout 74% and 20% of the cyanobacteria at the bloom peak, respectively. Meanwhile, Microcystis
aeruginosa preeminently dominated in 2001,with Oscillatoria spp. occupying a minor propor- tion. Therefore, although there was no difference in the cyanobacterial dominance, the major spe- cies and relative abundance did vary, depending on the climatic conditions.
DISCUSSION
In 1997, Korea adopted “the alert system for algal bloom” to ensure the safety of drinking water. As such, if the Chl-a concentration and cyanobacterial cell number exceed certain prede- termined criteria, three levels of alert can be declared according to the extent of cyanobacteri- al growth (Table 1). In the case of an alert, sam- pling frequency is increased for water quality conservation. Moreover, a variety of countermea-
sures are also executed to remove overgrown algae and prevent further bloom formation.
No algal bloom alert was announced in 1999.
However, an “outbreak”, the highest level of alert, was announced for the first time in 2001 (Table 2). Even though the cyanobacterial bloom was intense, the outbreak of severe cyanobacterial bloom was confined to the Hoenam region, the central part of the Reservoir, and not widely spread. However, in the current study, the mea- sured Chl-a concentration and cyanobacterial cell number remained below the “outbreak” crite- ria (Figs. 3 and 4), as the sampling site was about 20 km downstream of the Hoenam region.
The extreme difference in cyanobacterial blooms for 1999 and 2001 has mainly been attributed to the amount and time of precipitation.
An and Jones (2000) suggested that the inten- sity of the Asian monsoon could determine the magnitude, frequency, and composition of algal blooms. They compared seasonal patterns of tax- onomic composition and size structure in algal communities between 1993 and 1994. The major differences in precipitation and sunshine dura- tion between 1993 and 1994 were from June to August, when the mean monthly precipitation was 294.1 and 122.1 mm, respectively, and the mean sunshine duration was 4.6 and 8.1 hr, res- pectively. These differences in the intensities of the Asian monsoon resulted in contrasting algal compositions for the two years.
Oh and Kim (1995) reported the importance of precipitation in the formation of cyanobacterial bloom in the Daechung Reservoir. The Chl-a content was affected by the time of precipitation that might bring a lot of phosphorus from the catchment area (An, 2000). The cyanobacterial bloom appeared about 5 days after a heavy rain at Dam site.
The primary differences in precipitation and sunshine duration between 1999 and 2001 lasted from August to September. The difference in pre- cipitation during this period was more critical, as the mean monthly rainfall in 1999 was 281.3 mm, whereas in 2001 it was only 51.7 mm. The sunshine duration for 1999 and 2001 was 5.1 and 7.0 hr, respectively. The climatic pattern in 1993 was very similar to that in 1999. The weak mon- soon in 1994 was also similar to that in 2001.
Yet, despite such similarities, there were also important dissimilarities. The interannual differ- ences in the environmental factors in 1993 and
Table 2. Long-term report of “the alert system for algal bloom”
Year Level
Region Caution Warning Outbreak
1997 Aug. 26-Nov. 29 - - -
(96 days)
1998 Sep. 9-Oct. 9 - - -
(31 days)
1999 - - - -
2000 Oct. 4-Oct. 31 Aug. 10-Aug. 27 - - (28 days) (18 days)
2001 Sep. 1-Oct. 5 Jul. 14-Aug. 3 Aug. 4-Aug. 10 Hoenam (35 days) (21 days) (7 days)
Aug. 11-Aug. 31 (21 days)
2002 Sep. 19-Oct. 4 - - Munui
(16 days)
*The bloom in the Daechung Reservoir was discriminated into 3 regions, Hoenam, Chudong, and Munui, since 2001.
1994 corresponded to the pre-bloom period, while in 1999 and 2001 these differences corresponded to the post-bloom period. Whereas the dispari- ties in the environmental conditions before bloom formation resulted in the dominance of entirely different taxa in 1993 and 1994 (An and Jones, 2000), the different environmental conditions in late summer led to a relatively similar algal com- position, although only in the different degrees of cyanobacterial growth.
Accordingly, from the results of the above 4 years, it can be concluded that the peaks of algal bloom generally occur from late August to early September, regardless of the amount of precipi- tation. Although a large difference in precipita- tion before the bloom season brought about the dominance of quite different taxa, a difference just after the bloom season did not lead to a total- ly different taxonomic composition. Furthermore, a greater rainfall during the blooming season also decreased the cyanobacterial abundance by disturbing favorable environmental conditions for cyanobacterial growth.
ACKNOWLEDGEMENT
This research was supported by a grant from KRIBB Research Initiative Program and the Korean Ministry of Environment.
REFERENCES
An, K.-G. 2000. Monsoon inflow as a major source of
in-lake phosphorus. Kor. J. Limnol. 33: 222-229.
An, K.-G. and J.R. Jones. 2000. Factors regulating bluegreen dominance in a reservoir directly influ- enced by the Asian monsoon. Hydrobiologia 432:
37-48.
Falconer, I.R. 1994. Health problems from exposure to cyanobacteria and proposed safety guidelines for drinking and recreational water. In Codd, G.A., T.M. Jefferies, C.W. Keevil and E. Potter (eds), Detection Methods for Cyanobacterial Toxins. The Royal Society of Chemistry, Cambridge, p. 3-10.
Myers, J., J.R. Graham and R.T. Wang. 1978. On spectral control of pigmentation in Anacystis nidu- lans (Cyanophyceae). J. Phycol. 14: 513-518.
Oh, H.-M. and D.-H. Kim. 1995. Short-term predic- tion of the blue-green algal bloom in Daechung Reservoir. Kor. J. Limnol. 28: 127-135.
Porter, K.G. 1977. The plank-animal interface in freshwater ecosystems. Am. Sci. 65: 159-170.
Reynolds, C.S. 1987. Cyanobacterial water-blooms.
Adv. Bot. Res. 13: 67-143.
Straile, D. 2000. Meteorological forcing of plankton dynamics in a large and deep continental Euro- pean lake. Oecologia 122: 44-50.
Straile, D. and R. Adrian. 2000. The North Atlantic Oscillation and plankton dynamics in two Euro- pean lakes-two variations on a general theme.
Global Change Biol. 6: 663-670.
Watson, S.B., E. McCauley and J.A. Downing. 1997.
Patterns in phytoplankton taxonomic composition across temperate lakes of differing nutrient sta- tus. Limnol. Oceanogr. 42: 487-495.
Wood, L.W. 1985. Chloroform-methanol extraction of chlorophyll a. Can. J. Fish. Aquat. Sci. 42: 38-43.
(Manuscript received 29 September 2003, Revision accepted 30 November 2003)
⁄ ¤
대청호에서 남조류 수화 현상에 대한 강우의 영향
안치용∙김희식∙윤병대∙오희목*
(한국생명공학연구원 환경생명공학연구실, 대전 305-333)
1999년과 2001년, 여름부터 가을까지 대청호의 남조류 수화현상에 대한 강우영향을 조사하였다. 두 해의6, 7월 강수량은 매우 유사하였으나, 수화발생 시기인8, 9월의 강수량은 현저한 차이를 보 였다. 1999년에는8월 하순 이후 그전 2개월에 비해 약 70%의 강수량 증가가 있었으나, 2001년에 는 같은 기간 동안5분의 1 수준으로 감소하였다. 더 높은 엽록소-a, 파이코시아닌, 남조류 농도가 2001년 측정되었으며, 이것은 극심한 수화의 발생으로 이어졌다. 또한 2001년에는 조사기간동안 남조류의 비율이 항상 80%를 상회하였으며, 남조류는Microcystis spp.가 대부분을 차지하였다. 이 와는 반대로 1999년에는 수화의 발생이 보고되지 않았다. 이러한 차이에도 불구하고 수화가 절정 을 이루는 시기는 두 해 모두8월 하순에서 9월 초순으로, 강수량에 관계없이 일정하였다. 수화 이 전 시기의 적당한 강수와 이후의 충분한 일조 시기가 남조류의 수화 형성에 영향을 끼치는 중요인 자들 중의 하나로 판단되었다.