R E S E A R C H Open Access
Effect of short term aerobic exercise on fasting and postprandial lipoprotein subfractions in healthy sedentary men
Peter Sabaka 1 , Peter Kruzliak 2* , David Balaz 1 , Andrea Komornikova 1 , Denisa Celovska 1 , Giovanni Cammarota 3 , Katarina Kusendova 1 , Matej Bendzala 1 , Luis Rodrigo 4 , Andrej Dukat 1 , Taeg Kyu Kwon 5 ,
Magdalena Chottova Dvorakova 6,7 and Ludovit Gaspar 1
Abstract
Background: Our goal was to investigate the effect of short term exercise on fasting and postprandial lipoprotein profile.
Methods: Healthy sedentary men exercised 20 min for four days. The intensity of exercise was modulated to maintain 75 –80 % of a calculated HRmax. Before and after the exercise program, fasting and postprandial (4 h after standard meal) concentrations of lipoprotein subfractions were measured by an electrophoresis in polyacrylamide gel and total concentrations of TAG, LDL and HDL by enzymatic colorimetric method. After 2 days of rest, fasting and postprandial concentrations of lipoprotein fractions and subfractions were measured to determine a persistency of a changes in the lipoprotein profile.
Results: 4 days of physical exercise led to statistically significant decrease of concentration of triacylglycerol in fasting (76.29 ± 20.07, 53.92 ± 10.90, p < 0.05) and postprandial state (139.06 ± 23.72, 96.55 ± 25.21, p < 0.05) VLDL in fasting (21.88 ± 3.87, 18.00 ± 3.93, p < 0.05) and postprandial state (23.88 ± 3.52, 19.25 ± 3.62, p < 0.05), total cholesterol in fasting (162.26 ± 23.38, 148.91 ± 17.72, p < 0.05) and postprandial state (163.73 ± 23.02, 150.08 ± 18.11, p < 0.05). Atherogenic medium LDL decreased also in fasting (9.89 ± 3.27, 6.22 ± 2.55, p < 0.001) and postprandial state (8.88 ± 6.51, 6.88 ± 5.57, p < 0.001). However decrease of large IDL (25.38 ± 3.54, 23.88 ± 3.91, p < 0.05) and large LDL particles (42.89 ± 11.40, 38.67 ± 9.30) was observed only in postprandial state.
Total HDL concentration remained unchanged but we observed statistically significant decrease of small HDL particles in fasting (6.11 ± 2.89, 4.22, p < 0.05) and postprandial state (6.44 ± 3.21, 4.56 ± 1.33, p < 0.05).
Concentration of these particles are associated with progression of atherosclerosis. All changes of fasting and postprandial lipoprotein profile disappeared after 2 days of rest.
Conclusion: Just 4 daily settings of 20 min of physical exercise can lead to significant positive changes of fasting and postprandial lipoprotein profile.
Keywords: Exercise, Lipoprotein profile, Lipoprotein subfractions, Postprandial lipoprotein profile
* Correspondence: [email protected]
2
2nd Department of Internal Medicine, St. Anne ’s University Hospital and Masaryk University, Pekarska 53, 656 91 Brno, Czech Republic
Full list of author information is available at the end of the article
© 2015 Sabaka et al. Open Access This article is distributed under the terms of the Creative Commons Attribution 4.0
International License (http://creativecommons.org/licenses/by/4.0/), which permits unrestricted use, distribution, and
reproduction in any medium, provided you give appropriate credit to the original author(s) and the source, provide a link to
the Creative Commons license, and indicate if changes were made. The Creative Commons Public Domain Dedication waiver
(http://creativecommons.org/publicdomain/zero/1.0/) applies to the data made available in this article, unless otherwise stated.
Introduction
There is a large body of evidence to support the major role of regular physical activity in a cardiovascular pre- vention [1, 2]. Sedentary lifestyle and lack of regular ex- ercise is associated with accumulation of other cardiovascular risk factors such as diabetes, abdominal obesity, dyslipidaemia and arterial hypertension [3].
Physiologic mechanism which mediates these positive ef- fects is not fully understood yet. There is an evidence that physical exercise improves endothelial function [4]
and also increases insulin sensitivity [5, 6]. Possibly im- provement of lipoprotein profile plays significant role too [7–11]. Evidence of positive effects of physical activ- ity on plasma lipoproteins comes mostly from the stud- ies in which just fasting lipoprotein profile changes were observed [7–12]. However, lipoprotein metabolism is in fasting state only for few hours in the morning before the first meal [13]. Therefore, the postprandial lipopro- tein profile may represent better the state of lipoprotein metabolism and may reflect better the lipoprotein car- diovascular risk factors. This theory is supported by the finding that non-fasting triacylglycerolaemia better pre- dict cardiovascular events than fasting TAG concentra- tion [13, 14]. Previous studies found decrease of postprandial TAG and VLDL concentration after short term exercise [15–18]. However, effects of short term aerobic exercise on all lipoprotein subfractions, espe- cially in postprandial state, has not been described in de- tail yet. It is also unclear how fast the physical exercise may induce the significant changes of lipoprotein profile, because exercise training in the studies that measured complex changes of lipoprotein profile lasted usually more weeks [7–13, 19].
Results
All volunteers completed the trial and maintained re- quired intensity during all exercise settings and none of them were excluded due to inability to follow exercise protocol. The mean age of the volunteers was 27.2 ± 1.81 years, BMI 22.0 ± 1.47 kg/m 2 and waist circumference 85.0 ± 5.20 cm. The mean power during exercises was
125.5 ± 17.23 W and exercise intensity 77.5 ± 1.434 % of HR max. Basal TAG, lipoprotein fractions and subfrac- tions concentrations are shown in Tables 1, 2, 3 and 4.
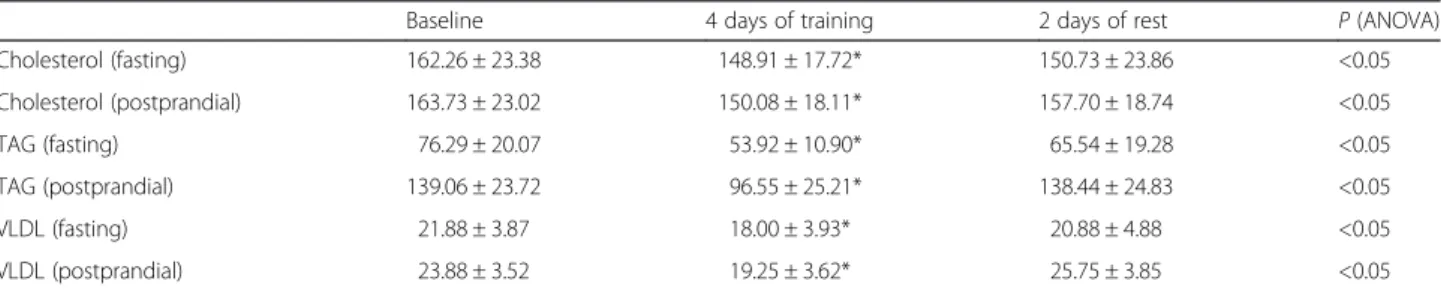
Fasting and postprandial concentrations of total choles- terol decreased significantly after exercise period, however after 2 days of rest the concentrations of cholesterol were not different from the their basal values (Table 1). The concentration of fasting and postprandial TAG levels aslo decreased significantly after 4 days of exercise (Table 1).
However, there was no statistically significant difference in fasting or postprandial triacylglycerolaemia between the concentration before exercise and after 2 days of rest (Table 1).
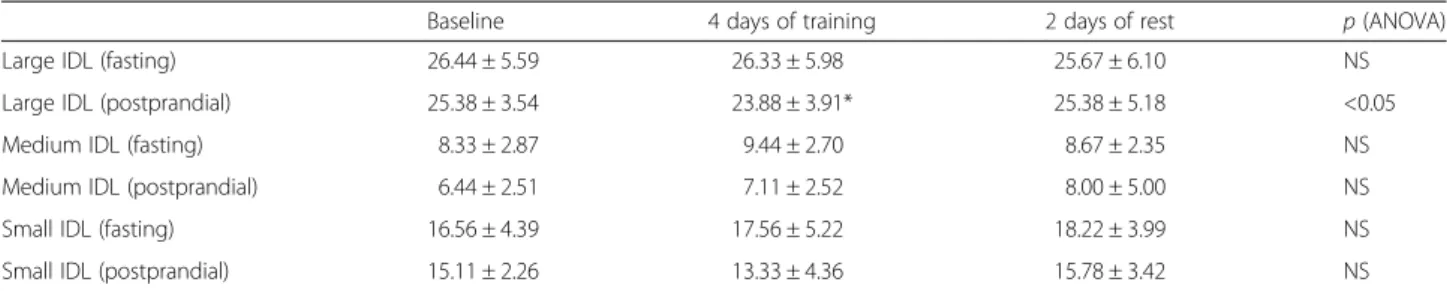
We obtained similar results for fasting and postprandial VLDL (Table 1). Fasting concentration of VLDL-remnants (large IDL particles) did not change, but postprandial con- centration of VLDL-remnants decreased after 4 days of exercise, however, it was not significant (Table 2). This change disappeared after 2 days of rest and there was no significant difference between basal concentration and concentration after resting period (Table 2). We observed no statistically significant changes of mean concentrations of fasting or postprandial concentrations of medium or small IDL particles.
Although, we did not observed statistically significant decrease of total fasting LDL after the exercise period, we revealed significant decrease in postprandial LDL (Table 3). Fasting concentration of large LDL (LDL 1) did not decreased significantly but there was significant reduction in postprandial concentration of LDL 1 (Table 3). The atherogenic medium LDL (LDL 2) de- creased significantly in fasting and postprandial state (Table 3). Only 2 of 10 volunteers had detectable levels of small dense LDL particles (LDL 3–7) in fasting state and none in the postprandial state, so we were unable to observe the changes of concentrations of these particles.
All changes of LDL particle induced by exercise disap- peared after 2 days of rest.
Total concentrations of fasting and postprandial HDL did not change significantly (Table 4), but we observed changes in some HDL subfractions. Fasting and
Table 1 Changes of fasting and postprandial concentrations of cholesterol, TAG and VLDL after 4 days of training and then after 2 days of rest
Baseline 4 days of training 2 days of rest P (ANOVA)
Cholesterol (fasting) 162.26 ± 23.38 148.91 ± 17.72* 150.73 ± 23.86 <0.05
Cholesterol (postprandial) 163.73 ± 23.02 150.08 ± 18.11* 157.70 ± 18.74 <0.05
TAG (fasting) 76.29 ± 20.07 53.92 ± 10.90* 65.54 ± 19.28 <0.05
TAG (postprandial) 139.06 ± 23.72 96.55 ± 25.21* 138.44 ± 24.83 <0.05
VLDL (fasting) 21.88 ± 3.87 18.00 ± 3.93* 20.88 ± 4.88 <0.05
VLDL (postprandial) 23.88 ± 3.52 19.25 ± 3.62* 25.75 ± 3.85 <0.05
TAG triacylglycerol, VLDL very low density lipoprotein, NS non significant, *p < 0.05 – statistical significant difference from the baseline by post hoc test, Parameters
presented as mean values ± standard deviation in mg/dl
postprandial small HDL and postprandial medium HDL particles decreased after exercise period (Table 4).
Changes in HDL subfractions disappeared after 2 days of rest (Table 4).
Discussion
In this study, we documented that the short term exer- cise induces various changes of fasting and postprandial concentration of lipoprotein subfractions in the popula- tion of healthy, sedentary men. These changes represent decrease of known atherogenic subfractions and there- fore can be regarded as benefitial. Previously conducted studies observed some of these changes only in fasting state. However lipoprotein metabolism is in fasting state only few hours in the morning before first meal [13].
The postprandial lipoprotein profile, therefore, may bet- ter reflect the overall lipoprotein cardiovascular risk fac- tors. This conclusion is supported by the evidence that postprandial triacylglycerolemia is better predictor of cardiovascular events than fasting triacylglycerolaemia [12–14]. Postprandial concentration of TAG and various lipoprotein subfractions significantly differs from their fasting concentrations [20]. Previous studies found de- crease of postprandial TAG and VLDL after one setting
of exercise [15–17]. These changes may influence other lipoproteins, since VLDL is precursor of IDL and is also involved in LDL and HDL metabolism [21]. We ob- served changes of postprandial concentrations of various lipoprotein subfractions and some of them has been found only during postprandial measurement (decrease of large IDL, large LDL, medium HDL). Another signifi- cant finding is that just 4 settings of 20 min lasting aer- obic exercise lead to significant changes of lipoprotein profile by decreasing the atherogenic lipoprotein frac- tions and subfractions. That concludes that significant changes of lipoprotein metabolism induced by exercise starts much earlier than previously believed.
TAG, VLDL and IDL
We observed decrease of fasting TAG and VLDL which is consistent with previous findings [6, 8, 10, 11]. Post- prandial triacylglycerolaemia independently predicts car- diovascular events [13, 14]. Decrease of postprandial triaclyglycerolemia is probably caused by increase of lip- olysis, since physical exercise up-regulates activity of muscle lipoprotein lipase (LPL) [6]. Exercise also inhibits VLDL secretion from the liver which is probably due to decrease of amount of available substrate [22]. We Table 2 Changes of fasting and postprandial concentrations of large, medium and small IDL after 4 days of training and then after 2 days of rest
Baseline 4 days of training 2 days of rest p (ANOVA)
Large IDL (fasting) 26.44 ± 5.59 26.33 ± 5.98 25.67 ± 6.10 NS
Large IDL (postprandial) 25.38 ± 3.54 23.88 ± 3.91* 25.38 ± 5.18 <0.05
Medium IDL (fasting) 8.33 ± 2.87 9.44 ± 2.70 8.67 ± 2.35 NS
Medium IDL (postprandial) 6.44 ± 2.51 7.11 ± 2.52 8.00 ± 5.00 NS
Small IDL (fasting) 16.56 ± 4.39 17.56 ± 5.22 18.22 ± 3.99 NS
Small IDL (postprandial) 15.11 ± 2.26 13.33 ± 4.36 15.78 ± 3.42 NS
IDL intermediate density lipoprotein, NS non significant, *p < 0.05 – statistical significant difference from the baseline by post hoc test, Parameters presented as mean values ± standard deviation in mg/dl
Table 3 Changes of fasting and postprandial concentration of LDL and its subfractions (large, medium and small LDL) after 4 days of training and then after 2 days of rest
Baseline 4 days of training 2 days of rest p (ANOVA)
Total LDL (fasting) 114.46 ± 22.40 103.21 ± 17.00 104.99 ± 14.93 0.063
Total LDL (postprandial) 113.73 ± 17.80 103.40 ± 14.40* 106.50 ± 14.51 <0.05
Large LDL (fasting) 41.89 ± 11.81 39.44 ± 10.18 41.11 ± 12.35 NS
Large LDL (postprandial) 42.89 ± 11.40 38.67 ± 9.30* 37.56 ± 7.30 <0.05
Medium LDL (fasting) 9.89 ± 3.27 6.22 ± 2.55* 6.89 ± 2.36 <0.001
Medium LDL (postprandial) 8.88 ± 6.51 6.88 ± 5.57* 7.00 ± 2.73 <0.001
Small LDL (fasting) 0.44 ± 0.29 0.00 ± 0.00 0.33 ± 0.33 NS
aSmall LDL (postprandial) 0.00 ± 0.00 0.00 ± 0.00 0.00 ± 0.00 NS
aa
Results for small dense LDL (LDL 3–7) are not representative because of very small number of volunteers with detectable concentrations of these particles at the baseline
LDL low density lipoprotein, NS non significant, *p < 0.05 – statistical significant difference from the baseline by post hoc test, Parameters presented as mean
values ± standard deviation (or standard error for parameters without normal distribution – medium LDL (fasting), small LDL (fasting and postprandial)) in mg/dl
Total LDL concentration is sum of concentrations of LDL subfractions and medium and small IDL (by Quantimetrics Lipoprint LDL system)
observed decrease of VLDL remnants (large IDL), but only in postprandial conditions. These particles probably possess significant atherogenic potential [23] so their re- duction can be regarded as beneficial.
Cholesterol, LDL and LDL subfractions
Fasting and postprandial concentrations of total choles- terol decreased after 4 days of exercise. Total LDL and concentration of large LDL, like the concentration of VLDL remnants significantly decreased only in post- prandial state, however we found trend to decrease in fasting total LDL concentration (p = 0.063). Previous studies that found decrease of fasting LDL combined physical activity with calorie restriction as a part of com- plex weight loss programme [8, 24]. Study that com- pared effects of calorie restriction and exercise, found reduction of fasting LDL only in the cohort with calorie restriction [9]. Decrease of medium LDL particles (LDL 2) was found in our cohort in both fasting and postpran- dial state. This decrease was more pronounced com- pared to decrease of large LDL. This effect was not previously described, because previous studies did not measure medium LDL separately [8] or found no signifi- cant change in their concentration [9]. Concentration of medium LDL was associated with an increased risk of the premature myocardial infarction [25]. Substantial de- crease of medium LDL might be associated with de- crease of VLDL concentration. Cholesteryl ester transfer protein (CETP) mediates exchange of TAG and choles- terol ester between VLDL and LDL. In case of high VLDL concentration, LDL particles are enriched with triacylglycerol in interaction with VLDL particles. Triac- ylglycerol enriched LDL is substrate for hepatic lipase (HL) which catalyses the hydrolysis of its core and sur- face lipids leading to formation of smaller LDL particles [21]. Therefore, decrease of fasting and postprandial VLDL may lead to increase in mean LDL particle size.
The same mechanism probably leads to decrease of small dense LDL previously observed after the training
of longer duration [8, 9]. We were unable to observe the effect of exercise on small dense LDL (LDL 3–7) because concentration of these particles were below the limit of detection in vast majority of volunteers. That can be ex- plained by selection of volunteers from the population of young, healthy and non-obese adults, because the presence of small dense LDL particles is associated with abdominal obesity, diabetes, hypertriacylglycerolaemia and older age [26, 27].
HDL and HDL subfractions
Many prospective studies reported increase in total HDL cholesterol concentration under condition of regular physical training [7, 8, 10]. In our study, 20 min of aer- obic exercise for 4 days were not sufficient to induce sig- nificant increase of total HDL. In contrary, we found decrease of postprandial medium HDL and fasting and postprandial small HDL particles. Concentration of small HDL particles are positively associated with risk of atherosclerosis progression and also correlates with other cardiovascular risk factors [28–35]. Small HDL as well as small dense LDL correlate with concentration of VLDL [28–35]. Therefore, decrease of fasting and post- prandial VLDL may contribute to decrease small HDL.
Dutheil et al. described similar changes of small and medium HDL after 20 days of complex physical training and diet program [8]. Our findings conclude that changes of HDL subfractions are present already after 4 days of aerobic exercise.
Study limitations
To quantify the intensity of exercise we rather used esti- mated HR max calculated from age using equation by Tanaka et al. (208–0.7 × age) than measure exact VO2max by spiroergometry. Tanaka et al. concluded that HRmax is predicted in healthy subjects, to a large extent, by age alone and is independent of gender and habitual physical activity status. This conclusion is based on findings of large metaanalysis comparing laboratory Table 4 Changes of fasting and postprandial concentration of HDL and its subfractions (large, medium and small HDL) after 4 days of training and then after 2 days of rest
Baseline 4 days of training 2 days of rest p (ANOVA)
Total HDL (fasting) 50.66 ± 10.52 49.65 ± 9.17 49.92 ± 10.63 NS
Total HDL (postprandial) 50.39 ± 10.13 48.76 ± 8.92 49.23 ± 9.21 NS
Large HDL (fasting) 15.50 ± 5.02 15.10 ± 4.51 14.80 ± 5.27 NS
Large HDL (postprandial) 16.56 ± 5.92 16.56 ± 5.53 16.22 ± 5.36 NS
Medium HDL (fasting) 23.70 ± 2.87 23.30 ± 2.41 25.00 ± 3.59 NS
Medium HDL (postprandial) 24.10 ± 3.18 22.80 ± 2.94* 23.70 ± 3.56 <0.05
Small HDL (fasting) 6.11 ± 2.89 4.22 ± 1.72* 5.00 ± 2.69 <0.05
Small HDL (postprandial) 6.44 ± 3.21 4.56 ± 1.33* 6.00 ± 2.06 <0.05
HDL high density lipoprotein, NS non significant, *p < 0.05 – statistical significant difference from the baseline by post hoc test, Parameters presented as mean
values ± standard deviation in mg/dl
obtained and calculated HRmax. Correlation between age and HRmax obtained from the metaanalysis is very high (r = − 0.90) which underlines an accuracy of the es- timated HR max. [30]. We found the use of calculated HRmax fully acceptable, because we did not compare any interindividual differences in exercise intensity de- pendable variables and taking to account high correl- ation between estimated and measured values obtained by other studies [31].
Our study included 10 volunteers so sample size may appear as too low to detect smaller effect sizes. The number of volunteers is based on power analysis we per- formed using variances within groups and variances ex- plained by effect from pilot study of effect of 4, 7 and 14 days of moderate exercise on concentration of plasma lipoprotein subfractions measured by linear electrophor- esis in population of young healthy individuals [36]. We determined effect sizes for all variables that are expected to be affected by exercise according to previous studies by other authors [7–11]. For VLDL the interindividual variance within group, variance explained by effect and effect size was 48.7, 2.56, 0.229; for VLDL remnants 16, 0.9, 0.237; for large LDL 90.25, 1.26, 0.118, for medium LDL 39.7, 2.56, 0.254 and for HDL 72.25, 1.56, 0.136.
Sample size of 10 volunteers appeared to be acceptable with power at least 0.90 for a detection of as low as 5 % change of means of variables. To obtain sufficient power with relatively small effect sizes was allowed by high cor- relation among repeated measurements (from 0.76 for VLDL to 9.1 for large LDL). This is caused mainly by low intraassay variability observed in previous studies [35–39]. Accuracy is comparable to nuclear magnetic resonance spectroscopy which represents a gold stand- ard (CV approximately 4 % for Lipoprint and NMR).
Quantimetrix Lipoprint LDL System is also approved by the U.S. Food and Drug Administration for use in hu- man clinical medicine [40]. We reduced the effect of small sample size using analysis of variance for repeated measures that is more robust than the student T-test or Wilcoxon test. We were encouraged by a fact that other authors successfully conducted research studying the ef- fects of exercise on lipoprotein particles with similar number of volunteers (for example n = 11 in paper by Wooten et al. J Appl Physiol. 2009) [38].
Diet may also influence postprandial lipemia [39].
Wen studding only effect of exercise, to get represent- able results, this influence should be eliminated or at least minimised. Diet of the volunteers during our study was not strictly standardised, because radical change of diet (from their usual diet to standardised diet) might in- fluence their lipoprotein profile. However, we educated the volunteers not to change their standard eating habits and to dine meal with approximately the same calorie and fat content at the day before blood sampling.
We measured postprandial lipoprotein concentration just at one point 4 h after meal. Therefore we were un- able to observe the effect of exercise on lipoprotein changes during all postprandial period. We chose time frame of 4 h because triacylglycerolaemia and VLDL concentration is the highest at this time [15]. There is no standardised and clinically accepted protocol for postprandial lipoproteins measurement. We preferred the use of homogenous yoghurt rather than complex meal in effort to maintain the same dose of nutrients in each portion. The use of complex meal might better imi- tate the common eating habit of the volunteers, but it also might limitate the exact dosing of the fat. The amount of the fat in test meal was chosen to be within the range of fat load used by previous studies [15–17].
Conclusions
Only 4 settings of aerobic exercise (20 min each set- ting) were able to induce significant changes of fast- ing and postprandial lipoprotein profile. We observed statistically significant decrease of concentration of VLDL, medium LDL, medium and small HDL and postprandial concentration of VLDL-remnants and medium HDL. These lipoprotein particles are believed to be associated with progression of atherosclerosis and development of its complications. However, these changes diminish after 2 days of rest.
Methods Participants
We recruited 10 healthy sedentary men aged from 21 to 30 years who signed an informed consent and volunteered on a basis of a public announcement.
The exclusion criteria were smoking, alcohol or drug abuse, known history of diabetes mellitus, malignancy, chronic kidney disease and cardiovascular disease, in- born heart defects, use of hypolipidaemics, corticoste- roids, or any chronic medication. The volunteers with fasting serum glucose concentration above 5.6 mmol/
l, TSH concentration outside the reference range and
glomerular filtration calculated by the CKD-EPI equa-
tion of less than 1.5 ml/s, resting arterial blood pres-
sure above 139/89 mmHg were excluded. The
sedentary lifestyle was defined as a regular high inten-
sity physical activity (running, swimming, cycling) less
than 2 times per week or sustained regular low inten-
sity physical activity (walking) lasting at least 30 min
less than 3 times per week. The volunteers filled a
questionnaire about medical history. Subsequently,
waist circumference, height and weight were mea-
sured and BMI was calculated as weight in kilograms
divided by the square of height in meters.
Oral lipid load test
Blood was sampled after an overnight fast (at least 12 h) by venepuncture from cubital vein using the Vacutainer closed system with serum clot activator to measure fast- ing lipoprotein concentrations. After blood sampling volunteers consumed test meal represented by 420 g of cream yoghurt containing 58.0 g of fat, 53.76 g of carbo- hydrates, 10.5 g of proteins (743.2 kcal, 3108 kJ). Volun- teers were instructed to avoid consuming any food or sweetened drinks and remain at rest until next blood sampling. Second blood sample to measure postprandial lipoprotein concentrations was obtained after 4 h of consuming test meal. Volunteers were educated not to change their eating habits. At the day before each blood sampling, volunteers should dine meal with approxi- mately the same calorie and fat content to minimise pos- sible effects of meal with extremely low or high calorie content on postprandial testing. To do so, they were rec- ommended to use National Nutrient Database for Stand- ard Reference Release of United States Department of Agriculture [41].
Exercise period
The exercise trial started the next day after the first measurement of fasting and postprandial lipoproteins.
The maximal heart rate (HRmax) was calculated using an equation by Tananka et al. [30]. Volunteers exercised on a cycle ergometer (Ergometer 900, GE Medical Sys- tems, General Electric Company, Schenectady, New York). The exercise intensity was modulated by adjusting power to maintain heart rate between 75–80 % of the calculated HRmax. The heart rate during the exercise was monitored using a Polar Sporttester PST (Polar Electro, Kempele, Finland). The volunteers exercised in four following days, each day for 20 min. One day after termination of physical exercise volunteers underwent blood sampling in fasting state and the same protocol with lipid load test was performed. Volunteers were edu- cated not to change eating habits.
Resting period
After completing the exercise phase, volunteers remained at rest for 2 days. They were instructed not to perform a sustained low intensity physical activity for more than 15 min and to avoid high intensity physical activity. Fasting and postprandial lipoprotein concentra- tions were measured the following day after 2 day rest using the same protocol as before.
Sample processing and analysis
After the blood sampling, the samples remained at room temperature for 30 min and subsequently a supernatant was separated by centrifugation for 10 min at 3,000 rpm.
Some part of the supernatant was used for the
determination of serum concentration of glucose, cre- atinine, TSH, total cholesterol, LDL, HDL and TAG.
The second part of the supernatant was frozen at the temperature of −80 °C for analysis of lipoprotein classes and subfractions.
Biochemical analyses
Total cholesterol, LDL, HDL, and TAG concentrations were determined by an enzymatic colorimetric method (Cobas Mira Plus, Roche Diagnostics GmbH, Montclair, NJ, USA). The concentrations of VLDL, IDL, LDL and HDL fractions and subfractions were determined by the linear electrophoresis in polyacrylamide gel (Quantimetrix Lipoprint LDL System and Quantimetrix Lipoprint HDL System, Rendo Beach, USA). Both methods use electro- phoresis in tubes filled with 3 % polyacrylamide gel. 25 μl of serum was mixed with a 200 μl of a solution of the li- quid gel and Sudan black, and added to the gel tube.
Polymerization of the gel followed at room temperature for 30 min. Electrophoresis was performed for 1 h (3 mA/
1 tube) and it was followed by densitometric reading and conversion to concentrations of lipoprotein fractions and subfractions using the Lipoware software (Quantimetrix, Rendo Beach USA). The Quantimetrix Lipoprint LDL Sys- tem divides lipoproteins based on electrophoretic mobility and determinates the concentration of VLDL, large, medium and small IDL particles (large IDL particles cor- responds with VLDL-remnants), large LDL particles (LDL 1), medium LDL particles (LDL 2), and small dense LDL particles (LDL3-7).
The Quantimetrix Lipoprint HDL System method de- termines 10 HDL subfractions divided into large, medium and small HDL.
Statistical methods
The descriptive data were provided as a mean values ± standard deviation of average or standard error (for pa- rameters without normal distribution). The D’Agostino- Pearson test and Kolmogorov-Smirnov test were used to verify the normal distribution of parameters in the co- horts. The normally distributed parameters were consid- ered to be those which have passed the verification in both tests. The means of normal distributed parameters were compared by using one-way analysis of variance with repeated measures (ANOVA), followed by post hoc Tukey test to identify where the differences occurred.
The means of parameters without normal distribution were compared by using Friedman test followed by Dunn’s multiple comparison test to identify where the differences occurred. A difference with the p value of less than 0.05 was considered as statistically significant.
Before starting recruitment we performed power analysis
using variances of each variables and correlation among
repeated measures obtained by our previous pilot study
using the lipoprotein linear electrophoresis method [36].
We determined effect sizes for all variables that are ex- pected to be affected by exercise according to previous studies by other authors [7–11]. Sample size of 10 vol- unteers appeared to be acceptable with power at least 0.90 for each variable. Power analysis was conducted using G*Power 3.1.9.2 for Windows using algorithm for ANOVA with repeated measurements and within factors.
Statement of human and animal rights
All procedures followed were in accordance with the ethical standards of the responsible committee on hu- man experimentation (institutional and national) and with the Helsinki Declaration of 1975, as revised in 2008.
Statement of informed consent
Informed consent was obtained from all patients for be- ing included in the study.
Abbreviations
CETP: Cholesterylester transfer protein; HDL: High-density lipoprotein;
HL: Hepatic lipase; IDL: Intermediate-density lipoprotein; LDL: Low density lipoprotein; CKD-EPI: Chronic Kidney Disease Epidemiology Collaboration;
TAG: Triacylglycerol; TSH: Thyroid stimulating hormone; VLDL: Very-low density lipoprotein.
Competing interests
Authors declare no competing interest.
Authors ’ contributions
LG, PK, PS have participated in study conception and design; PS, DB, AK, DC, KK, MB, LG have been responsible for acquisition of data, analysis and interpretation of data; PS, PK, LG, AD, GC, LR have been involved in drafting the paper; PK, LR, GC, MCD, TKK revised the final draft of manuscript for important intellectual content. All authors read and approved the final manuscript.
Acknowledgements
Author would like to thank all participants who volunteered in the study and a laboratory staff in 2
ndDepartment of Internal Medicine, Comenius University in Bratislava.
Author details
1
2nd Department of Internal Medicine, Comenius University and University Hospital, Bratislava, Slovak Republic.
22nd Department of Internal Medicine, St. Anne ’s University Hospital and Masaryk University, Pekarska 53, 656 91 Brno, Czech Republic.
3Division of Internal Medicine and Gastroenterology, Catholic University of Sacred Heart, A. Gemelli Medical School, Rome, Italy.
4