Renal hemodynamic changes begin early in patients during the course of liver cirrhosis and the hallmark change in such patients is an intense intrarenal vasocon- striction. This vasoconstriction is associated with re- duced renal plasma flow and elevated renal arterial vas-
cular resistance that may precede clinically recognized kidney dysfunction (1-3). Patients with these abnor- malities may be at greater risk for subsequent develop- ment of overt hepatorenal syndrome, which is function- al renal failure that occurs late in cirrhotic patients with advanced liver disease and ascites (4). A common path- way for this derangement appears to be marked splanchnic vasodilatation that induces an important compensatory response that leads to hyperdynamic cir- culation and renal functional abnormalities (5). Renal vasoconstriction and hyperdynamic circulation are the compensatory mechanisms that maintain effective arte-
Renal Hypoperfusion Associated with Splenorenal Shunts in Liver Cirrhosis
1Joo Nam Byun, M.D., Dong Hun Kim, M.D.2, Sung-Gwon Kang, M.D.3
1Department of Radiology, Chosun University Hospital
2Department of Radiology, Soonchunhyang University Bucheon Hospital
3Department of Radiology, Seoul National Bundang Hospital Received January 11, 2008 ; Accepted March 7, 2008
Address reprint requests to : Dong Hun Kim, M.D., Department of Radiology, Soonchunhyang University Bucheon Hospital, 1174 Jung- dong, Wonmi-gu, Gyeonggi-do 420-767, Republic of Korea
Tel. 82-32-621-5851 Fax. 82-32-621-5874 E-mail: dhk1107@hanmail.net
Purpose: To determine whether spontaneous a splenorenal shunt can be used as an imaging predictor of early renal hemodynamic changes in patients with cirrhosis.
Materials and Methods: The study included 82 cirrhotic patients and 41 control sub- jects. Three-phase CT was performed and CT attenuation values (Hounsfield units) of the renal cortex in three phases were measured to evaluate renal perfusion. Likelihood ratio tests for trend were conducted for age, presence of ascites, and Child’s grade.
Results: The mean CT attenuation values of the renal cortex in cirrhotic patients were significantly lower than the values of control subjects in three phases: 153.3 ± 37.9 versus 173.3 ±25.2 in the arterial phase, 172.6 ± 41.0 versus 197.6 ± 26.5 in the por- tal phase and136.9 ± 26.0 versus 152.7 ± 20.0 in the delayed phase, respectively. The mean CT attenuation value of cortices in patients with renal hypoperfusion was 119.9
± 11.8 in the portal phase. Child’s class C (aOR: 58.4, 95% CI: 3.6-956.2; p < 0.01) and the presence of a renal shunt (aOR: 7.5, 95% CI: 1.8-30.5; p < 0.01) were associ- ated with renal hypoperfusion. The incidence of renal hypoperfusion was associated with Child’s grade (trend: p < 0.01), and not with the grade of ascites or age.
Conclusion: A dilated spontaneous splenorenal shunt may be a risk factor for renal hypoperfusion in cirrhosis.
Index words :Abdomen, CT Liver, cirrhosis Shunts, splenorenal
rial blood volume and arterial pressure when splanchnic arterial vasodilation occurs.
In clinical practice, we have identified decreased per- fusion of the renal cortex more frequently in patients with a renal shunt than in patients without a renal shunt. Despite an extensive study of portal hemody- namics in patients with cirrhosis, the interrelationship between the presence of a renal shunt and renal hypop- erfusion (6-8) has not been studied using CT imaging.
As portal inflow is increased due to splanchnic vasodi- latation, portal collateral circulation has an important role in modulating advanced portal hypertension; under these circumstances, the collateral circulation may carry as much as 90% of the blood entering the portal system.
Extensive shunting of portal inflow is commonly associ- ated with the presence of large shunts, more often through the left renal vein than through other collateral routes. Renal shunts (gastrorenal shunts or splenorenal shunts) usually have a short length with a larger diame- ter, similar to surgical shunts. The presence of shunts may explain the lower portal venous pressure in pa- tients with large renal shunts.
We assumed that the presence of a renal shunt seen on a CT image indicated the occurrence of splanchnic arterial vasodilatation that was associated with renal vasoconstriction. For the purpose of this study, renal hy- poperfusion was defined as the mean attenuation value of CT identified renal cortices less two standard devia- tions (SDs) as compared to control subjects and non- azotemic patients with liver cirrhosis in the portal phase. Considering a variety of factors that affect renal perfusion, we investigated whether identification of a renal shunt using CT imaging could be used as a predic- tor of early renal hemodynamic changes in patients with liver cirrhosis.
Materials and Methods
Patients and Clinical Features
Eighty-two patients with liver cirrhosis (66 men and 16 women; mean age 57.5 ± 10.9 years; age range, 41- 78 years) and 41 patients without chronic liver disease (control group, 23 men and 18 women; mean age 52.0
± 11.7 years; age range, 45-81 years) were referred for three-phase spiral CT imaging of the liver to assess liver lesions. The study was reviewed and approved by the institutional review board. Patients with heart failure or sepsis affecting renal perfusion were not included in the study group. The control group consisted of patients
with a variety of focal liver lesions who had normal liver function tests (16 hemangiomas, 10 metastases, 8 cysts and 7 others lesions). The diagnosis of cirrhosis was based on a liver biopsy for 12 patients and on clinical, laboratory, and imaging data for the remainder of pa- tients. Cirrhosis was due to a viral origin in 46 patients, an alcoholic origin in 22 patients, a biliary origin in 3 pa- tients and a cryptogenic origin in 11 patients (Table 1).
The clinical status of the patients with cirrhosis, includ- ing 34 cases with hepatocellular carcinoma with no por- tal vein invasion, was Child’s A in 27 cases, Child’s B in 40 cases, and Child’s C in 15 cases. All participants, in- cluding the patients with liver cirrhosis as well as the control group of subjects, had a serum creatinine con- centration of less than 1.5 mg/dL and no renal abnor- malities at the time of abdominal CT imaging.
CT Exams
For dedicated renal parenchymal imaging of subjects with a suspected perfusion abnormality of the kidney, we studied each patient prospectively with the use of three-phase spiral CT imaging. The CT protocol was as follows. All images were obtained with a spiral CT scan- ner (Somatom plus 4 scanner, Siemens, Erlangen, Germany) following the oral administration of 800- 1000 ml of 3% diatrizoate meglumine (Gastrograffin, Bracco Diagnostics, Princeton, NJ U.S.A.). After a non- enhanced study was performed including the entire structures of the liver and kidneys, 120 ml of iopamidol (Ultravist, 300 mg I/ml, Schering, Germany) was inject- ed at a rate of 3 ml/sec into an antecubital vein using a mechanical power injector. The delay between adminis- tration of the contrast material and the onset of scanning was 30 seconds, 60 seconds and 5 minutes, which corre- sponded to the arterial, portal and delayed phases.
Scanning times ranged from 12-18 sec (mean, 15 sec).
The section thickness was 8 mm, with a pitch of 1.5:1.
We assessed the attenuation value of the renal cortex us- ing Hounsfield units (HU) in a fixed section at the hilar level by assigning three circular regions of interest (ROI).
Table 1. Patient Characteristics
Control Group (n = 41) Cirrhotic Group (n = 82) Hemangioma (n = 16) Cyst (n = 8)
Metastasis (n= 10) Others (n = 7)
Viral cirrhosis (n = 46) Alcoholic cirrhosis (n = 22) Biliary cirrhosis (n = 3) Cryptogenic cirrhosis(n = 11) Note: Control group of subjects has normal hepatic function
Data Analysis
In each case, the ROIs were chosen to include as much of the renal cortex as possible, with exclusion of the renal medulla or cystic areas (Fig. 1). The three mea- sured values for each phase (i.e., for each image) were then averaged. These mean values were compared us- ing a t-test and scattered plots for patients with cirrhosis
and control subjects in three phases. Before determining whether associated factors correlated with renal hypop- erfusion, we set out to identify cases with renal hypop- erfusion in patients with liver cirrhosis. Renal hypoper- fusion associated with cirrhosis was defined as the mean attenuation value of CT identified renal cortices less than two SDs as compared to the mean attenuation val- ues less than two SDs for control subjects in the portal phase. The following factors were included in the sim- ple logistic regression analysis for assessing the risk of renal hypoperfusion: age, sex, presence of ascites, renal shunt and Child’s grade. The diameter of the renal shunts was measured at a location immediately before entering the left renal vein. The degree of ascites was classified into four grades as follows: grade 1: no ascites;
grade 2: easily detected but of relatively small volume;
grade 3: obvious ascites but less than tense; grade 4:
tense ascites. To exclude the influence of multiple vari- ables on renal enhancement characteristics, a multiple logistic regression analysis was used to adjust for fac- tors. Likelihood ratio testing for trends was conducted for age, presence of ascites, and the Child’s grade.
Statistical analysis was performed using the SAS statisti- cal package (SAS Institute, Cary, NC U.S.A.). A P-value less than 0.05 was considered as statistically significant.
Fig. 1. Measurement of HU at the three regions of interest (ROI) in the renal cortex. Small circles represent the three ROIs. ROIs were chosen to include as much of the renal cortex as possible, with exclusion of the renal medulla.
A B C
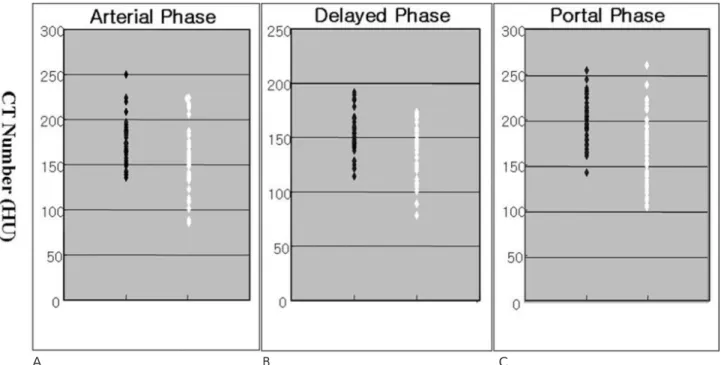
Fig. 2. Scatter plots for renal cortical CT attenuation value (HU) in the control group of subjects (black dots) and cirrhotic group of patients (white dots). For the renal cortices, the mean CT attenuation values were measured in the arterial (A), portal (B), and de- layed (C) phases. Although the two groups exhibited different values for the mean CT attenuation value, there is considerable overlap in the individual values in comparisons between the two groups.
Results
The mean CT attenuation values of the renal cortices in cirrhotic patients were significantly lower than the values in control subjects for all three phases: 153.3 ± 37.9 versus 173.3 ± 25.2 in the arterial phase, 172.6 ± 41.0 versus 197.6 ± 26.5 in the portal phase and 136.9
± 26.0 versus 152.7 ± 20.0 in the delayed phase, re- spectively; p < 0.01 (Table 2). Individual CT attenuation
values of the renal cortices for the two groups are repre- sented in a scatter plot (Fig. 2). Although the two groups had different mean CT attenuation values, there was considerable overlap of the individual values between the two groups. In patients with cirrhosis, 23 cases of re- nal hypoperfusion were identified using a cutoff value of 144.6 HU (-2SD) in the portal phase (Fig. 3). The mean attenuation value of the cases identified on CT with renal hypoperfusion was 111.7 ± 20.1 HU for arte- rial phase, 119.9 ± 11.8 HU for portal phase and 104.3
Table 2. Mean CT Attenuation Values (HU) of Renal Cortices in the Studied Groups
Group Control Cirrhosis p-Value Hypoperfusion
Arterial Phase 173.3 ± 25.2 153.3 ± 37.9 < 0.01 111.7 ± 20.1
Portal Phase 197.6 ± 26.5 172.6 ± 41.0 < 0.01 119.9 ± 11.8
Delayed Phase 152.7 ± 20.0 136.9 ± 26.0 < 0.01 104.3 ± 12.5
A B
C D
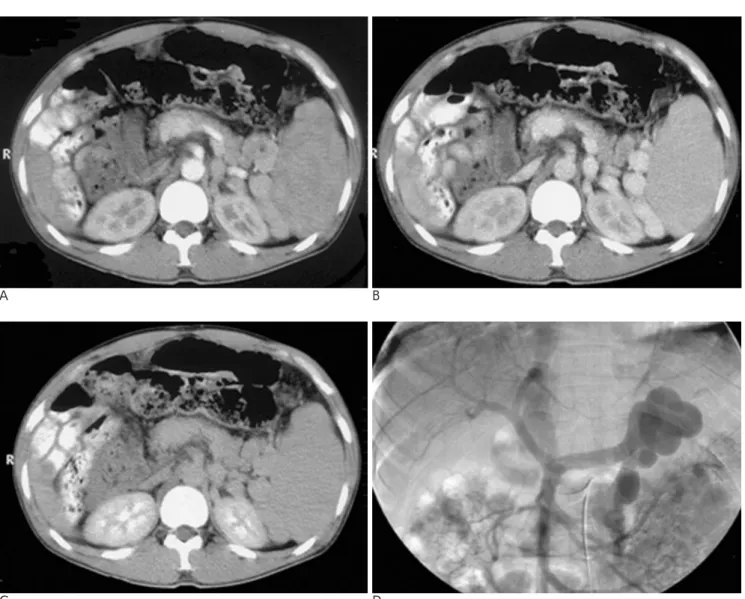
Fig. 3. A three-phase CT scan (A-arterial phase, B-portal phase, C-delayed phase) and arterial-portography (D) performed in a pa- tient with a renal shunt. Much of the portal venous inflow is diverted through the renal shunt, showing early opacification of the inferior vena cava. Prominent hypoperfusion of the renal cortex (108 HU in A, 112 HU in B, 107 HU in C) is noted in the images of the three phases studied. This patient has no ascites.
± 12.5 for delayed phase (Table 2). The mean diameter for the renal shunt was 10.6 ± 3.7 mm (range, 5-18 mm). Univariate logistic analysis demonstrated that three factors (Child’s class B, Child’s class C and the presence of a renal shunt) were significantly associated with renal hypoperfusion. However, multiple logistic re- gression analysis demonstrated only two factors were significantly associated with renal hypoperfusion:
Child’s class C [adjusted Odds ratio (aOR): 58.4, 95%
confidence interval (CI): 3.6-956.2] and the presence of a renal shunt (aOR: 7.5, 95% CI: 1.8-30.5). Although the renal hypoperfusion in the Child’s B group was sta- tistically significant (OR: 11.1, 95% CI: 1.4-91.8; p <
0.01), this factor was not significant when adjusted for other factors (aOR: 7.8, 95% CI: 0.8-76.6; p < 0.01).
While renal perfusion tended to decline as the Child’s grade increased (trend: p < 0.01), the same trend was not demonstrated for grade of ascites or age.
Interestingly, renal hypoperfusion was not related to ei- ther the presence of ascites or the degree of ascites (Table 3).
Discussion
In contrast to the vasodilatation seen in the splanchnic and systemic circulatory systems, the central hemody- namic abnormality occurring in the renal vascular bed
in cirrhosis is vasoconstriction. It has been estimated that up to 80% of cirrhotic patients hospitalized with as- cites exhibit renal hypoperfusion caused by renal vaso- constriction (6). The mean CT attenuation value of renal cortices in cirrhotic patients was significantly lower than the mean value of control subjects for the three CT phases studied. Moderate degrees of renal vasoconstric- tion are commonly overlooked in clinical practice, as the sensitivity of the tests used to estimate the glomeru- lar filtration rate (GFR) in the clinical setting is low in patients with cirrhosis. The existence of moderate renal vasoconstriction is important clinically for several rea- sons. First, patients with moderate renal vasoconstric- tion have more marked sodium retention and they re- quire higher doses of diuretics than are required by pa- tients with normal renal perfusion for the treatment of, or prevention of, ascites (4). Second, patients with mod- erate renal vasoconstriction are predisposed to the de- velopment of hepatorenal syndrome (7, 8). Third, cir- rhotic patients may develop renal dysfunction when treated with a variety of medications, especially nons- teroidal anti-inflammatory drugs (NSAIDs) and amino- glycosides. For the early detection of renal hyperperfu- sion, there are significant limitations using serum creati- nine as a marker for renal function in patients with cir- rhosis. Ideally, the GFR should be measured in cirrhotic patients; however, this is not feasible in most settings.
Table 3. Logistic Regression Analysis in the Cirrhotic Group
Variable Renal Perfusion OR aOR
Normal Decrease 95% CI 95% CI
Sex Female 11 05 1 1
Male 48 18 0.8 (0.3-2.7) 1.1 (0.2-6.3)
Age < 55 years 15 09 1 1
55-64 years 25 08 0.6 (0.2-1.9) 1.1 (0.2-5.8)
> 65 years 19 06 0.7 (0.2-2.3) 1.3 (0.2-7.4)
Trend: p = 0.49 Trend: p = 0.76
Child’s A 26 01 1 1
B 28 12 11.1 (1.4-91.8) 7.8 (0.8-76.6)
C 05 10 52.0 (5.4-502.1) 58.4 (3.6-956.2)
Trend: p < 0.01 Trend: p < 0.01
Ascites 1 34 08 1 1
2 13 07 2.3 (0.7-7.6) 0.7 (0.1-4.2)
3 07 06 3.6 (1.0-13.8) 1.1 (0.2-7.5)
4 05 02 1.7 (0.3-10.4) 0.3 (0.1-3.9)
Trend: p = 0.13 Trend: p = 0.54
SRS NO 47 07 1 1
YES 12 16 9.0 (3.0-26.7) 7.5 (1.8-30.5)
Note: SRS = spontaneous splenorenal shunt; OR = Odds ratio; aOR = adjusted Odds ratio; CI = confidence interval
Renal hypoperfusion is defined as the mean CT attenuation value of the identified renal cortices less two standard deviations (SD) as com- pared to the value for control subjects determined in the portal phase.
An alternative diagnostic approach is the use of Doppler sonography to assess the resistive index (RI) of the renal vasculature. Previous studies have shown (7, 9) that an abnormal renal RI predicts an increased chance for de- velopment of hepatorenal syndrome and kidney dys- function. Although abnormal values may identify pa- tients at high risk, an elevated RI (greater than 0.70) usu- ally suggests the presence of a number of other intrinsic renal diseases (10); however, more information is re- quired before the use of the RI can be recommended as a standard procedure. With increasing use of cross-sec- tional imaging, dynamic CT, which can acquire the cor- ticomedullary phase of renal enhancement, has as- sumed a greater role in the evaluation of renal perfu- sion. The attenuation value of renal cortices, as identi- fied by CT, may provide data for calculating important physiological parameters, such as renal perfusion and the GFR (11). Changes in the CT attenuation value, in a region after an intravenous injection of contrast medi- um, may be used to calculate blood flow per unit vol- ume of tissue. As the CT attenuation value of renal cor- tices in the corticomedullary phase documents renal perfusion, images obtained during this phase might be of particular value for detecting abnormalities in renal perfusion (11). A hyperattenuating cortical nephrogram with corticomedullary differentiation is obtained during the corticomedullary phase, which occurs approximate- ly 25-80 seconds after the start of intravenous contrast material administration (12). With our method, the time interval between the initiation of injection of contrast agent and the beginning of CT scanning is predeter- mined, and is the same in all patients. Although the CT attenuation values of renal cortices in cirrhotic patients was significantly lower than the values of control sub- jects for the three phases, the arterial phase (30 sec) im- age may not ensure maximum enhancement of the re- nal cortex in all cases; as it does not account for differ- ences among individuals for circulation time or blood volume. Therefore, for the three phase images studied, only the portal phase (60 sec) image was used for the se- lection of patients with renal hypoperfusion, as the den- sity of the renal cortex was greatest at approximately one minute after the bolus injection of contrast material.
As differential CT values for renal hypoperfusion do not exist for normal renal perfusion and decreased renal perfusion, we therefore defined renal hypoperfusion in cirrhotic patients to have less than two standard devia- tions in the number of renal cortices on CT imaging as compared to control patients during the portal phase
imaging. Based on our results, although the cutoff value (144.6 HU) was relatively high, the mean CT attenua- tion value of the renal cortices for patients with hypop- erfusion was very low (119.9 HU). Contrast material starts to appear in the collecting system in the delayed phase, which occurs approximately three to five min- utes after the start of intravenous contrast material ad- ministration. Delayed phase imaging was useful to rule out a urinary obstruction that could have affected the cortical nephrogram.
The most widely accepted theory suggests that renal vasoconstriction is the consequence of underfilling of the systemic arterial circulation secondary to marked vasodilatation of the splanchnic circulation (1-4). This vasodilatation is a characteristic feature of cirrhosis and contributes to the hyperdynamic circulatory state, re- sulting in an increase of portal venous inflow. Portal ve- nous flow does not reflect portal venous inflow (which is equivalent to the sum of portal and the collateral blood flow) as much of the latter is diverted into portal- systemic collaterals, and because portal venous flow is normal or reduced in patients with cirrhosis (13). Even though the collateral vessels serve to decompress the he- patic vascular bed, they are actually high-resistance ves- sels. Thus, there is inadequate decompression of the high-pressure portal vascular bed, and portal pressure remains high. The increase in portal venous inflow re- sulting from splanchnic vasodilatation represents not only an important factor that contributes to maintain or worsen not only portal pressure elevation but also hy- perdynamic circulation. However, for evaluation of hy- perdynamic circulation, measurement of portal inflow is not feasible in clinical practice as diverse collateral routes may be present in patients with cirrhosis.
Therefore, a representative collateral route indicating hyperdynamic circulation is needed among various col- lateral routes. Ohm’s law defines the pressure in any vessel: P = Q X R, where P is the pressure, Q is the flow, and R is the resistance to flow through a vessel.
The resistance can be further measured using Poiseulle’s law: R = 8nL/r4, where L is the length of the vessel, r is the radius of the vessel, and n is the coeffi- cient of viscosity. The radius of the vessel appears to be the most important factor because small changes in the radius are associated with large changes in resistance.
As most collateral vessels, including esophageal or um- bilical collateral vessels, have a long length and small ra- dius, the flow volume through these collateral routes may be relatively small due to high vascular resistance,
and therefore cannot be used as a predictor of hyperdy- namic circulation. However, renal shunts that are iden- tified by imaging may be useful factors to suggest an in- crease of diverting portal inflow as they usually have a short length and larger diameter, similar to surgical shunts. Therefore, renal shunts may be a representative collateral route that can be used to characterize hyper- dynamic circulation. This concept is supported by the fact that the portal venous pressure has been shown to be significantly lower in patients with large gastrorenal shunts (14). In our study, the clinical factors significant- ly associated with renal hypoperfusion, as determined by logistic regression analysis, were Child’s class C and the presence of a renal shunt. Thus, our findings suggest that a renal shunt (hyperdynamic circulation) and renal vasoconstriction are intimately related to each other, and serve as compensatory mechanisms to maintain ef- fective arterial blood volume and arterial pressure in pa- tients with cirrhosis. With the advent of modern imag- ing techniques, such as sonography, CT, and MR imag- ing, renal shunts can now be easily detected.
In conclusion, the presence of a renal shunt may be a useful predictor for renal hypoperfusion in addition to the Child’s grade in patients with cirrhosis. Identifica- tion of moderate renal hypoperfusion can aid in the management of patients with cirrhosis.
Acknowledgement: This study was supported by clini- cal research institute grants from Chosun University Hospital in 2006.
References
1. Gines P, Guevara M, Arroyo V, Rodes J. Hepatorenal syndrome.
Lancet 2003;362:1819-1827
2. Wadei HM, Mai ML, Ahsan N, Gonwa TA. Hepatorenal syn- drome: pathophysiology and management. Clin J Am Soc Nephrol 2006;1:1066-1079
3. Ng CK, Chan MH, Tai MH, Lam CW. Hepatorenal syndrome. Clin Biochem Rev 2007;28:11-17
4. Arroyo V, Gines P, Gerbes AL, Dudley FJ, Gentilini P, Laffi G, et al. Definition and diagnostic criteria of refractory ascites and hepa- torenal syndrome in cirrhosis. Hepatology 1996;23:164-176 5. Iwao T, Oho K, Nakano R, Yamawaki M, Sakai T, Sato M, et al.
Effect of meal induced splanchnic arterial vasodilatation on renal arterial hemodynamics in normal subjects and patients with cir- rhosis. Gut 1998;43:843-848
6. Gines P, Fernandez-Esparrach G, Arroyo V, Rodes J. Pathogenesis of ascites in cirrhosis. Semin Liver Dis 1997;17:175-189
7. Platt JF, Ellis JH, Rubin JM, Merion RM, Lucey MR. Renal duplex doppler ultrasonography: a noninvasive predictor of kidney dys- function and hepatorenal failure in liver disease. Hepatology 1994;20:362-369
8. Gines A, Escorsell A, Gines P, Salo J, Jimenez W, Inglada L, et al.
Incidence, predictive factors, and prognosis of the hepatorenal syndrome in cirrhosis with ascites. Gastroenterology 1993;105:229- 236
9. Al-Kareemy EA, Sobh MA, Muhammad AM, Mostafa MM, Saber RA. Renal dysfunction in liver cirrhosis: renal duplex Doppler US vs. scintigraphy for early identification. Clin Radiol 1998;53:44-48 10. Platt JF, Rubin JM, Ellis JH. Acute renal failure: possible role of du-
plex Doppler US in distinction between acute prerenal failure and acute tubular necrosis. Radiology 1991;179:419-423
11. Dawson P, Peters AM. Functional imaging in computed tomogra- phy. The use of contrast-enhanced computed tomography for the study of renal function and physiology. Invest Radiol 1993;28:79-84 12. Yuh BI, Cohan RH. Different phases of renal enhancement: role in detecting and characterizing renal masses during helical CT. AJR Am J Roentgenol 1999;173:747-755
13. Moriyasu F, Nishida O, Ban N, Nakamura T, Miura K, Sakai M, et al. Measurement of portal vascular resistance in patients with por- tal hypertension. Gastroenterology 1986;90:710-717
14. Watanabe K, Kimura K, Matsutani S, Ohto M, Okuda K. Portal he- modynamics in patients with gastric varices. A study in 230 pa- tients with esophageal or gastric varices using portal vein catheteri- zation. Gastroenterology 1988;95:434-440
대한영상의학회지 2008;58:409-416
간경변 환자에서 콩팥 관류감소와 연관된 지라콩팥 단락1
1조선대학교병원 영상의학과
2순천향대학교부천병원 영상의학과
3분당서울대학교병원 영상의학과
변 주 남・김 동 훈2・강 성 권3
목적: 자발 지라-콩팥 단락이 간경변 환자의 초기 콩팥 혈역동학 변화의 예견 인자로 사용될 수 있는지 알아보고 자 하였다.
대상과 방법: 간경변 환자 82명과 대조군 41명을 대상으로 하였다. 3기 전산화단층촬영이 시행되었고 콩팥 관류를
알아보기 위해 콩팥 피질에서 CT 값을 측정하였다. 콩팥 관류감소 발생 성향을 나이, 복수, Child 등급에 따라 알 아보았다.
결과: 간경변 환자에서 콩팥 피질 평균 CT 값은 대조군에 비해 3기 모두에서 낮았다(동맥기: 153.3 ± 37.9 대 173.3 ± 25.2, 문맥기: 172.6 ± 41.0 대 197.6 ± 26.5, 지연기: 136.9 ± 26.0 대 152.7 ± 20.0). 콩팥 관류 감 소 환자에서 피질 CT 값은 문맥기에 119.9 ± 11.8였다. 두 가지 요인이 콩팥 관류 감소와 연관이 있었다: Child 등급 C (교정 확률 비: 58.4, 95% 신뢰구간: 3.6 - 956.2; p < 0.01) 와 지라콩팥 단락(교정 확률 비: 7.5, 95%
신뢰구간: 1.8 - 30.5; p < 0.01). 또한, 콩팥 관류 감소는 복수량 또는 나이와 상관이 없었고 Child등급에 따라 (경 향: p < 0.01) 진행하였다.
결론: 심한 간질환과 연관해서 늘어난 자발 지라콩팥 단락은 간경변에서 콩팥 관류 감소의 위험 요인이 될 수 있다.