| Abstract |
3)PURPOSE: This study examined the relationship between the severity of a hallux valgus (HV) deformity and the kinetic three-dimensional ground reaction force (GRF) through a motion analysis system with force platforms in individuals with a HV deformity during normal speed walking.
METHODS: The participants were 36 adults with a HV deformity. The participants were asked to walk on a 6 m walkway with 40 infrared reflective markers attached to their pelvic and lower extremities. A camera capture system and two force platforms were used to collect kinetic data during gait. A Vicon Nexus and Visual3D motion analysis software were used to calculate the kinetic GRF data.
RESULTS: This research showed that the anterior maximal force that occurred in the terminal stance phase during gait had a negative correlation with the HV angle (r = -.762, p < .01).
In addition, the HV angle showed a low negative correlation with the second vertical maximal force (r = .346, p < .05) and a moderate positive correlation with the late medial maximal
†Corresponding Author : Yong-Wook Kim [email protected], https://orcid.org/0000-0002-0311-9766
This is an Open Access article distributed under the terms of the Creative Commons Attribution Non-Commercial License (http://creativecommons.org/licenses/by-nc/3.0) which permits unrestricted non-commercial use, distribution, and reproduction in any medium, provided the original work is properly cited.
force (r = .641, p < .01).
CONCLUSION: A more severe HV deformity results in greater abnormal translation of the plantar pressure and a significantly reduced pressure force under the first metatarsophalangeal joint.
Key Words: Force platform, Hallux valgus, Three dimensions
Ⅰ. Introduction
Hallux valgus (HV) is a foot deformity characterized by the outward deviation of the first intermetatarsal and metatarsophalangeal joints and is generally associated with chronic pain on the medial head of the first metatarsal bone [1-3]. Although the exact causes of HV have not yet been identified clearly, previous studies reported that the causes of HV include abnormal gait pattern, wearing footwear of insufficient length, inheritance of family physical traits, flat feet, and sex [3-5].
Thus far, various therapeutic interventions have been performed for patients with HV. Nonoperative care, such as physical therapy, foot-toe orthoses, and medication, is always the first treatment option for HV deformities [6-8].
Among these options, various foot-toe orthoses that correct the alignment of the first metatarsophalangeal joint are preferred for minor to moderately severe HV, which have
Research Article Open Access
Relationship between Hallux Valgus Severity and 3D Ground Reaction Force in Individuals with Hallux Valgus Deformity during Gait
Yong-Wook Kim, PT, PhD
†Department of Physical Therapy, College of Medical Sciences, Jeonju University
Received: May 30, 2021 / Revised: June 2, 2021 / Accepted: June 17, 2021
ⓒ 2021 J Korean Soc Phys Med
significant clinical effectiveness [3,7,9].
To the best of the authors’ knowledge, few studies have examined the kinetic relationship between the severity of HV deformity and the three-dimensional (3D) ground reaction force (GRF) using a motion analysis system with force plates during gait. Because the first metatarsophalangeal joint in a normal gait pattern acts as an anchor for the forward translation of body weight force during the late stance phase [10], malalignment or a pathologic dysfunction of the first metatarsophalangeal joint could adversely affect the efficient push-off and alter the GRF [11]. An imbalance of the abductor and adductor hallucis muscles could elicit more medial movement of the center of pressure in the first metatarsophalangeal joint during the late stance phase, contributing to a HV deformity [10].
Understanding the kinetic information, such as joint moments and ground reaction force that occur in the joints and segments of the lower extremities during gait in individuals with HV, is very important. Most previous studies reported the plantar pressure distribution or transfer of plantar pressure in patients with HV during gait [9,10,12]. Therefore, this study examined the relationship between the kinetic GRF and HV severity through 3D gait analysis in individuals with HV during gait. This study tested the hypothesis that there is a significant correlation between the severity of a HV deformity and 3D GRF during the stance phase.
Ⅱ. Methods
1. Subjects
The sample size was calculated based on an estimated effect size derived from Seki et al. [13], who examined the relationship between the degree of the HV deformity and the kinematics. A sample size of 17 was determined to be sufficient to identify a significant correlation. The subjects in this study were thirty-four adults (14 males and 20 females) with a HV deformity. The inclusion criteria
were a hallux valgus angle of more than 10° measured using a universal goniometer in both feet and no severe pain of the hallux area or a history of foot surgery [2,3].
The mean and standard deviation of hallux valgus angle was 24.4 ± 9.3° in the right foot and 26.2 ± 12.1° in the left foot. All participants voluntarily participated in this study. They provided written informed consent and fully understood the purpose and experimental procedure. The Institutional Review Board of Jeonju University approved this study (jjIRB-180905-HR-2018-0904). Table 1 lists the general characteristics of the subjects.
2. Instrumentation and Procedure
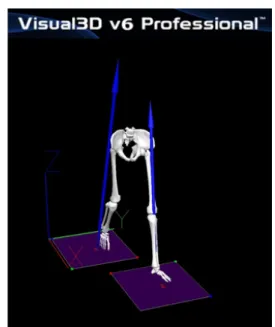
A motion capture system (Vicon Inc., Oxford, England) with eight infrared cameras (model T10) and two force platforms (AMTI, Massachusetts, USA) was used to obtain the 3D kinetic data during gait (Fig. 1). The 3D GRF kinetic data were transferred to the main computer using Nexus 1.8.5 software (Vicon Inc., Oxford, England) and processed to produce the final c3d files. A T-frame wand (7.5 cm) was used to calibrate the motion capture system and used to set the lab X-Y-Z origin for a calibration reference object.
The motion capture-sampling rate of the T10 camera was 100 Hz.
Forty reflective markers (1.4 cm) were attached to both lower extremities and the anterior and posterior superior iliac spines, greater trochanters, femur epicondyles, malleoli, rearfoot, midfoot, and forefoot (Fig. 1). Four cluster refl
Characteristics Mean ± SD
Gender Male: 14, Female: 20
Age (years) 28.43 ± 6.15
Height (cm) 162.73 ± 8.05
Weight (kg) 63.71 ± 10.18
Gait speed (m/s) 1.323 ±
.172
Step length (cm) 133.11 ± 10.48
Step width (cm) 11.92 ± 3.07
Table 1. General Characteristics of the Subjects (N = 34)
ective markers were attached bilaterally to the calf and thigh segments using the six-degrees-of-freedom model [14]. Static calibration capture was used on each subject for 3D GRF analysis during the walking trials to produce a template model for analysis. The calibrated anatomical system technique was used to identify the changes in the kinetic GRF data of the lower extremities while the subjects walked freely. After completing the experimental setup for motion analysis, the subjects were asked to walk along a 6 m walkway at a comfortable speed. The kinetic GRF data from two force platforms were collected while performing 8 to 10 walking trials.
After collecting the analog GRF data using two force platforms and the Vicon Nexus software program, Visual3D motion analysis software (Visual3D Pro, C-Motion Inc., USA) was used to obtain the final dynamic GRF results and the 3D graph reports of both extremities during the stance phase. The GRF kinetic data were
low-pass filtered with a fourth-order Butterworth filter and a cutoff frequency of 15 Hz. Following the right-hand rule for the segment coordinate system axes, the X-Y-Z Cardan sequence was used to define the order of the rotations [14].
Visual3D produced the virtual direction and amplitude of dynamic 3D GRF in laboratory space based on a motion capture system that enabled the relevant 3D GRF to be calculated for statistical analysis during the stance phase in the total gait cycle (Fig. 2).
3. Data Analysis
The Kolmogorov-Smirnov test was used to confirm that the kinetic GRF and HV angle data were distributed normally. The Pearson product-moment correlation analysis was used to verify the relationship between the HV angle and the 3D GRF variables. The GRF variables consisted of the posterior maximal force, initial mediolateral maximal force, initial vertical maximal force, midstance vertical minimal force, late vertical maximal force, anterior maximal force, and late mediolateral maximal force Fig. 1. Dynamic motion capture system with eight infrared
cameras and two force platforms to obtain the 3D kinetic data during gait.
Fig. 2. Visual3D motion analysis of the magnitudes and
directions of the GRF of both limbs in the 3D space
during gait.
developed in each motion plane during the stance phase of gait (Fig. 3). All analyses were conducted using SPSS version 26.0 (IBM Corp., Armonk, NY, USA). Differences were considered significant at the α =
.05 level.
Ⅲ. Results
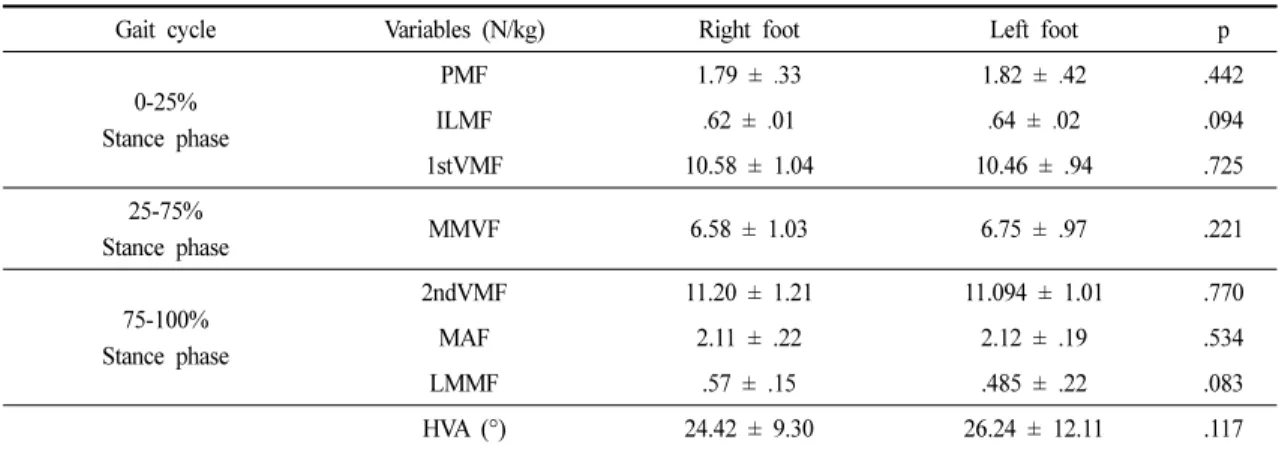
Table 2 lists the means and standard deviations of the GRF variables and the HV angles of both feet. No significant differences were observed between the right and Fig. 3. Three-dimensional ground reaction force variability developed in each plane during the stance phase. The means
(thick lines), each trial (thin line), and standard deviation (bands) are shown.
Gait cycle Variables (N/kg) Right foot Left foot p
0-25%
Stance phase
PMF 1.79 ±
.33 1.82 ±
.42 .442
ILMF
.62 ±
.01
.64 ±
.02 .094
1stVMF 10.58 ± 1.04 10.46 ± .94 .725
25-75%
Stance phase MMVF 6.58 ± 1.03 6.75 ± .97 .221
75-100%
Stance phase
2ndVMF 11.20 ± 1.21 11.094 ± 1.01 .770
MAF 2.11 ± .22 2.12 ± .19 .534
LMMF .57 ± .15 .485 ± .22 .083
HVA (°) 24.42 ± 9.30 26.24 ± 12.11 .117
PMF: Posterior maximal force, ILMF: Initial lateral maximal force, VMF: Initial vertical maximal force, MVMF: Midstance vertical minimal force, MAF: Maximal anterior force, LMMF: late medial maximal force, HVA: Hallux valgus angle
Table 2. Mean ± SD of the Ground Reaction Force and Hallux Valgus Angle (N = 34)
left feet of all GRF variables and HV angles (p
>.05) (Table 2).
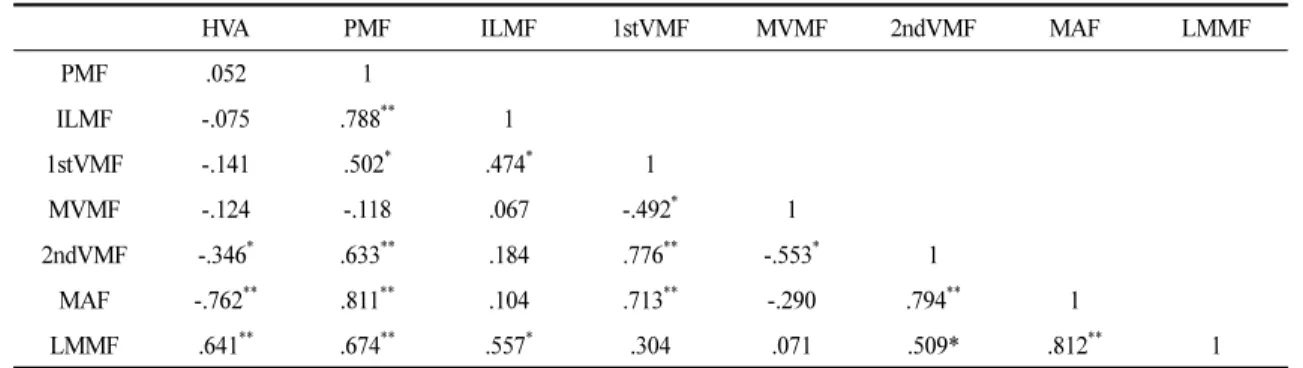
The correlations between the HV angle and some 3D GRF variables showed significant differences (Table 3).
The anterior maximal force in the terminal stance phase during gait showed a highly negative correlation with the HV angle (r = -.762, p = .000). In addition, the HV angle showed a low negative correlation with the second vertical maximal force (r = -.346, p = .025) and a moderate positive correlation with the late medial maximal force (r = .641, p = .002). On the other hand, there was no significant correlation between the HV angle and the other GRF variables (p
>.05) (Table 3). The result showed a significant correlation among the various GRF variables. The posterior maximal force showed a significant moderate or high correlation with all the GRF variables except for the midstance vertical minimal force, and the initial lateral maximal force showed a significant correlation with the first vertical force (r = .474, p = .008) and the late medial maximal force (r = .557, p = .004) (Table 3).
Ⅳ. Discussion
This study examined the relationship between the HV angle and various GRF values obtained during the free walking trials using 3D motion analysis in individuals with
HV. The HV angle was significantly negatively correlated with most of the 3D GRF variables that occurred at certain sections of the stance phase during free walking. In particular, a strong negative correlation was noted between the HV angle and the anterior maximal force occurring at 75% to 100% of the stance phase during gait (r = -.762).
This result means that the push-off or toe-off force generated from the ground contacting the foot in the terminal stance phase during walking decreases as the HV angle increases. Among the metatarsophalangeal and intertarsal joints, the first metatarsophalangeal joint is the largest. It plays an important role as a pivot for weight-bearing transfer of the forefoot during the late stance phase [10,15]. In addition, it provides an attachment site for various muscles, such as the adductor hallucis, abductor hallucis, flexor hallucis brevis muscles, and plantar fascia, which support the longitudinal foot arch of the medial foot area [16]. Therefore, a HV deformity may cause a problem in supporting the medial longitudinal arch of the foot and trigger pes planus [17,18]. Although these results could not be compared with previous studies directly, some studies examined the relationship between plantar pressure distribution and HV deformity using a treadmill with an electric pressure sensor mat [10] or a simple mat transducer platform during gait [12]. The second and third
HVA PMF ILMF 1stVMF MVMF 2ndVMF MAF LMMF
PMF .052 1
ILMF -.075 .788
**1
1stVMF -.141 .502
*.474
*1
MVMF -.124 -.118 .067 -.492
*1
2ndVMF -.346
*.633
**.184 .776
**-.553
*1
MAF -.762
**.811
**.104 .713
**-.290 .794
**1
LMMF .641
**.674
**.557
*.304 .071 .509* .812
**1
*