Abstract
To determine whether pattern recognition based on metabolite fingerprinting for whole cell extracts can be used to discriminate cultivation origin metabolically, eight Pinellia tubers (Pinellia ternata) were subjected to Fourier transform infrared spectroscopy (FT-IR). FT-IR spectral data from Pinellia tubers were analyzed by principal component analysis (PCA) and partial least square discriminant analysis (PLS-DA). The dendrogram based on hierarchical clustering analysis of these PCA and PLS-DA data on Pinellia tubers showed that tuber samples were segregated into Chinese and Korean Pinellia in a cultivation origin-dependent manner. Thus we suggested that the hierarchical dendrogram based on PCA and PLS-DA of FT-IR spectral data from tubers represented the most probable chemical relation- ship between Pinellia tubers. The overall prediction accuracy for discrimination of cultivation origin was 100% in a cross-validation test. These results clearly show that the FT-IR spectra combined with multivariate analysis from Pinellia tubers can be applied as an alternative tool for discriminating of cultivation origin. Furthermore these metabolic discrimination systems could be applied for stand- ardization for herbal medicine resources.
스펙트럼 데이터의 다변량 통계분석 기법을 이용한 FT-IR
반하의 원산지 식별 및 예측기술
안명숙1, 지은이1, 민성란1, 문병철2, 강영민2, 김석원3*
한국생명공학연구원 식물시스템공학연구센터 1.
한국한의학연구원 한약연구본부 한약자원그룹 2.
한국생명공학연구원 생물자원센터 3.
Prediction and Discrimination of Cultivation Origin of Pinellia Tubers Using FT-IR Spectroscopy Combined by Multivariate Analysis
Ahn Myungsuk1, Jie Eun-yee1, Min Sungran1, Moon Byeongcheol2, Kang Youngmin2, Kim Suk-weon3*
1Plant Systems Engineering Research Center and 3Biological Resources Center, Korea Research Institute of Bioscience and Biotechnology, Daejeon 305 806, Republic of Korea–
2Herbal Medicine Resources Group, Korea Institute of Oriental Medicine, Daejeon 305-811, Republic of Korea
서론
반하 Pinellia ternata (Thunb.) Makino는 천남성과(Araceae)에 속하는 다년생 초본으로 한국 중국, , 일본에 널리 분포하며 반하의 괴경 부위는 전통적으로 중요한 한약재로 많이 이용되고 있다 반하는 . 진해 거담 이뇨 진토 두통 등에 약리효과를 보이며 괴경에는 알카로이드 물질인 에페드린과 콜린, , , , , 정유, -β 시토스테롤 등의 유효성분을 함유하고 있다1). 최근 연구에서는 반하가 항암제 진정제 소염, , 제로서의 효과뿐 아니라 비만을 억제하는 작용을 한다는 결과도 보고되고 있다2,3).
주요 수입 한약재 중 하나인 반하는 한국보건산업진흥원의 보고에 따르면 2012년을 기준으로 천 달러 이 한국으로 수입되고 있으며 이들 대부분은 중국으로부터 수입되고 있다
340,519kg(2,950 ) .
한국과 중국산 반하 사이의 성분 및 약리효과의 차이는 거의 보고된 바가 없지만 한국 소비자들은 중국산 한약재는 한국산에 비해 효과가 덜하고 중금속 또는 농약에 더 오염되어 있다고 믿는 경향이 있다 이런 이유로 한국산 반하는 중국산 반하에 비해 배 이상 비싼 가격에 거래되고 있고 반하를 . 3 포함한 수입 한약재를 한국산으로 불법 표기하는 문제가 많이 발생하고 있다4). 하지만 많은 한약재들 이 가루나 절편 형태이기 때문에 육안으로 원산지를 판별하는 것은 매우 어려운 일이다 그러므로 . 공정하고 바른 한약산업의 발달을 위해서는 신속하고 정확한 한약자원 원산지 판별기술 및 표준화기 술의 개발이 매우 시급한 실정이다.
식물 집단 및 품종 등을 판별하기 위해서 분자생물학적 DNA marker를 이용한 유전적인 다양성을 조사방법이 많이 이용되고 있으며 RAPD(randomly amplified polymorphic DNA) 분석법이 주로 이 용되고 있다 반하는 종간 구분과 산지 등을 판별하기 위해 . RAPD 및 PCR-RFLP 법이 이용된 바 있다5,4). 그러나 RAPD 및 RFLP 분석법은 많은 장점을 가지고 있지만 낮은 재현성을 포함한 몇 가지 단점을 가지고 있다6,7). 따라서 보다 정확하고 신속한 판별 방법 개발이 요구되고 있다.
대사체 분석기술은 대사체 수준에서 시료간의 양적 질적 패턴 차이를 조사하는 연구 분야로 시료의 , 전 세포 추출물을 FT-IR(Fourier transform infrared spectroscopy), HNMR(proton nuclear mag-
및 등의 분석장비를 이용하여 스펙트럼을
netic resonance spectroscopy) MS(mass spectrometry)
조사하고 다변량 통계분석 기법(principal component analysis, discriminant analysis)을 통해 분석 할 수 있다8). 이들 기술들은 식물 종과 품종들 사이의 빠른 판별 등을 위한 식물 연구에 다양하게 적용되고 있다9-11). 특히 FT-IR을 이용한 분석법은 높은 감도를 가지며 다수의 시료로부터 얻어진 스펙트럼을 쉽고 간편하게 조사할 수 있다 최근 . FT-IR 스펙트럼 데이터의 다변량 통계분석 기술은 유연관계가 높은 미생물종의 식별12-14), 고등식물의 종 구분9-15)및 품종 식별11,16,17)에 활용되고 있다.
따라서 본 연구에서는 FT-IR 스펙트럼 데이터의 다변량 통계분석 기법을 이용하여 반하 괴경의 원산 지 식별 및 예측 체계를 확립하고자 하였다.
Keywords: Fourier transformation infrared spectroscopy(FT-IR), – Pinellia ternata, Partial least square discriminant analysis(PLS-DA), Principal component analysis(PCA), cultivation origin
본론
재료 및 방법 1.
실험재료 1)
본 연구에 사용된 반하(半夏, Pinellia ternata) 괴경의 건조파우더는 한의학연구원으로부터 제공받은 것을 사용하였다(Table 1). 실험에 사용한 각각의 반하 라인은 중국산 라인1 (C), 한국 제주산 라인5
한국 사천산 라인 으로 건조파우더 시료들은 한 번 더 막자와 막자사발을 (J1, J2, J3, J4, J5), 2 (S1, S2)
이용하여 미세한 분말로 분쇄하여 사용하였다.
Table 1. Materials and collection data for FT-IR analysis
의 추출 및 스펙트럼 데이터의 가공 2) Metabolite
개의 반하 괴경 분말 시료 을 에 넣고 용액을 씩 첨가하여 잘
40 20mg tube 20% methanol 200uL
섞어주었다 각 . tube를 50°C 수조에서 20분간 반응시킨 다음 13,000rpm에서 15분간 원심분리한 후 상징액을 새로운 tube에 옮겼다 회수한 상징액은 원심분리과정을 반복하여 찌꺼기가 들어가지 않도. 록 조심스럽게 새로운 tube로 상징액을 옮겼다 회수된 상징액은 . -20°C에서 보관한 다음 FT-IR 스펙 트럼 조사에 사용하였다. FT-IR 스펙트럼 조사는 Tensor 27(Bruker Optics GmbH, Ettlingen,
를 사용하였고 검출기로 분석하였다 추출된 각각의
Germany) , DTGS(deuterated triglycine sulfate) .
시료 5 Lμ 를 384-well silicon plate에 분주하여, 37°C hot plate에서 약 20분간 건조하였다 건조된 .
는 에 장착된 고효율 자동화 장치를 이용하
silicon plate Tensor 27 HTS-XT(Bruker Optics GmbH)
여 스펙트럼을 조사하였다 각 시료의 스펙트럼은 총 . 4,000~400cm-1범위에서 그리고 4cm-1간격으 로 총 128회 반복 측정된 평균 스펙트럼을 분석에 사용되었다 각 시료의 . FT-IR 스펙트럼은 통계적 분석을 위해 각각 반복 측정하였다5 . FT-IR 스펙트럼 조사 및 데이터 변환에 사용된 프로그램은
에서 제공하는 를 사용하였다
Bruker OPUS Lab(ver. 6.5, Bruker Optics Inc.) .
스펙트럼 데이터의 다변량 통계분석 3)
스펙트럼 데이터의 다변량 통계분석을 위해 먼저 스펙트럼 데이터의 교정
FT-IR FT-IR baseline ,
및 등 스펙트럼의 전처리 과정을 프로그램
normalization mean centering R (version 2.15.0,
Species Symb. Cultivation Origin
Pinellia ternata (Thunb.) Makino
C Hunan, China
J1 J2 J3 J4 J5
Jeju-do, Korea Seogwipo-si, Jeju-do, Korea Seogwipo-si, Jeju-do, Korea Seogwipo-si, Jeju-do, Korea
Jeju-do, Korea S1
S2
Sacheon-si, Korea Sacheon-si, Korea
미분을 수행한 다음 전처리가 완료된 스펙트럼 데이터를 다변량 통계분석 분석을 위한 표준화된 데이 터로 사용하였다 가공된 . FT-IR 스펙트럼 데이터는 NIPALS 알고리즘(Wold, 1966)을 이용하여 R 프로그램(version 2.15.0)에서 PCA(Principal component analysis)와 PLS-DA(Partial least
분석
square discriminant analysis) 18,19)을 수행하였다. PCA 및 PLS-DA 분석을 통해 얻어진 score 를 이용하여 HCA(hierarchical clustering analysis) 분석하였으며 유사도 지수로 UPGMA(un-
를 사용한 를 측정
weighted pair group method with arithmetic mean analysis) Euclidean distance 하여 각 시료의 유연관계를 dendrogram으로 나타냈다 반하의 원산지의 판별 예측력을 조사하기 위. 해 총 199개의 FT-IR 스펙트럼 데이터로부터 무작위로 training set(135 )개 와 test set(64 )개 로 나눈 다음 cross validation test를 수행하였다.
결과 및 고찰 2.
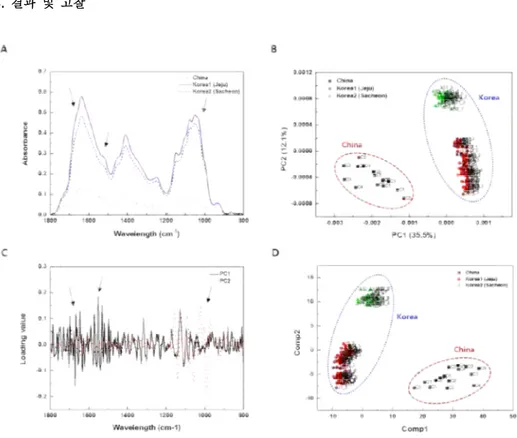
Fig. 1. Multivariate analysis of FT-IR spectral data from extracts of Pinellia tubers.
A: Representative FT-IR spectra of Pinellia ternata (Thunb.) Makino lines. Arrows indicate the FT-IR regions showing significant spectral variations between Pinellia tubers.
B: Two-dimensional PCA score plot of FT-IR spectral data from P. ternata lines.
C: PC loading plot based on PCA data of P. ternata lines. Solid line and dotted line represent PC 1 and PC 2 score, respectively. Arrows indicate the FT-IR regions playing important roles in P. ternata sample clustering.
D: PLS-DA score plot of FT-IR spectral data of P. ternata lines. PLS-DA score plot based on PCA data of P. ternata lines. Circles represent each boundary for group discrimination(B, D).
본 연구에서는 반하 괴경으로부터 얻어진 전세포추출물의 FT-IR 스펙트럼 데이터로부터 다변량 통 계분석 기법을 이용하여 신속하고 간편한 원산지의 구분 및 예측 체계를 확립하였다. 중국산 반하, 한국 제주산 반하 한국 사천산 반하 괴경 추출물의 , FT-IR 스펙트럼을 비교한 결과 중국산 반하 시료 의 스펙트럼은 한국산 반하 시료들에 비해 absorbance 값이 상대적으로 매우 낮았으나 한국산 반하 시료들은 이에 비해 비슷한 수준의 absorbance 값을 보여주고 있었다 스펙트럼의 양적 질적 패턴 . , 변화가 크게 이루어진 부위는 1,700~1,600, 1,600~1,500, 그리고 1,100~950cm-1부위임을 알 수 있었다(Fig. 1A). FT-IR 스펙트럼의 이 부위들은 각각 amide I, II 그리고 carbohydrates 계열의 화합 물들의 양적 질적인 정보를 반영하는 부위로 따라서 이들 계열의 전반적인 대사산물이 중국산 제주, , 산 사천산 반하 식물체들 간에 차이가 있음을 의미하는 결과라 사료된다, .
반하 FT-IR 스펙트럼 데이터의 PCA 분석 결과 PC 1과 2 score의 설명력은 각각 35.5%와 12.1%로 전체 변이량의 47.6%를 반영하고 있음을 알 수 있었다(Fig. 1B). 또한 PC1과 PC2를 이용한 PCA
을 관찰한 결과 반하 시료들은 에서 중국산 반하와 한국산 반하 시료들이
score plot , PC1 score plot
좌우로 뚜렷하게 구분이 되는 것을 관찰할 수 있었다. PCA score plot에서 중국산 반하는 좌측에, 제주산 반하 J1, J2, J3, J4, J5와 사천산 반하 S1, S2는 우측에 위치하였다 또한 한국산 반하 시료들은 .
에서 제주산 반하와 사천산 반하 시료가 뚜렷하게 구분되어 위쪽에는 사천 반하
PC2 score plot S1,
가 위치하며 아래쪽으로는 제주산 반하인 가 위치하는 것을 알 수 있었다
S2 J1, J2, J3, J4, J5 (Fig.
에서 원산지에 따라 반하 시료들을 구분하는 데 중요한 역할을 하는 스펙
2B). PCA score plot FT-IR
트럼 부위를 알아보기 위해 PC1과 PC2의 Loading value를 조사하였다(Fig. 1B). Loading values 분석 결과 중국산과 한국산 반하 시료를 좌우로 구분하는 데 중요한 역할을 한 의
plot PC1 FT-IR
스펙트럼 부위는 주로 1,700~1,600cm-1과 1,600~1,500cm-1임을 알 수 있었다 또한 한국산 반하 . 시료들을 제주산과 사천산으로 구분하는 데 중요한 역할을 한 PC2의 스펙트럼 부위는 1,100~950cm-1이었다(Fig. 1C). 이들 부위는 FT-IR 스펙트럼 비교 결과에서도 큰 차이를 보였던 부위로 중국산과 한국산 반하 시료들을 구분하는 데에는 amide I, II 계열의 화합물들의 양적 질적인 , 차이가 중요한 역할을 하였고 한국산 반하 시료들을 산지별로 구분하는 데에는 carbohydrates 계열의 화합물들의 차이가 중요한 역할을 했음을 알 수 있었다. PLS-DA 분석의 경우 PCA 분석과 마찬가지 로 반하 시료들을 원산지별로 구분하였다(Fig. 1D). PLS-DA plot을 보면 Comp1 score plot에서 중 국산 반하는 우측에 집단을 이루고 있으며 한국산 반하 시료들은 좌측에 위치하고 있음을 알 수 있었 다 또한 . Comp2 score plot에서는 위쪽으로 사천 반하가 위치하며 아래쪽으로는 제주산 반하가 위치 하여 한국산 반하 시료를 산지에 따라 뚜렷하게 구분할 수 있었다.
와 분석 데이터를 이용한 결과에서는 와
PCA PLS-DA HCA dendrogram PCA PLS-DA dendro- 모두 곳의 한국산 시료집단이 하나의 그룹을 형성하여 한국산 시료들 간의 대사산물의 차이가 gram 2
중국산 시료와의 차이보다 적음을 알 수 있었다(Fig. 2). 또한 FT-IR 스펙트럼 데이터의 PLS-DA 분석을 통하여 반하 식물의 원산지 예측이 가능한지 알아보기 위해
classification cross-validation
를 수행하였다 개의 시료를 이용하여 모델을 만든 후 개 반하 시료의 산지를 예측하였다
test . 135 64 .
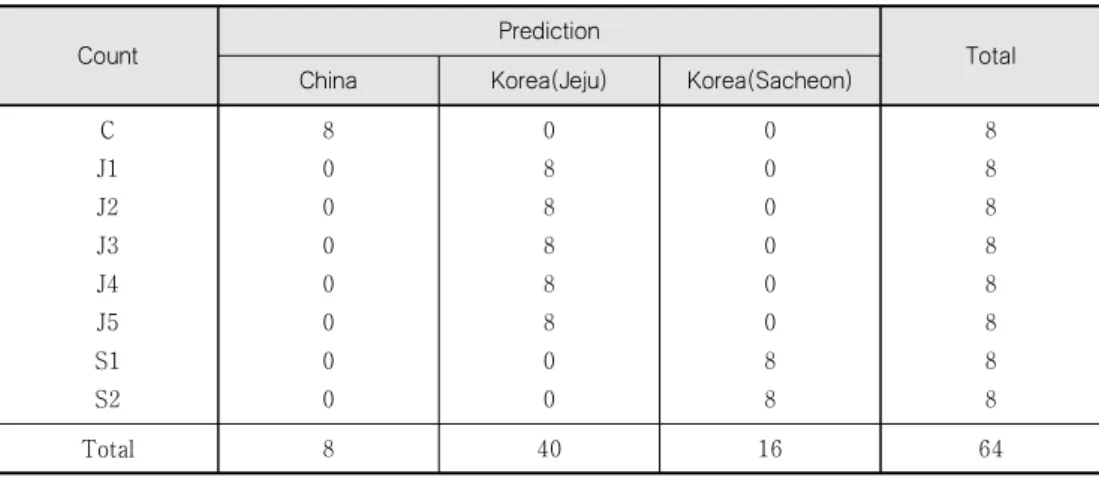
그 결과 중국산 개 제주산 8 , 40 , 개 사천산 16개 반하시료의 예측 원산지가 모두 실제 원산지와 일치하 여 원산지 예측의 정확도는 100%이었다(Table 2). 이전 연구 결과들에서 Chung 등은 RAPD 분석법 과 PCR-RFLP법으로 유전적 유연관계를 분석하여 한국산 반하와 중국산 반하를 판별할 수 있다는 보고를 한 바 있다4). Tae 등은 RAPD를 이용한 반하속 식물의 종간 및 종내 집단간의 유연관계 분석을 통해 반하는 지역별 개체군에 따라 유전적 유연관계가 밀접하게 나타난다고 보고하였으며 이러한 원 인은 생육지의 다양성에 의한 형질분화의 차이로 다양한 잎의 형태와 꽃의 색에 따른 형태학적 변이 및 세포학적 변이 패턴을 보이기 때문으로 추정하고 있다5). 본 FT-IR 스펙트럼 데이터의 분석결과는 이전의 유전적 유연관계 분석에 의한 반하의 지역 개체군간 식별 결과들을 뒷받침해줄 뿐만 아니라 유전자적 변이 양상에 의존하던 반하의 지역 개체군간의 유연관계 분석을 반하의 전세포추출물의 대 사산물의 비교로도 식별할 수 있다는 가능성을 제시해 주었다 본 연구그룹에서는 . FT-IR 스펙트럼 데이터의 다변량 통계분석 기법을 활용하여 고등식물의 종 구분9)및 딸기11), 일일초16)와 인삼17)의 품종 식별이 대사산물의 비교를 통해 가능함을 보고한 바 있다 그러므로 본 . FT-IR 분석 결과는 이전 의 유전적 유연관계 연구결과와 함께 대사체 수준에서의 반하 식물의 원산지별 유연관계 분석 및 구분 체계 확립을 가능하게 할 것이다.
Table 2. The PLS-DA classification results of the of eight Pinellia tubers.
The classification result of the discriminant analysis of the investigated Pinellia samples represented in Figure 1. The discriminant functions were determined using the first seven principal components determined by prin- cipal component analyses. In cross-validation, each case is classified by the functions derived from all other cases; 100.0% of original grouped cases and 100% of cross-validated grouped cases were correctly classified.
Count
Prediction
Total
China Korea(Jeju) Korea(Sacheon)
C J1 J2 J3 J4 J5 S1 S2
8 0 0 0 0 0 0 0
0 8 8 8 8 8 0 0
0 0 0 0 0 0 8 8
8 8 8 8 8 8 8 8
Total 8 40 16 64
결론
본 연구에서는 반하 괴경 시료로부터 얻어진 전세포추출물의 FT-IR 스펙트럼 데이터로부터 PCA와 방법을 이용하여 신속하고 간편하게 원산지를 구분할 수 있었고 의 정확도를 보이는
PLS-DA 100%
예측 체계를 확립하였다 본 연구그룹에서는 본 기술을 통하여 고등식물의 종 구분. 9)및 품종 식별
11,16,17)이 가능함을 보고한 바 있다 이상의 결과를 종합해 보면 . FT-IR 스펙트럼 데이터의 다변량 통계
분석법은 식물의 종 수준에서의 식별뿐 아니라 반하 식물 원산지의 신속한 식별 수단으로 활용이 가능 할 것으로 기대된다 아울러 본 연구에서 확립된 대사체 기반 식별체계는 현재 한약시장에서 유통되고 . 있는 반하를 포함한 한약재들의 지역적 기반 분류체계를 보다 정확한 계통분류학적 분류체계로 재구 축하는데 기여할 수 있을 것이다 더 나아가 이 기술은 아직 표준화가 이루어지지 않은 많은 한약재들. 를 신속하게 평가하고 표준품을 규정하는 수단으로도 활용 가능할 것으로 기대된다.
감사의 글
본 연구는 한국한의학연구원의 생명공학기술 기반 한약자원 생산 다양화 기술 개발‘ ’(K14418) 과제 의 지원에 의해 수행되었습니다.
참고문헌
1. Park MS, Park HK, Kim TS, Kim S, Kim YJ. Development of cultivation with Schizandra chinensis, Eleutherococcus senticosus and Pinellia ternata for the new demand crops. Natio nal Honam Agricultural Experiment Station. Rural Development Administration. Iksan, Kore a. 2000:163-89.
2. Han MH, Yang XW, Zhang M, Zhong GY. Phytochemical study of the rhizome of Pinellia ternata and quantification of phenylpropanoids in commercial Pinellia tuber by RP-LC. Chro matographia. 2006;4:647-53.
3. Kim YJ, Shin YO, Ha YW, Lee S, Oh JK, Kim YS. Anti-obesity effect of Pinellia ternata extra ct in Zucker rats. Biol Pharm Bull. 2006;9:1278-81.
4. Chung HS, Um JY, Kim MS, Hong SH, Kim SM, Kim HK, Park SJ, Kim SC, Hwang WJ, Kim HM. Determination of the site of orign of Pinnelia ternata roots based on RAPD and PCR-RF LP. Hereditas. 2002;136:126-9.
5. Tae KH, Kim DK, Kim JH. Analysis of phylogenetic relationship among Korean Pinellia Teno re (Araceae) using RAPD markers. Korean J Pl Taxon. 2005;35(3):161-74.
6. Williams JGK, Kubelik AR, Rafalski JA, Tingey SV. Genetic analysis with RAPD markers.
In: More gene manipulations in fungi. (eds JWBennett and LLLazur). New York:Academic
NMR. J Exp Bot. 2005;56:255-65.
9. Kim SW, Ban SH, Chung H, Cho SH, Chung HJ, Choi PS, Yoo OJLiu J.R. Taxonomic discrimin ation of higher plants by multivariate analysis of Fourier transform infrared spectroscopy data. Plant Cell Rep. 2004;23:246-50.
10. Ward JL, Harris C, Lewis J, Beale MH. Assessment of 1H NMR spectroscopy and multivari ate analysis as a technique for metabolite fingerprinting of Arabidopsis thaliana. Phytochemi stry. 2003;62:949-57.
11. Kim SW, Min SR, Kim JH, Park SK, Kim TI, Liu JR. Rapid discrimination of commercial strawberry cultivars using Fourier transform infrared spectroscopy data combined by multiv ariate analysis. Plant Biotechnol Rep. 2009;3:87-93.
12. Goodacre R, Timmins M, Burton R, Kaderbhai N, Woodward AM, Kell DB, Rooney PJ. Rapid identification of urinary tract infection bacteria using hyperspectral whole-organism fingerp rinting and artificial neural networks. Microbiology. 1998;144:1157-70.
13. Timmins EM, Howell SA, Alsberg BK, Noble WC, Goodacre R. Rapid differentiation of clos ely related Candida species and strains by pyrolysis-mass spectrometry and Fourier transf orm-infrared spectroscopy. J Clin Microbiol. 1998;36:367-74.
14. Wenning M, Seiler H, Scherer S. Fourier-transform infrared microspectroscopy, a novel and rapid tool for identification of yeasts. Appl Environ Microbiol. 2002;68:4717-21.
15. Kwon YK, Kim SW, Seo JM, Woo TH, Liu JR. Prediction and discrimination of taxonomic relationship within Orostachys species using FT-IR spectroscopy combined by multivariate analysis. J Plant Biotechnol. 2011;38:9 14.–
16. Kim SW, Cho SH, Chung H, Liu JR. Genetic discrimination between Catharanthus roseus cultivars by multivariate analysis of fourier transform infrared spectroscopy data. J Plant Biotechnology. 2007;34:201-5.
17. Kwon YK, Ahn MS, Park JS, Liu JR, In DS, Min BW, Kim SW. Discrimination of cultivation ages and cultivars of ginseng leaves using Fourier transform infrared spectroscopy combine d with multivariate analysis. J Ginseng Res. 2014;38(1):52-8.
18. Fiehn O, Kopka J, Drmann P, Altmann T, Trethewey R, Willmitzer L. Metabolite profiling for plant functional genomics. Nat Biotechnol. 2000;18:1157-61.
19. Trygg J, Holmes E, Londstedt T. Chemometrics in metabonomics. J Proteome Res. 2007;6:
467-79.