J. Exp. Biomed. Sci. 2012, 18(4): 428~434 pISSN : 1738-3226
Effects of the Photic Stimulation on Electroencephalogram in Pediatric Epilepsy Patients
Joong Soo Yoon1 and Hyun Ju Choi2,†
1Department of Biomedical Laboratory Science, Kyungdong University, Bongpo-ri, Toseong-myeon, Goseong-gun, Gangwon-do 219-705, Korea
2Department of Biomedical Laboratory Science, Elderly Life Redesign Institute, Inje University, Gimhae 621-749, Korea
Epilepsy is a chronic neurological disease showing a symptom of repeated seizures without any other physical disorders. Among the diagnostic examination for epilepsy, the electroencephalogram (EEG) has been known as an important test. This study aimed to investigate the EEG with photic stimulation in the pediatric epilepsy patients. They underwent digital sleep and waking EEGs or waking EEGs with photic stimulation. Epilepsy type, seizure history, and season of occurring seizure were analyzed. Epilepsy patients showed more response during the period of photic-on and eye close at the frequency of 10~20 Hz during the EEG activation procedure. Photoparoxysmal response (PPR) was shown in 206 patients out of total 1,551 epilepsy patients. PPR was appeared more frequently during summer and winter seasons, and especially in the patients who had a history of seizure. During the PPR, EEG pattern showed spike (77.18%), theta (9.71%), and spike + theta (13.11%). On the other hand, beta and theta waves were not significantly changed by photic stimulation. However, alpha wave was decreased and delta wave was increased by photic stimulation (P<0.05).
These changes may be due to temporarily altered electrophysiological function of the epileptic patient's brain by the photic stimulation. There was no difference in the EEG pattern between the left and right side in the brain. In conclusion, condition of photic-on with closed eyes and frequency of 10~20 Hz during the procedure of EEG activation could be appropriate for obtaining a definite photoparoxysmal response in the electroencephalogram of the pediatric epilepsy patients.
Key Words: EEG, Epilepsy, Activation method, Photic stimulation
서 론
간질 (epilepsy)은 질병이라기 보다는 뇌기능 장애의 한 증상으로 보여지며 신경원의 억제할 수 없는 갑작스럽고 무질서한 과다한 방전에 의해 임상증상 혹은 뇌파소견 으로 나타나는 복합적인 증상이다(Browne and Feldman, 1985). 뇌파(electroencephalogram, EEG)는 간질을 진단하
고 간질증후군을 결정하며, 난치성 간질의 경우에 수술적 으로 치료할 수 있는 위치를 결정하고 또한 예후를 관찰 하고 치료 효과를 판정하는데 많은 도움을 주고 있다 (Kim and Lee, 1997).
감광성은 자체 간질증후군을 구성하지 않지만(Appleton et al., 2000; Fallah and RamachandranNair, 2009; Shiraishi et al., 2011), 간질 환자에서 약 1.7~10%가 감광성을 보이는 것으로 나타났다(Wolf and Gooses, 1986). 감광성은 비간 질 환자에게서도 나타날 수 있으며(Buchthal and Lennox, 1953; Wolf and Gooses, 1986; Gregory et al., 1993; Quirk et al., 1995; Verrotti et al., 2004; Fallah and RamachandranNair, 2009), 비간질 환자에서 광발작반응을 동반하는 경우 에 약 3%가 2세까지 발작을 일으키는 것으로 보고된 바 있다(Fallah and RamachandranNair, 2009). 광발작반응
*Received: October 23, 2012 / Revised: December 4, 2012 Accepted: December 13, 2012
†Corresponding author: Hyun Ju Choi. Department of Biomedical Laboratory Science, Inje University, Gimhae 621-749, Korea.
Tel: +82-55-320-3665, Fax: +82-55-334-3426 e-mail: [email protected]
○CThe Korean Society for Biomedical Laboratory Sciences. All rights reserved.
Original Article
(photoparoxysmal response, PPR)은 1세에서 16세까지의 소 아 환자에서 7.6%가 나타났으며, 광발작반응을 보이는 환자의 성별을 살펴보면 여자가 남자보다 더 많은 반응 이 나타나는 것으로 알려져 있다(Shiraishi et al., 2001). 광 발작반응은 일반적인 유형이 원인불명이나 증상들이 나 타나는 초점성 간질보다 전반성 간질에서 더 잘 나타나 고 (Lu et al., 2008), 각성상태에서의 대발작 간질 환자에 서도 감광성이 높은 비율로 나타났다(Wolf and Gooses, 1986). 광발작반응이 발생하는 것은 계절에 따라서 차이 가 있는데, 여름철에는 증가하고 겨울철에 감소하는데 그 이유가 일조량 증가와 관계가 있다고 한다(Danesi, 1998).
그러나 광발작반응이 계절과 관계없다고 연구 보고도 있 었다 (Scott et al., 1985).
뇌파검사는 명확한 이상 신경활동 상태를 나타내므로 간질을 진단하는 데에 있어서 중요한 방법이다. 뇌파를 측정할 적에 정상 또는 비정상적인 뇌파활동을 유발하기 위하여 다양한 유발법을 사용하는데 예를 들면 광자극, 과호흡, 개폐안, 정신적 활동, 수면 그리고 수면박탈 등 이 있다. 본 연구는 광자극 유발법을 사용하여 소아간질 환자와 광자극반응과의 관계를 확인하고자 하는 목적으 로 수행되었다.
재료 및 방법
대상자
2009년 1월부터 2010년 12월 사이에 서울 소재의 모대 학병원에서 1,551명 소아간질 환자를 대상으로 광자극과 기본뇌파를 실시하였다. 검사를 받은 환자의 보호자에게 결과를 연구 논문 목적으로 사용하기 위한 동의를 받았다.
뇌파 분석
뇌파 측정은 기본 19채널 디지털 뇌파기(Grass tech- nologies, West Warwick, Rhode Island)를 사용하여 국제 10-20법에 근거하여 수행하였다. 소음, 조명, 전자파, 온 도 , 습도 및 환기가 적절하게 유지된 뇌파실에서 광자극 기 (photic stimulator, Grass technologies, West Warwick, Rhode Island)를 사용하여 광자극을 하였고 램프 거리는 눈 앞에 서 약 25 cm 이었다(Brwone and Feldman, 1985; Kim and Lee, 1997). 플래시 주파수는 2, 3, 10, 12, 15, 20, 25 Hz이었 고 10초마다 사용되었다. 각 10초 기간 동안에는 개안상 태, 폐안상태의 두 가지 조건으로 한 번씩 검사하였다.
즉, 광자극이 시작되면 환자는 눈을 뜨고 감는 동작을
하며 광자극이 끝날 때까지 지시를 받았다. 뇌파검사는 20분간 지속적으로 기록하였다. 뇌파 파형은 alpha, beta, theta, delta wave, spike, spike + theta(극서파 복합파)를 분 석하였다 . 한편, 광자극이 종료된 후 100 msec 뒤부터 spike 또는 spike and slow wave complex가 나타나는 prolonged PPR(지속적 광발작반응)을 관찰하였고, 광자극 이 종료된 후 100 msec 전에 반응이 끝나는 self-limited PPR(제한적 광발작반응)도 관찰하였다. 모든 뇌파 데이터 는 광자극 전과 광자극 후의 데이터를 비교 분석하였다.
통계 분석
모든 데이터는 평균(mean) ± 표준편차(SD)로 나타내었 고 , SPSS 프로그램(version 12.0, SPSS, Chicago, IL)을 사용 하여 Chi-square test와 Paired t-test를 유의수준 P<0.05으
Table 1. Gender of the photic stimulation responders among in total epilepsy patients
Gender Male
n (%) Female n (%)
Total n (%) PPR 95 (10.94%) 111 (16.25%) 206 (13.28%) Total patients 868 683 1,551 PPR: photoparoxysmal responders among epilepsy patients n (%): number of patients (percent of total patients)
No significance was shown in gender distribution of photopar- oxysmal responders by Chi-Square test.
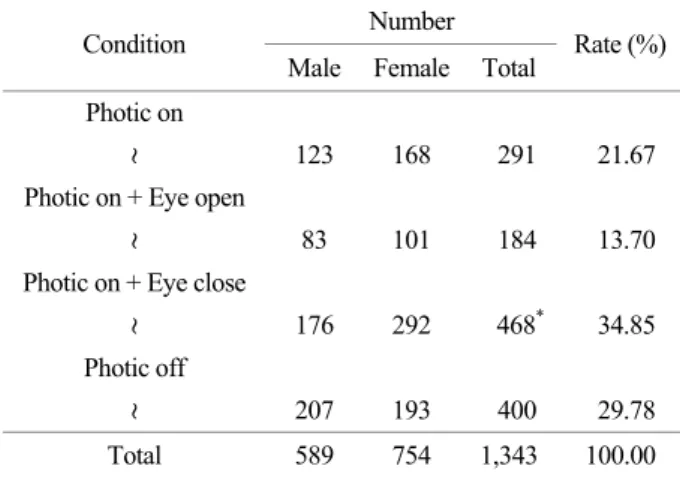
Table 2. Number and rate of the epilepsy patients under the conditions of open and close eyes during the photic stimulation
Number Condition
Male Female Total Rate (%) Photic on
123 168 291 21.67
Photic on + Eye open
83 101 184 13.70
Photic on + Eye close
176 292 468* 34.85 Photic off
207 193 400 29.78
Total 589 754 1,343 100.00 Condition: photic stimulator was on or off, patient's eyes were open or close during the EEG activation procedure.
Rate (%): {(male number + female number) / total number} × 100
*: Significance was shown among the conditions by Chi-Square test at P<0.001.
로 하여 통계 분석하였다.
결과 및 고찰
본 연구에서는 간질 환자 1,551명(남자 868명, 여자 683명) 중 206명(13.28%)이 광발작반응을 나타내었고, 남 자는 10.94%, 여자는 16.25%의 비율을 나타내어 통계적 으로 유의한 차가 없었다(P>0.05, Table 1). 또한 광자극 동안 개 · 폐안(34.85%)은 광자극반응과 상태간에 통계적
으로 의미 있는 차이를 보였고(P<0.001, Table 2), 가장 높은 분포는 10~20 Hz (67.07%)에서 나타났다(P<0.001, Table 3). 64명의 환자는 여름에 광발작반응을 나타내었고 75명의 환자는 겨울에 광발작반응이 나타났는데(Table 4), 이는 광발작반응이 계절과 관련하여 유의한 차이가 있는
Table 3. Frequency of the photic stimulation in the epilepsy patients
Gender
Male Female Total Frequency
(Hz)
Number Rate (%) Number Rate
(%) Number Rate (%) 2 42 12.61 37 9.00 79 10.62 3 40 12.01 45 10.95 85 11.42 10 56 16.82 79 19.22 135* 18.15 12 50 15.02 80 19.46 130* 17.47 15 60 18.02 66 16.06 126* 16.94 20 47 14.11 61 14.84 108* 14.52 25 38 11.41 43 10.46 81 10.89 Total 333 100.00 411 100.00 744 100.00 EEG was measured for 2 minutes and 20 seconds per each frequency.
Number: patient number measured EEG at each frequency Rate (%): {(male number or/and female number) / total number}
× 100
*: Significance was shown among the frequencies by Chi-Square test at P<0.001.
Table 4. Seasonal distribution of the photoparoxysmal responders in the epilepsy patients
Number Season
Male Female Total Rate (%) Spring 11 17 28 13.59 Summer 33 31 64* 31.07 Autumn 19 20 39 18.93 Winter 32 43 75* 36.41
Total 95 111 206 100.00
Rate (%): {(male number + female number) / total number} × 100
*: Significance was shown among the seasons by Chi-Square test at P<0.001.
Table 5. Waveform of the electroencephalogram in the photo- paroxysmal responders among the epilepsy patients
Number Wave form
Male Female Total Rate (%)
Theta 10 10 20* 9.71
Spike 71 88 159* 77.18 Spike & theta 14 13 27* 13.11
Total 95 111 206 100.00
Rate (%): {(male number + female number) / total number} × 100
*: Significance was shown among all the wave forms by Chi- Square test at P<0.001.
Table 6. Seizure history in the prolonged and self-limited photoparoxysmal responders among the epilepsy patients PPRs
Prolonged Self-limited Number Number Seizure history.
Male Female Total n (%) Male Female Total n (%)
Total n (%)
+ 67 62 129 (63.24%) 27 48 75 (36.76%) 204 (99.03%)*
- 1 0 1 (100%) 0 0 0 1 (0.49%)
Unknown 0 1 1 (100%) 0 0 0 1 (0.49%)
Total 68 63 131(63.59%) 27 48 75 (36.41%) 206 (100%) PPRs: photoparoxysmal responders
n (%): number of patients (percent of total patients)
*: Significance was shown in comparison with negative (-) seizure history and unknown seizure history by Chi-Square test at P<0.001.
Table 7. Right hemisphere changes in total EEG power of the photoparoxysmal responders before and after photic stimulation 95% confidence level
(Before-After)
Mean S.D. Mean
S.D. Lower limit Upper limit t df P Delta -3.52549 8.63173 2.22870 -8.30559 1.25460 -1.582 14 .136 Theta -.39113 8.39281 2.16701 -5.03891 4.25666 -.180 14 .859 Alpha 2.67185 5.32892 1.37592 -.27920 5.62291 1.942 14 .073 F
Beta .42411 3.51962 .90876 -1.52499 2.37321 .467 14 .648 Delta -.04331 9.22843 2.38277 -5.15384 5.06723 -.018 14 .986 Theta -2.55368 5.40995 1.39684 -5.54961 .44225 -1.828 14 .089 Alpha 3.31627 5.93648 1.53279 .02876 6.60379 2.164 14 .048* T
Beta -.10149 3.74281 .96639 -2.17419 1.97121 -.105 14 .918 Delta -2.29859 9.21294 2.37877 -7.40055 2.80336 -.966 14 .350 Theta -1.90012 11.26744 2.90924 -8.13982 4.33958 -.653 14 .524 Alpha 4.02726 7.21846 1.86380 .02981 8.02471 2.161 14 .049* P
Beta -.07957 3.37352 .87104 -1.94777 1.78863 -.091 14 .929 Delta -5.45237 9.06320 2.34011 -10.47141 -.43334 -2.330 14 .035* Theta -.18810 5.28630 1.36492 -3.11555 2.73936 -.138 14 .892 Alpha 7.83415 7.15620 1.84772 3.87118 11.79713 4.240 14 .001**
O
Beta -.36365 2.14990 .55510 -1.55422 .82693 -.655 14 .523 F, frontal lobe; T, temporal lobe; P, parietal lobe; O, occipital lobe
*P<0.05 by paired t-test (compared the EEG powers measured before photic stimulation with the EEG powers measured after photic stimulation)
**P<0.01 by paired t-test (compared the EEG powers measured before photic stimulation with the EEG powers measured after photic stimulation)
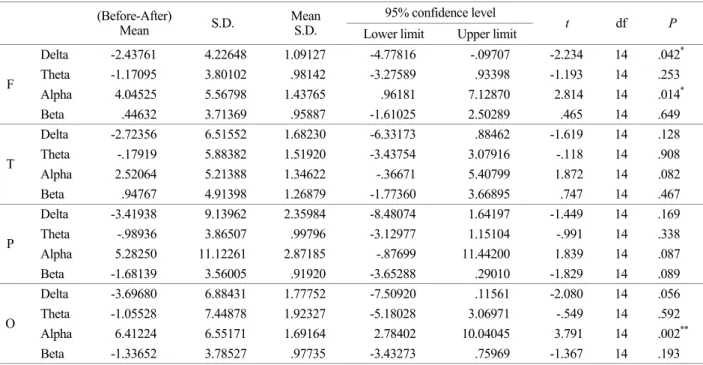
Table 8. Right hemisphere changes in total EEG power of the non-photoparoxysmal responders before and after photic stimulation 95% confidence level
(Before-After)
Mean S.D. Mean
S.D. Lower limit Upper limit t df P Delta -2.43761 4.22648 1.09127 -4.77816 -.09707 -2.234 14 .042* Theta -1.17095 3.80102 .98142 -3.27589 .93398 -1.193 14 .253 Alpha 4.04525 5.56798 1.43765 .96181 7.12870 2.814 14 .014* F
Beta .44632 3.71369 .95887 -1.61025 2.50289 .465 14 .649 Delta -2.72356 6.51552 1.68230 -6.33173 .88462 -1.619 14 .128 Theta -.17919 5.88382 1.51920 -3.43754 3.07916 -.118 14 .908 Alpha 2.52064 5.21388 1.34622 -.36671 5.40799 1.872 14 .082 T
Beta .94767 4.91398 1.26879 -1.77360 3.66895 .747 14 .467 Delta -3.41938 9.13962 2.35984 -8.48074 1.64197 -1.449 14 .169 Theta -.98936 3.86507 .99796 -3.12977 1.15104 -.991 14 .338 Alpha 5.28250 11.12261 2.87185 -.87699 11.44200 1.839 14 .087 P
Beta -1.68139 3.56005 .91920 -3.65288 .29010 -1.829 14 .089 Delta -3.69680 6.88431 1.77752 -7.50920 .11561 -2.080 14 .056 Theta -1.05528 7.44878 1.92327 -5.18028 3.06971 -.549 14 .592 Alpha 6.41224 6.55171 1.69164 2.78402 10.04045 3.791 14 .002**
O
Beta -1.33652 3.78527 .97735 -3.43273 .75969 -1.367 14 .193 F, frontal lobe; T, temporal lobe; P, parietal lobe; O, occipital lobe
*P<0.05 by paired t-test (compared the EEG powers measured before photic stimulation with the EEG powers measured after photic stimulation)
**P<0.01 by paired t-test (compared the EEG powers measured before photic stimulation with the EEG powers measured after photic stimulation)
Table 9. Left hemisphere changes in total EEG power of the photoparoxysmal responders before and after photic stimulation 95% confidence level
(Before-After)
Mean S.D. Mean
S.D. Lower limit Upper limit t df P Delta -1.87607 10.28034 2.65437 -7.56913 3.81699 -.707 14 .491 Theta -1.37160 13.11828 3.38713 -8.63626 5.89307 -.405 14 .692 Alpha 3.71078 3.62261 .93536 1.70465 5.71692 3.967 14 .001**
F
Beta .27363 2.93548 .75794 -1.35198 1.89925 .361 14 .723 Delta -2.55853 9.45894 2.44229 -7.79671 2.67966 -1.048 14 .313 Theta -2.23339 8.59548 2.21934 -6.99341 2.52663 -1.006 14 .331 Alpha 5.98002 4.47538 1.15554 3.50164 8.45841 5.175 14 .001**
T
Beta -1.56923 4.12047 1.06390 -3.85107 .71261 -1.475 14 .162 Delta -4.97242 14.36928 3.71013 -12.92986 2.98502 -1.340 14 .202 Theta -1.67078 11.15080 2.87912 -7.84589 4.50432 -.580 14 .571 Alpha 7.43163 6.93656 1.79101 3.59029 11.27297 4.149 14 .001**
P
Beta -1.94422 3.85430 .99518 -4.07866 .19022 -1.954 14 .071 Delta -2.73833 10.28220 2.65485 -8.43243 2.95576 -1.031 14 .320 Theta -.65581 6.64565 1.71590 -4.33605 3.02442 -.382 14 .708 Alpha 3.36535 8.62216 2.22623 -1.40944 8.14015 1.512 14 .153 O
Beta -.13589 3.19488 .82491 -1.90516 1.63338 -.165 14 .872 F, frontal lobe; T, temporal lobe; P, parietal lobe; O, occipital lobe
**P<0.01 by paired t-test (compared the EEG powers measured before photic stimulation with the EEG powers measured after photic stimulation)
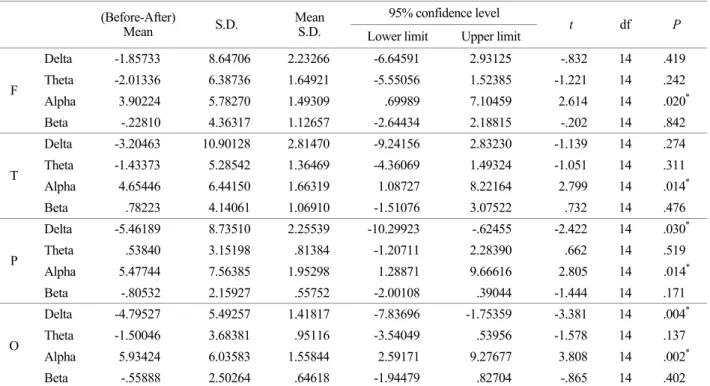
Table 10. Left hemisphere changes in total EEG power of the non-photoparoxysmal responders before and after photic stimulation 95% confidence level
(Before-After)
Mean S.D. Mean
S.D. Lower limit Upper limit t df P Delta -1.85733 8.64706 2.23266 -6.64591 2.93125 -.832 14 .419 Theta -2.01336 6.38736 1.64921 -5.55056 1.52385 -1.221 14 .242 Alpha 3.90224 5.78270 1.49309 .69989 7.10459 2.614 14 .020* F
Beta -.22810 4.36317 1.12657 -2.64434 2.18815 -.202 14 .842 Delta -3.20463 10.90128 2.81470 -9.24156 2.83230 -1.139 14 .274 Theta -1.43373 5.28542 1.36469 -4.36069 1.49324 -1.051 14 .311 Alpha 4.65446 6.44150 1.66319 1.08727 8.22164 2.799 14 .014* T
Beta .78223 4.14061 1.06910 -1.51076 3.07522 .732 14 .476 Delta -5.46189 8.73510 2.25539 -10.29923 -.62455 -2.422 14 .030*
Theta .53840 3.15198 .81384 -1.20711 2.28390 .662 14 .519 Alpha 5.47744 7.56385 1.95298 1.28871 9.66616 2.805 14 .014* P
Beta -.80532 2.15927 .55752 -2.00108 .39044 -1.444 14 .171 Delta -4.79527 5.49257 1.41817 -7.83696 -1.75359 -3.381 14 .004* Theta -1.50046 3.68381 .95116 -3.54049 .53956 -1.578 14 .137 Alpha 5.93424 6.03583 1.55844 2.59171 9.27677 3.808 14 .002* O
Beta -.55888 2.50264 .64618 -1.94479 .82704 -.865 14 .402 F, frontal lobe; T, temporal lobe; P, parietal lobe; O, occipital lobe
*P<0.05 by paired t-test (compared the EEG powers measured before photic stimulation with the EEG powers measured after photic stimulation)
것을 의미한다. 뇌파 파형을 살펴보면 theta가 9.71%, spike가 77.18%, spike & theta파가 13.11%로써 spike의 출 현이 가장 높은 것으로 나타났다(P<0.001, Table 5). 또한 광발작반응은 발작의 경험과 통계적으로 의미 있는 차이 를 보였는데, 발작의 경험이 많은 환자일수록 광발작반응 이 높은 빈도로 나타났다(P<0.001, Table 6).
한편 EEG 기본 뇌파인 알파, 베타, 세타, 델타파를 살 펴보면 다음과 같다. 광발작반응군의 우반구(Table 7)에서 알파파는 측두엽(P<0.05), 두정엽(P<0.05), 후두엽(P<
0.01)에서 광자극 후에 감소하고 있어서 의미있는 뇌파 변화를 보이고 있다. 또한 델타파도 후두엽에서 광자극 전과 후 사이에 뇌파 변화에 있어서 통계적으로 의미 있 는 차이를 보이고 있는데, 광자극 후에 델타파가 증가하 였다 (P<0.05). 한편 비 광발작반응군의 우반구(Table 8)에 서는 알파파와 델타파가 광자극 전, 후 사이에 통계적으 로 의미 있는 차이를 보였다. 즉 알파파는 전두엽에서는 광자극 후에 감소하였고(P<0.05), 후두엽에서도 유의적 으로 감소하였다(P<0.01). 한편 델타파는 전두엽에서 광 자극 후에 증가하였다(P<0.05, Table 8).
좌반구를 살펴보면 광발작반응군에서 알파파가 전두엽, 측두엽, 두정엽에서 광자극 후에 감소하여 통계적으로 의 미 있는 차이를 보였다(P<0.01, Table 9). 한편 비 광발작 반응군의 좌반구에서는 알파파는 전두엽, 측두엽, 두정 엽 , 그리고 후두엽에서 광자극 후 감소하여 통계적으로 의미있는 차이를 보였고, 델타파는 두정엽과 후두엽에서 광자극 후에 증가하여 통계적으로 의미 있는 차이를 보 였다 (P<0.05, Table 10). 이와 같이 기본 뇌파 파형의 변화 를 살펴보는 것은 광자극으로 뇌파 진단을 하는 환자에 있어서 치료향상과 연구에 도움을 주는 것으로 보고된 바 있다(Kasteleijin-Nolst Trenit'e DGA et al., 1999). 다른 연 구 보고에 의하면 sharp wave와 초점성 slow wave 비정 상 뇌파 파형이 간헐적인 광자극반응으로서 나타난다고 보고된 바 있다(Ahmed et al., 2006). 한편 광자극 반응은 소아청소년이 어른들보다 더 많은데, 이는 소아청소년 시 기가 가장 감광성이 높기 때문이다(Alberto et al., 2004).
본 연구는 소아간질 환자에게서 발생되는 비정상적인 파형을 유도하는데 광자극이 유용하다는 것을 증명하였 다. 이유는 확실하진 않지만 광발작반응의 주파수가 간질 환자 중 남자보다 여자에게서 더 많이 나타났다. 광발작 반응은 다른 계절과 비교할 때 겨울에 더 많이 나타났다.
이 연구의 결과는 광자극 중 개, 폐안의 실시와 10~20 Hz의 광자극이 비정상 뇌파를 유도하는데 유용하다는 것
을 보여주었다. 또한 전두엽, 측두엽, 두정엽, 그리고 후 두엽의 모든 위치에서 광자극 후에 알파파가 감소하였다.
베타파와 세타파가 크게 변화되지 않았지만 델타파가 광 자극 후 증가하였다. 따라서 통계적으로 의미 있는 변화 는 알파파의 감소와 델타파의 증가였다. 한편 좌뇌와 우 뇌 사이의 뇌파 패턴에는 큰 차이가 없었다. 결론적으로 광자극 유발법을 실행하는 과정에서 눈을 뜨고 감는 것 과 10~20 Hz 주파수의 광자극이 간질 소아 환자의 뇌파 에서 광발작반응을 명확하게 판정하기 위하여 적합한 것 으로 나타났다.
REFERENCES
Ahmed SN, Unterman J, McCloskey B, Sinclair DB. Clinical significance of photic stimulation during routine EEGs of adult patients. Am J Electroneurodiagnostic Technol. 2006.
46: 356-362.
Appleton R, Beirne M, Acomb B. Photosensitivity in juvenile myoclonic epilepsy. Seizure. 2000. 9: 108-111.
Browne TR, Feldman RG. Epilepsy. 1985. Little, Brown, Boston.
Buchthal F, Lennox WG. The EEG effect of Metrazol and photic stimulation in 682 normal subjects. Electroencephalogr Clin Neurophysiol. 1953. 5: 545-558.
Danesi MA. Seasonal variations in the incidence of paroxysmal response to stimulation among photosensitive epileptic patients.
J Neurol Neurosurg Psychiatry. 1998. 51: 87-877.
Fallah A, RamachandranNair R. Does photoparoxysmal response in children represent provoked seizure? Evidence from simultaneous motor task during EEG. Clin Neurol Neurosur.
2009. 111: 147-150.
Gregory RP, Oates T, Merry RTG. Electroencephalogram epilepti- form abnormalities in candidates for aircrew training.
Electroencephalogr Clin Neurophysiol. 1993. 86: 75-77.
Kasteleijn-Nolst Trenit´e DG, Binnie CD, Harding GF, Wilkins A.
Photic stimulation: standardization of screening methods.
Epilepsia. 1999. 40(suppl.4): 75-79.
Kim SS, Lee KS. A study of EEG on epileptic patients. J Korean Child Neurol Soc. 1997. 4: 124-136.
Lu Y, Waltz S, Stenzel K, Muhle H, Stephani U. Photosensitivity in epileptic syndromes of childhood and adolescence. Epileptic Disord. 2008. 10: 136-143.
Quirk JA, Fish DR, Smith SJ, Sander JW, Shorvon SD, Allen PJ.
Incidence of photosensitive epilepsy: a prospective national study. Electroencephalogr Clin Neurophysiol. 1995. 95: 260
-267.
Scott DF, Thulong PF, Moffat AM, Harding GFA. Is sunshine protective in photosensitive epilepsy?. Electroencephalorgr Clin Neurophysiol. 1985. 61: 216-217.
Shiraishi H, Fujiwara T, Inoue Y, Yaki K. Photosensitivity in relation to epileptic syndromes: a survey from an Epilepsy Center in Japan. Epilepsi. 2001. 42: 393-397.
Verrotti A, Trotta D, Salladini C, Di Corcia G, Latini G, Cutarella R, Chiarell F. Photosensitivity and epilepsy: a follow-up study.
Developmental Medicine & Child Neurology, Cambridge University Press, 2004. 46: 347-351.
Wolf P, Gooses R. Relation of photosensitivity to epileptic syndromes. J Neurol Neurosurg Psychiatry. 1986. 49: 1368 -1391.