서
론
식품의 원재료는 수확, 가공, 저장 및 유통과정을 거치 면서 여러 가지 요인으로 인해 미생물이나 해충 등의 혼입이 수반된다. 식품원료의 미생물이나 해충의 살균 ─ ─ 27 ──Photostimulated Luminescence (PSL)
방법에 의한 국내 유통
분말형 식품가공원료의 방사선 조사 여부 모니터링
윤혜정∙허정무1∙양수형1∙이병헌1∙권중호∙김동호1,* 경북대학교 식품공학과, 1한국원자력연구원 방사선과학연구소Identification of Irradiated Food Additives by
Photostimulated Luminescence (PSL) Method
Hyejeong Yun, Jungmu Hur1, Suhyung Yang1, Byoung-Hun Lee1, Joong-Ho Kwon and Dongho Kim1,*
Department of Food Science and Technology, Kyungpook National University, Daegu 702-701, Korea
1Advanced Radiation Technology Institute, Korea Atomic Energy Research Institute,
Jeongeup 580-185, Korea
Abstract -- Photostimulated luminescence (PSL), electron spin resonance (ESR) and
thermolu-minescence (TL) analyses were conducted to detect whether 258 kinds of extracted and powdered forms food additives were irradiated or not. In a view of the PSL results, 9 kinds of the extracted and powdered samples (3.2%) showed over 5,000 photon counts (60 sec)--1and these samples were
judged to be irradiation-positive. Thirty nine kinds of the samples (15.6%) yielded 700~~5,000
pho-ton counts (60 sec)--1and these samples were grouped into irradiation-potential, while the samples
showed below 700 photon counts (60 sec)--1sec were judged to be irradiation-negative. TL glow
cur-ves for minerals separated from 5 samples were detected at 150��C with high intensity. However, TL analysis did not apply to other irradiation-positive and irradiation-potential samples because the minerals for TL detection were not separated from the samples. ESR measurements for irra-diation-positive and irradiation-potential samples, judged by PSL detection, showed no specific signals to irradiation. The results indicated that PSL could be applied to identify irradiation treatment of extracted and powdered food additives, while TL was optional and ESR was not suit-able for detection extracted and powdered food additives.
Key words : Gamma irradiation, PSL, ESR, TL, Food additives
* Corresponding author: Dongho Kim, Tel. +82-63-570-3140, Fax. +82-63-570-3149, E-mail. [email protected]
및 방제를 위해 다양한 기술이 적용되어 왔으며 그 중 에서도 특히 열처리와 훈증방법 (ethylene oxide gas, PH3 및 MeBr)이 가장 보편적으로 사용되었다. 그러나 열 살 균은 식품고유의 품질특성이 변화되는 문제점이 있으며, 훈증살균은 잔류독성과 환경오염 등의 문제점으로 인해 국제적으로 점차 그 사용이 금지 또는 제한되고 있는 추세이다 (UNEP 1995; Kwon et al. 2000). 한편, 식품의 방사선 조사는 살균, 살충, 생장 조절, 물성 개선 등에 대 한 기술적인 효과와 더불어 안전성 또한 국제적으로 검 증되어 적용범위가 점차 확대되고 있으며, 현재 세계 50 여 개국에서 230여 품목의 식품에 대하여 사용이 허가 되어 있다 (IAEA 2005). 국내에서는 식품의 발아 억제, 살충, 살균 및 숙도 조절의 목적으로 감마선 조사를 실 시하고 있으며, 감자, 밤 등의 신선 식품과 복함 조미식 품을 포함한 건조식품 및 가공용 원료들에 한하여 0.15 ~10 kGy 범위의 조사선량이 허가되어 있다 (KFDA 2005). 조사 식품 (irradiated food)의 교역이 증대됨에 따 라 관련 국가 및 국제기구를 중심으로 방사선 검역처리 표준화가 진행되고 있으며, 이와 함께 방사선 조사 식품 의 안전한 유통관리를 위한 검지기술이 요구되고 있다 (Delincee 2002; Kwon 2005). 방사선조사식품의 일반적인 검지방법으로는 free
radi-cal의 농도를 측정하는 전자스핀공명측정 (electron spin
resonance, ESR) (Raffi and Benzaria 1993; Nam et al. 2001; Lee and Yang 2002), 혼입 미네랄의 광자극과 열 발광 원 리를 이용한 열발광측정 (thermoluminescence, TL) (Odu-ko and Spyrou 1990; Soika and Delincee 2000), 광자극 발 광측정 (photostimulted luminescence, PSL) (Chung et al.
2000) 등을 이용한 물리적 방법이 주로 이용되고 있으
며, 지방질을 포함한 식품의 경우 hydrocarbone류 (More-house et al. 1993) 및 2-alkylclobutanone류 (Boye et al. 1991; Stevenson et al. 1993)를 GC, GC/MS를 이용하는 화학적인 방법과 DNA comet assay (McKelvey-Martin et
al. 1993; Cerda et al. 1997) 등 생물학적 방법도 이용되고 있다. 이 중 물리적 방법이 비교적 신속성과 정확성이 높아 농산물 및 건조식품, 수분 함유 식품 등에 널리 적 용하고 있다 (Morehouse et al. 1993; Chung et al. 2000). 방사선 조사식품의 산업적 적용확대와 안전한 유통, 그 리고 소비자의 선택권 보장을 위해서는 감마선 조사식 품의 표시가 중요한데 이를 위해서는 위와 같은 방사선 조사식품의 검지기술 확립이 필수적이다. 본 연구에서는 국내 식품제조업체에 사용 중인 곡류 및 전분류, 채소 및 과일류, 생선, 육류 및 콩류 및 향신 류 등의 건조 또는 분말형의 식품원료 및 첨가물 250여 품목에 대하여 방사선 조사여부를 모니터링 함으로써, 방사선 조사 식품원료의 효율적 관리방안 수립을 위한 기초자료를 제공하고자 하였으며 아울러 물리적 검지 방법인 PSL, ESR 및 TL 분석의 적용 가능성을 확인하고 자 하였다.
재료 및 방법
1. 시료 및 감마선 조사 본 실험에 사용된 곡류 및 전분류 (51종), 채소 및 과 일류 (30종목), 생선, 육류 및 콩류 (26종), 향신료 (54종), 천연물 추출물 (31종), 기능성 성분 (57종) 및 기타 품 목 (10종)은 국내 식품제조업체 5곳으로부터 직접 구입 하여 사용하였다. 방사선 조사 대조시료의 감마선 조사 는 한국원자력연구소의 선원 11.1 PBq, 60Co 감마선 조사시설(AECL, IR-79, MDS Nor-dion International Co. Ltd., Ottawa, ON, Canada)을 이용하여 20�C의 실온에서 분당
70 Gy의 선량률로 1 kGy의 총 흡수선량을 얻도록 하였 다. 흡수선량의 확인은 ceric/cerous dosimeter를 사용하 였으며, 총 흡수선량의 오차는 ±5.4% 이내로 하였다. 2. Photostimulated luminescence (PSL) 분석 시료의 PSL 분석은 CEN (2001) 방법에 준하여 실시하 였다. 본 실험에서는 제어장치와 sample chamber 및 detector head assembly로 구성된 PSL system (serial; 0021, SURRC: Scottish Universities Research and Reactor Cen-tre, UK)을 사용하였다. PSL system의 제어장치는 근적 외선 발광 다이오드에 의해 발생되는 근적외선 발생장 치로 구성되며, 조사 시료로부터 발광된 빛에너지는
bialkali cathode 광증폭관에서 증폭되어진 다음 측정된
빛에너지의 양을 계수화한다. 시료의 분석은 5 g 정도의 시료를 직경 50 mm 직경의 petri dish (Bibby Sterilin type
122)에 담아 sample chamber에 넣은 다음 초마다 방사
되는 빛의 양을 60초 동안 측정하여 합산한 측정값(accu-mulated photon count: APC)으로 조사 유무를 판단하였 다. 측정 조건은 cycle time 1 sec, cycle 횟수 60, dark count 27.7±3.9 그리고 light count 34.5±2.0이었다. 측정 결과 의 판정에서 lower threshold value (T1)는 700 counts (60 sec)-1, upper threshold value (T
2)는 5,000 counts (60 sec)-1 이었으며, T1이하의 값은 비조사 시료 (negative)로 T2이 상이면 방사선 조사 시료 (positive)로 판별하였으며, 700 ~5,000 counts (60 sec)-1사이의 값은 intermediate로 하여
타 검지방법의 적용이 필요한 것으로 판정하였다(Sch-reiber 1996; Sanderson et al. 1998).
Cereals and starch
corn starch (Korea) 428.01)±127.02)(-)
wheat flour for noodle1 332.7±81.3 (-)
wheat flour for noodle2 338.0±37.2 (-)
wheat flour for ramyun 440.0±104.7 (-)
buck-wheat flour1 419.5±26.2 (-) buck-wheat flour2 1456.0±953.6 (±)3) buck-wheat flour3-premium 490.0±10.4 (-) gluten (Australia) 1139.0±394.4 (±) gluten (Europe) 292.0±45.3 (-) denatured starch1 443.0±6.1 (-) denatured starch2 419.3±110.3 (-) starch, tapioca 453.3±61.1 (-)
starch, sweet potato 618.7±201.5 (-)
muco-polysaccharide 471.0±263.5 (-)
tender starch (Korea) 464.0±82.1 (-)
glumestar starch (Japan) 411.0±28.6 (-)
starch, potato (China) 411.3±129.7 (-)
barley (Korea) 288.3±81.1 (-)
Indian millet (Korea) 368.3±51.8 (-)
corn (Korea) 364.0±51.0 (-)
adlay (Korea) 327.0±48.7 (-)
glutinous millet (Korea) 326.0±9.6 (-)
wheat, whole (Korea) 343.7±50.1 (-)
chinese millet (Korea) 310.3±131.5 (-)
glutinous rice (Korea) 388.3±43.7 (-)
uncleaned rice (Korea) 323.7±43.1 (-)
pumpkin powder (Korea) 508.7±313.6 (-)
potato powder (Korea) 563.7±398.6 (-)
sweet potato powder (Korea) 277.3±59.9 (-)
chestnut powder (Korea) 942.7±311.7 (±)
corn powder 291.5±147.8 (-)
milk sugar 318.0±79.2 (-)
glucose 310.5±7.8 (-)
fructo-oligo saccharide 304.0±59.4 (-)
trehalos 387.0±11.3 (-)
glucose, hydrous (Korea) 578.7±325.7 (-)
maltodextrin (Korea) 530.7±189.9 (-)
glucose, unhydrous 298.5±14.8 (-)
fermented sugarcane, powder 441.0±128.7 (-)
fructose, powder 314.0±62.2 (-)
rice embryo bud extract 365.0±77.2 (-)
erythritol 253.5±78.5 (-) maltodextrin 283.0±24.0 (-) maltitol powder 388.0±12.0 (-) xylitol 348.5±14.8 (-) inositol 581.0±90.5 (-) inulin 934.3±438.3 (±) cellulose 319.0±155.6 (-) wheat powder 508.5±128.0 (-)
scorched rice, powder 518.0±12.7 (-)
brown sugar (China) 325.0±82.7 (-)
Vegetables and fruits
brown seaweed (Korea) 421.7±18.1 (-)
sea tangle (Korea) 819.7±187.0 (±)
sea tangle, powder (Korea) 578.0±86.9 (-)
onion powder (Korea) 215.7±68.3 (-)
onion powder, roasted (China) 496.3±96.6 (-)
orange powder 410.0±36.81)(-)
spirulina 370.5±7.0 (-)
grape, powder 447.0±19.8 (-)
grape seed extract 441.5±17.7 (-)
prune powder 213.5±59.1 (-)
wormwood powder 535.0±7.0 (-)
chlorella 328.0±62.2 (-)
chlorella extract 1161.5±408.0 (±)
brown seaweed powder 334.0±31.1 (-)
strawberry powder 322.0±90.5 (-)
lemon extract powder 380.0±14.1 (-)
mango juice powder 368.5±40.3 (-)
Japanese apiricot extract 302.0±41.0 (-)
red wine powder 316.0±97.6 (-)
orange extract powder 1375.0±275.8 (±)
pomegranate powder 893.0±48.1 (±)
sea tangle powder 768.5±71.4 (±)
carrot extract powder 289.0±86.3 (-)
dried laver 346.5±154.9 (-)
fermented vegetable extract 455.5±139.3 (-)
radish powder (Korea) 490.3±154.8 (-)
radish powder, seasoned (Korea) 247.7±175.5 (-)
pyogo mushroom (China) 202.7±127.1 (-)
pyogo mushroom (Korea) 395.7±19.3 (-)
Indian gooseberry 259.5±17.7 (-)
Fish, meat poultry and soybean
egg white powder (India) 419.7±156.4 (-)
kokumi (Japan) 921.0±220.0 (±)
cod fish extract powder (Korea) 331.0±136.2 (-)
beef powder (Korea) 456.0±50.5 (-)
chicken stock powder (Korea) 718.3±43.5 (±)
soybean milk powder (USA) 326.0±124.4 (-)
black bean (Korea) 565.3±143.5 (-)
white bean (Korea) 499.0±45.8 (-)
red bean (Korea) 453.7±217.0 (-)
beef powder (USA) 1625.3±134.3 (±)
beef powder, seasoned (Korea) 1838.3±784.3 (±)
chicken powder (Imported) 254.3±232.0 (-)
chicken base (Imported) 510.0±142.3 (-)
anchovy, dried (Korea) 617.0±182.2 (-)
sabaketsuribushi (Japan) 394.7±204.2 (-)
katsuobushi powder (Japan) 339.3±139.2 (-)
shrimp, dried (Korea) 382.0±76.4 (-)
Alaska pollack, dried and
shredded (Korea) 355.0±80.6 (-) mussel, dried (Korea) 471.3±119.4 (-)
white kidney bean extract (Imported) 12027.5±4261.7 (++)
Why protein concentrate 99.0±19.3 (-)
soybean extract powder (Imported) 37574.5±5823.0 (++)
fishbone powder 511.5±103.9 (-)
snapping turtle powder 3805.0±243.2 (±)
shark cartilage extract 1087.0±544.5 (±)
soybean protein 539.3±224.4 (-)
Herbes
seasoning powder1 (Korea) 411.5±202.9 (-)
seasoning powder2 (Korea) 257.3±82.0 (-)
pepper (Singapore) 270.0±43.6 (-)
basil, whole(USA) 304.7±143.8 (-)
oregano powder (Turkey) 412.3±65.4 (-)
rosemary powder (Turkey) 439.3±102.5 (-)
pepper, powder (Turkey) 399.3±129.9 (-)
bay powder (Turkey) 989.0±103.3 (±)
pepper, seasoned (Korea) 532.0±19.3 (-)
crush pepper (Korea) 306.3±63.1 (-)
parsley flake (Israel) 433.0±45.3 (-)
Table 1. Photostimulated luminescence determination of variety samples (unit: photon counts (60 sec)-1)
spice complex (Korea) 378.3±176.4 (-)
naturoma (Swiss) 450.3±162.2 (-)
HPPM-2 (Korea) 845.3±453.1 (±)
aromild (Japan) 636.0±486.1 (-)
aziparos (Japan) 530.0±26.2 (-)
black pepper powder (Malaysia) 202.7±97.6 (-)
ginger powder (China) 803.0±278.3 (±)
white pepper powder (Malaysia) 563.0±102.8 (-)
savory taste base (Korea) 345.3±220.2 (-)
red pepper (Korea) 328.7±39.2 (-)
pepper, seasoned (Korea) 236.0±38.2 (-)
black pepper (Singapore) 489.0±140.3 (-)
savory mate powder (Korea) 895.3±342.3 (±)
mustard powder (USA) 408.7±292.9 (-)
pepper (Imported) 308.5±253.9 (-)
black pepper (Imported) 363.3±97.7 (-)
bay leaf (Imported) 366.0±102.6 (-)
pepper (Imported) 341.5±82.7 (-)
chillies powder (Imported) 9807232.0±6117917.1 (++)
thyme (Imported) 793.3±87.5 (±)
ginger powder (Imported) 406.7±209.4 (-)
herb, complex (Imported) 7779.7±6005.1 (++)
white pepper (Imported) 363.0±52.7 (-)
red pepper powder (Korea) 271.0±93.3 (-)
pepper, whole (Imported) 328.0±29.7 (-)
pepper, powder (Imported) 289.7±258.0 (-)
ginger powder (Imported) 303.3±180.9 (-)
wasabi (Imported) 440.0±48.1 (-)
soysauce powder (Korea) 586.7±535.9 (-)
black pepper powder (Imported) 366.7±120.4 (-)
pepper, whole (Imported) 263.0±106.1 (-)
red pepper powder (China) 340.3±20.7 (-)
red pepper powder (China) 372.5±26.2 (-)
white pepper powder (Imported) 485.0±19.8 (-)
garlic flake, dried (China) 6531.3±1377.8 (±)
gardenia seed extract (Korea) 306.5±53.0 (-)
oregano, whole (Turkey) 346.0±11.3 (-)
parsley flake (Korea) 356.0±106.7 (-)
mustard powder (USA) 285.7±162.6 (-)
mustard seed, whole (USA) 227.0±87.6 (-)
gardenia seed extract, powder 290.5±81.3 (-)
cinnamon powder 365.0±108.9 (-)
bay leaf powder 2189.0±295.6 (±)
Extracts
vegetable worms,
mushroom (Korea) 280.0±197.6 (-) crataegus (Korea) 390.0±77.7 (-)
Rubus coreanus (Korea) 391.3±45.5 (-)
green tea ex powder1 297.5±78.5 (-)
green tea ex powder2 86.5±24.7 (-)
Angelica gigas extract powder 470.5±47.4 (-)
Phellinus linteus mushroom powder 332.5±7.8 (-)
pine tree bark extract, powder 221.5±31.8 (-)
licorice powder 783.5±142.1 (±)
licorice extract powder 323.5±20.5 (-)
arrowroot extract powder 326.5±7.8 (-)
orange extract powder 375.0±275.8 (±)
Chinese mat-rimony vine
fruit extract 379.5±0.7 (-) rooibos extract 330.0±44.7 (-)
mushroom hyphae 290.0±84.9 (-)
Rehmannia glutinosa powder 525.0±75.0 (-)
Ganoderma lucidum,
mushroom extract 305.5±85.6 (-) oriental medicinal herb extract,
complex 371.5±64.3 (-) Atractylodes macrocephala powder 368.0±46.7 (-)
red koji powder 379.5±23.3 (-)
Coriolus versicolor extract powder 280.0±52.3 (-)
Curcuma longa extract powder 335.5±21.9 (-)
agaricus extract 434.5±31.2 (-)
aloe powder 28481.7±5936.2 (++)
mate powder 336.0±137.2 (-)
wheat berry extract 371.5±84.1 (-)
Disocorea japonica root powder 653.3±245.4 (-)
mulberry tree leaf powder 799.7±162.6 (±)
plant extact 218.5±137.9 (-)
chicory diet fiber 245.0±65.1 (-)
green tea leaf powder (Korea) 335.0±118.7 (-)
Functional additives octacosanol 122.0±4.2 (-) Citrimax HCA-500F 324.5±106.8 (-) seaweed calcium 1696.0±531.7 (±) isoflavone 320.0±52.3 (-) L-glutamine 194.0±58.0 (-) L-methionine 250.5±2.1 (-) LECI-PS20P 393.5±118.1 (-) β-carotene 213.0±28.7 (-) castro-AD 289.0±25.5 (-) chitosan powder 338.5±17.7 (-) collagen 225.0±14.6 (-) taurine 220.0±49.5 (-) milk calcium 324.5±10.6 (-) Biozyme 694.5±145.0 (-) vitamine yeaste 230.0±45.3 (-) lactoferrin 339.5±133.6 (-) lecithin 16772179.0±2132.9 (++) scallop calcium 189.5±217.1 (-) oxidized magnesium 1061.5±180.3 (±) hydrated HCA 1006.0±251.7 (±) glucosamine 639.5±12.0 (-) Fe-glucoacid 304.5±47.4 (-) enerzyme 592.5±266.6 (-) silymarin 314.0±50.9 (-) tribulus 211.0±28.3 (-) palatinose 338.5±28.3 (-)
beer yeast powder 245.0±25.9 (-)
yeast mix powder 221.0±152.7 (-)
BYE 387.0±21.2 (-)
xanthan gum 310.0±84.3 (-)
guar gum 405.0±32.5 (-)
yeast, dried 323.0±18.4 (-)
complex powder 459.0±106.81)(-)
enhancer powder (Korea) 579.3±238.7 (-)
koji (Japan) 1328.3±557.4 (±)
SUPER-RK (Japan) 16775875.3±380.5 (++)
nucleic acid (Thailand) 246.0±107.1 (-)
complex powder (Korea) 795.3±349.8 (±)
Flavor mate (USA) 1314.3±200.7 (±)
savory mate (Korea) 902.3±138.3 (±)
xanthan gum (Korea) 566.3±307.2 (-)
Y-broth (Korea) 735.0±209.8 (±)
yeast (USA) 878.0±423.2 (±)
guar gum (India) 437.0±38.2 (-)
Table 1. Continued
3. Thermoluminescence (TL) 분석
시료의 TL 분석은 CEN (2001) 방법에 준하여 실시하 였다. 먼저 시료에 일정량의 증류수를 가하여 ultrasonic agitator (Branson 3210, Branson Ultrasonic Co., Danbury, CT, USA)에서 5분간 처리하여 water rinsing한 다음 125
µm seive를 통과시켜 일정 시간 정치시킨 후 침전물을
취하였다. 이어서 침전물에 sodium polytungstate solution (2.0 g ml-1) 5 ml를 첨가하여 유기물을 제거하고 이를 다 시 증류수로 세척하였다. 일반적으로 혼입된 미네랄에는 carbonate가 함유되어 있으며 이는 재 ( )조사 후 측정 시 1차 TL glow curve에 대하여 영향을 초래하므로 1 N HCl 2 ml을 가해 10분간 암소에서 정치함으로써 car-bonate를 제거하였고, 1 N NH4OH 2 ml을 첨가하여 중화 하였다. 중화된 미네랄은 증류수로 충분히 세척한 후 acetone으로 수차례 세척한 후 건조하였다. 건조된 미네
랄은 aluminium disc (Φ 6 mm)에 옮겨 닮고 50�C incu-bator에서 24시간 예열한 다음 TLD system (Harshaw TLD-4500, Dreieich, Germany)을 이용하여 high pure N2
gas (99.99999%) 기류 하에서 측정하였다. TLD의 분석조 건은 초기 온도를 50�C로 하여 5초 동안 예열한 다음 최고온도 400�C, 가온율 5�C sec-1로 하고 acquisition time 70초에서 측정하였다. 측정된 시료의 TL 신호를 완 전히 제거하기 위해 5초 동안의 annealing time을 설정 하였다. 방사선 조사 여부의 확인은 조사된 시료에서 발 견되는 특유의 곡선 영역에 대한 면적의 비 (ratio)로 판 단하였다. 즉, 150�C 전후에서 1차 측정된 TL glow curve 를 TL1으로 나타내었으며, TL1의 normalization을 위하 여 측정된 미네랄에 감마선 재조사 (1 kGy)를 실시하여 2차 TL glow curve (TL2)를 측정하였다. 그리고 150~ 250�C 범위의 TL1/TL2면적비 (TL ratio)를 구하여 조사 여부 확인의 신뢰성을 높이기 위한 threshold value를 산 출하였다.
4. Electron spin resonance (ESR) 분석
시료의 ESR 측정은 시료를 3~4일 동안 45�C dry oven
에서 건조한 다음 분말화 공정을 거쳐 30 mesh의 sieve 에 통과시켜 이를 ESR 측정에 사용하였다. 준비된 분말 시료 0.5 g을 ESR sample tube에 담고 ESR spectrometer (JES-TE300, Jeol Co., Tokyo, Japan)를 이용하여 micro-wave power 500µW, modulation 100 kHz, amplitude 1.0× 100, time constant 0.03 sec, sweep time 30 sec 등의 조건 에서 signal을 확인하였으며, intensity (n==3)를 측정하였 다 (Choi et al. 2004).
결과 및 고찰
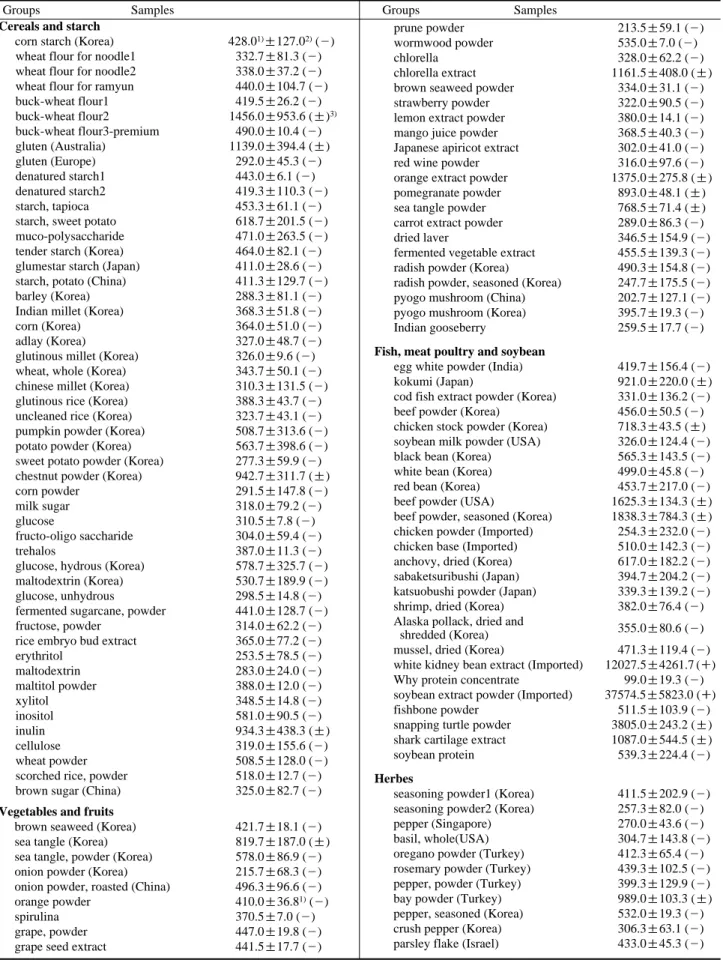
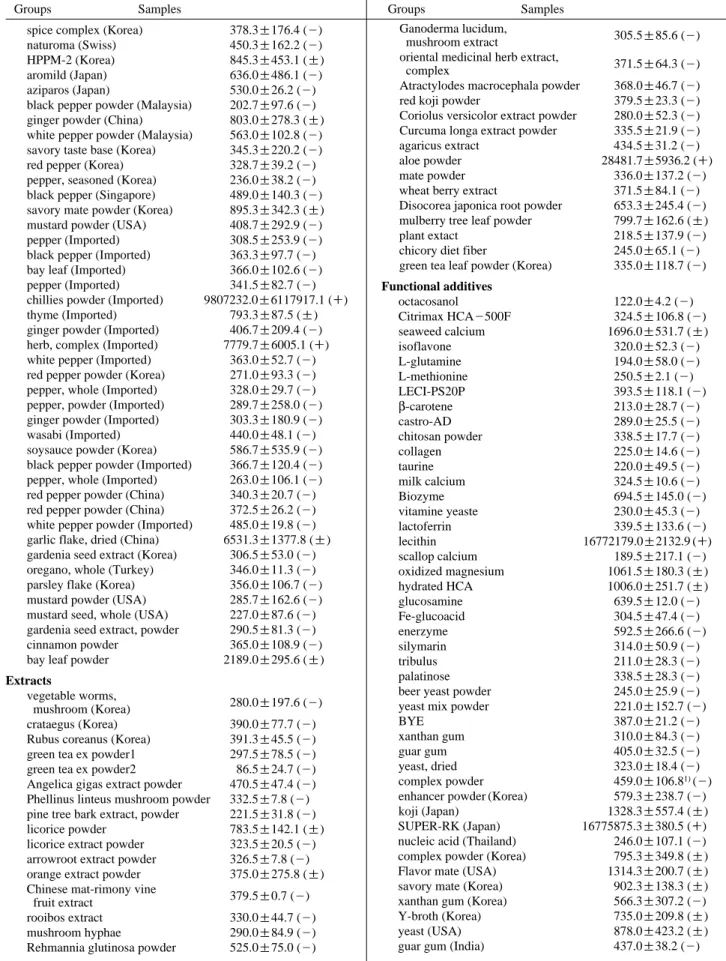
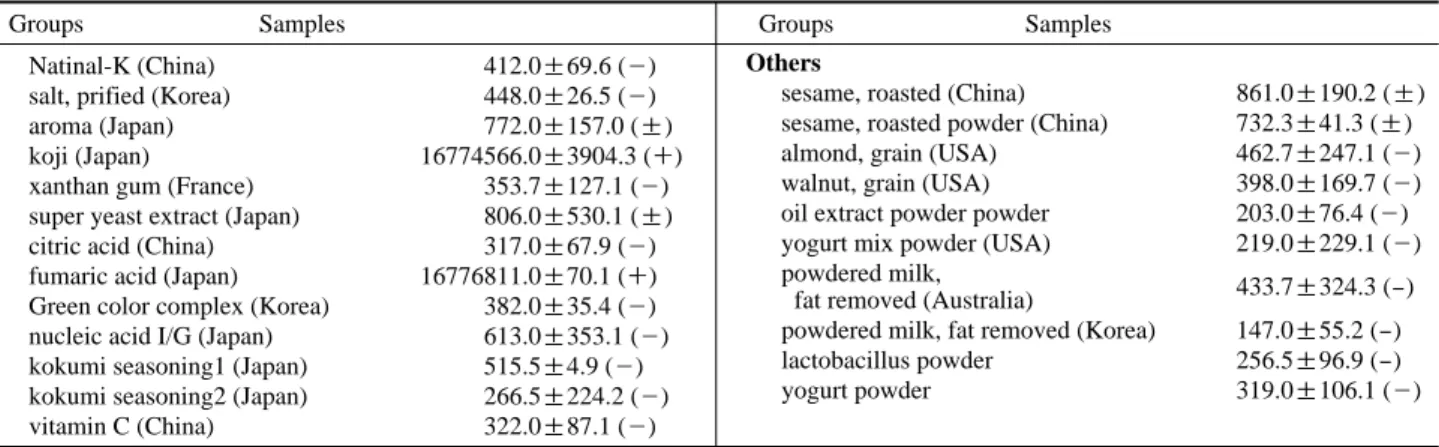
1. Photostimulated luminescence (PSL) 분석 PSL 분석 방법은 silicate나 bionorganic material을 함 유한 농산물에 방사선 조사 여부를 확인하는 방법으로 연구되어왔다. 본 연구에서는 곡류, 육류 및 향신료를 포 함한 다양한 분말제품에 대하여 방사선 조사 여부를 screening 하였다. Table 1에 나타낸 바와 같이 옥수수 전 분을 포함한 곡류 및 전분류 시료군과 홀바실을 포함한 향신료 시료군에서는 photon count가 비조사 범위, 즉 700 (T1) count 이하의 수치를 나타내어 비조사 시료인 것으로 판정할 수 있었다. 한편, 콩류 시료군 가운데 흰 강낭콩 추출 분말과 향신료 시료군 중 칠리 파우더를 Natinal-K (China) 412.0±69.6 (-)
salt, prified (Korea) 448.0±26.5 (-)
aroma (Japan) 772.0±157.0 (±)
koji (Japan) 16774566.0±3904.3 (++)
xanthan gum (France) 353.7±127.1 (-)
super yeast extract (Japan) 806.0±530.1 (±)
citric acid (China) 317.0±67.9 (-)
fumaric acid (Japan) 16776811.0±70.1 (++)
Green color complex (Korea) 382.0±35.4 (-)
nucleic acid I/G (Japan) 613.0±353.1 (-)
kokumi seasoning1 (Japan) 515.5±4.9 (-)
kokumi seasoning2 (Japan) 266.5±224.2 (-)
vitamin C (China) 322.0±87.1 (-)
Others
sesame, roasted (China) 861.0±190.2 (±)
sesame, roasted powder (China) 732.3±41.3 (±)
almond, grain (USA) 462.7±247.1 (-)
walnut, grain (USA) 398.0±169.7 (-)
oil extract powder powder 203.0±76.4 (-)
yogurt mix powder (USA) 219.0±229.1 (-)
powdered milk,
fat removed (Australia) 433.7±324.3 (-) powdered milk, fat removed (Korea) 147.0±55.2 (-)
lactobacillus powder 256.5±96.9 (-)
yogurt powder 319.0±106.1 (-)
Table 1. Continued.
Groups Samples Groups Samples
1)Means of triplicate±standard deviation. 2)Threshold value: T
1==700 (negative, non-irradiated); T2==5,000 (positive, irradiated); (-): ⁄T1, (++): ⁄T2. 3)Between 700 and 5,000 counts (60 sec)-1.
포함한 8종의 시료에서는 방사선 조사 시료 범위 즉, 5,000 (T2) 이상의 photon counts인 10,000~2,000,000 범 위의 photon count가 측정되어 방사선 조사된 시료인 것 으로 판정되었다. 아울러 채소 및 과일류 시료군의 다시 마, 클로렐라 추출물 및 천연물 추출물 시료군의 감초 분말 등을 포함한 39여 종의 시료에서는 T1및 T2의 중 간 값 (intermediate)을 나타내어 보다 정확한 검지를 위 해 다중검지의 적용이 필요할 것으로 판단되었다. Chung et al. (2000)은 백삼 분말의 검지시험에서 비 조 사군과 2.5 kGy 이상 조사군 사이에 조사여부 screening 은 가능하였지만, 방사선 조사선량과 photon count 사이 의 유의성이 없다고 보고하였다. 또한 Yi and Yang (2001)의 연구결과에 의하면 방사선 조사 shrimp-taste seasoning 분말에 대한 PSL 검지연구에서 조사선량의 증
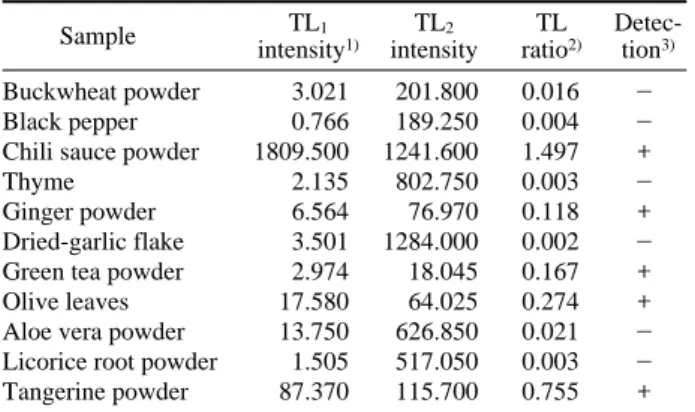
가에 따른 photon count는 증가하였으니 5 kGy 이상에서 는 큰 증가가 없다고 보고한 바 있으며, 선량 의존적인 photon count의 변화는 시료에 혼입된 mineral의 종류 및 양에 기인한 것으로 알려져 있다 (Nam and Yang 2001). 따라서 PSL 방법은 방사선 조사선량에 따른 정량적인 측정방법보다는 방사선 조사여부를 정성적으로 판별하 는 신속한 screening 방법으로 적용이 가능할 것으로 판 단된다. 2. Thermoluminescence (TL) 분석 PSL 방법을 통하여 감마선 조사구로 판별된 시료 9종 과 intermediate값을 나타낸 시료 39종을 대상으로 water rinsing 법을 사용하여 추출한 시료의 minerals (0.05 g)에 대해 TL 분석을 실시하였으며, 그 결과를 Fig. 1과 Table 2에 나타내었다. EN 1788 (European Committe for Stand-ard 2001)에 따르면 조사된 시료의 first glow curve는
105~250�C 범위에서 확인할 수 있고, 시료간의 signal intensity를 비교함으로써 조사 여부의 확인이 가능하다 고 하였다. 본 연구에서 TL intensity는 흑 후추의 경우 0.766 nC으로 가장 낮게 나타났고, 칠리 파우더의 경우 1809.500 nC으로 가장 높게 나타났다. 측정된 TL1결과 의 신뢰도를 높이기 위한 방법으로 측정된 시료 (TL1)
disc를 다시 1 kGy로 재조사하여 2차 glow curve (TL2)를 측정하고 TL ratio (TL1/TL2)를 구하였다. 이때 그 값이 0.05 이하이면 비조사구, 1.0 이상이면 방사선 조사구로 판정하였다. 그 결과 Table 2에서와 같이 메밀분, 흑 후 추, 타임, 건 마늘 조각, 알로에 분말 및 감초 분말은 0.05 이하의 ratio를 나타내어 방사선 비조사구로 판정하 였다. 반면 칠리 파우더의 경우 1.497의 ratio를 나타내 어 방사선 조사구로 판정되었으며, 생강 분말, 가루 녹 차, 올리브 잎 및 감귤 추출분말은 0.118~0.755의 ratio 를 나타내어 타 검지방법과의 다중적인 검토가 요구되 50 100 150 200 250 300 350 400 0 20 40 60 80 100 120 140
TL intensity (a.u.) TL intensity (a.u.)
Temperature (�C) 50 100 150 200 250 300 350 400 0 2 4 6 8 10 12 14 16 18 Temperature (�C) (A) (B)
Fig. 1. Typical TL glow curves of chili sauce powder (A) and tangerine powder (B).
Table 2. TL ratio of glow curves of variety samples
Sample TL1 TL2 TL
Detec-intensity1) intensity ratio2) tion3)
Buckwheat powder 3.021 201.800 0.016
-Black pepper 0.766 189.250 0.004
-Chili sauce powder 1809.500 1241.600 1.497 ++
Thyme 2.135 802.750 0.003
-Ginger powder 6.564 76.970 0.118 ++
Dried-garlic flake 3.501 1284.000 0.002
-Green tea powder 2.974 18.045 0.167 ++
Olive leaves 17.580 64.025 0.274 ++
Aloe vera powder 13.750 626.850 0.021
-Licorice root powder 1.505 517.050 0.003
-Tangerine powder 87.370 115.700 0.755 ++
1)Intergrated TL intensity. 2)TL
1intensity/TL2intensity.
었다. 그러나 다시마 분말을 포함한 37여 종의 시료의 경우 미네랄 분리가 불가능하여 TL분석의 적용이 불가 능하였다. Kwon et al. (2000)은 미지시료에 대한 검지시 험에서 PSL photon count 측정에 의한 screening과 TL에 의한 검증방법은 매우 효과적인 검지결과를 얻을 수 있 는 다중검지법이라고 보고한 바 있으며 본 연구 결과에 서는 PSL photon count 측정과 TL 분석을 실시한 결과 향신료 시료군 중 칠리 파우더 시료가 방사선 조사구로 판정되었다.
3. Electron spin resonance (ESR) 분석
식품과 방사선의 상호작용으로 분자 결합은 분괴되고 자유 라디칼이나 이온이 생성된다. 이러한 전자는 자장 존재시 수평이거나 반 수평 상태로 되며, 시료를 전자선 의 극점 사이에 두고 전자장이 변함에 따라 전자스펙트 럼의 9 GHz 영역에서 단파장 흡수를 조사함으로써 짝이 없는 전자의 정보는 이 스펙트럼의 위치와 형태로 알 수 있다. 자유 라디칼은 일반적으로 다른 물질과 결합하 여 사라지거나 일부는 건조하고 단단한 뼈, 각피에 포획 되어 존재한다. 방사선 조사식품 중 ESR 측정에 이용되 는 식품의 종류는 radical 종류에 따라 cellulose radical을 포함하는 식품, crystaline sugar 유래의 multicomponent signal을 가지는 식품 및 뼈를 구성하는 hydrozyapatite 유래의 radical을 포함하는 식품들이다. 본 연구에서 사 용된 모든 시료에서 방사선 조사 유래의 특이한 signal 이 관찰되지 않았으므로 ESR 측정에 의한 방사선 조사 검지는 불가능한 것으로 판단되었다. 이는 본 연구에서 사용한 복합 조미 분말제품에서는 뼈 (bone)를 함유한 제품이 아니라 열수 추출물을 분말화 한 것으로 방사선 조사 유래의 특이 signal이 나타나지 않는 것으로 판단 되다. 또한 Nam and Yang (2001) 등의 연구에 의한 마늘 과 양파의 방사선 조사시 cellulose 기원의 특이적인 signal이 관찰된 결과와 상반되나, 이는 방사선 흡수선량 에 따른 유리기의 증가와 더불어 가공, 유통 과정에 의 한 cellulose 함량차에 기인한 것으로 판단된다.
요
약
곡류 및 전분류, 채소 및 과일류, 생선, 육류 및 콩류 및 향신류 등의 시료에 대한 감마선 조사에 의한 검지 특성을 물리적 검지 방법인 photostimulated lumines-cence (PSL), electron spin resonance (ESR) 및thermolu-minescence (TL) 분석을 통하여 검지 가능성을 확인하였 다. PSL 분석 결과 곡류 및 전분류 시료군 가운데 옥수 수 전분, 소맥분과 채소 과일류 시료군의 미역 등의 시 료는 비 조사군 (negative, ‹700)으로 판정되었으며, 생 선, 육류 및 콩류 시료군의 흰 강낭콩 추출분말 및 향신 료 시료군의 칠리 파우더를 포함한 9종의 시료는 감마 선 조사군 (positive, ›5000)으로 판정되었다 (전체 시료 의 3.2%). 이외에 39종의 시료군에서는 방사선 조사 가 능성이 있는 700~5,000 범위의 photon counts
(interme-diate)를 나타내었다 (전체 시료의 15.6%). 이들 시료에 대한 TL 분석 결과, 칠리 파우더를 비롯한 미네랄이 분 리된 5종의 시료에서는 150~250�C 전후에서 TL glow curve (TL1)을 나타내어 감마선 조사 여부의 확인이 가 능하였다. ESR 분석 결과 2차 검증 시료군에서 방사선 유래 특이적인 signal이 관찰되지 않아서 추출물 시료에 는 ESR 분석법의 적용이 불가능한 것으로 나타났다.
참 고 문 헌
Boyd DR, Crone AVJ, Hamilton JTG, Hand MV, Stevenson, MH and Stevenson PJ. 1991. Synthesis, characterization and potential use of 2-dodecylcy-clobutanone as a marker for irradiated chicken. J. Agric. Food Chem. 39:789-792. Cerda H, Delencee H, Haline H and Rupp H. 1997. The DNA
“Comet assay” as a rapid screening technique to control irradiated food. Mutation Res. 375:167-181.
Choi ID, Byun MW, Kwon JH and Kim DH. 2004. An appli-cation of photo-stimulated luminescence (PSL) and elec-tron spin resonance (ESR) analysis for the irradiated spicy vegetables. Food Sci. Biotechnol. 13:645-650.
Chung HW, Kwon JH and Delincee H. 2000. Photostimulated luminescence application to detection of irradiated white ginseng powder. Korean J. Food Sci. Technol. 32:265-270. Delincee H. 2002. Analytical methods to identify irradiated
food-a review. Radiat. Phys. Chem. 63:455-458.
European Committee for Standard. 2001. Detection of irradiat-ed food from which silicate minerals can be isolatirradiat-ed. Me-thod by thermoluminescence. English version of DIN EN 1788.
European Committee for Standard. 2001. Detection of irradiat-ed food using photosimulatirradiat-ed lumiescence. English version of DIN EN 13751.
IAEA homepage. 2005. www. iaea.org/icgfi.
KFDA. 2005. Regulation of Food Irradiation. pp. 151-152. Food Standard Code, The Korea Food and Drug Admini-stration, Seoul.
Kwon JH. 2003. Commercialization of food irradiation tech-nology and the identification of irradiated foods. Food Ind.
36:50-55.
Kwon JH, Chung HW and Kwon YJ. 2000. Infrastructure of quarantine procedures for promoting the trade of irradiated foods. pp. 209-254. Paper presented as Symposium of The Korean Society of Postharvest Science and Technology of Agricultural Products on Irradiation Technology for the Safety of Food and Public Health Industries and Quality Assurance, Daejeon.
Kwon JH, Heong JY and Chung HW. 2002. Thermolumine-scence characteristics of minerals from irradiated potatoes of different origins of production. Radiat. Phys. Chem. 63: 415-418.
Lee EJ and Yang JS. 2002. Detection of gamma-irradiated Korean medicinal herbs by ESR spectroscopy. J. Korean
Soc. Food Sci. Nutr. 31:717-721.
McKelvey-Martin VJ, Green MHL, Schmezer P, Pool-Zobel BL, De Meo MP and Collinns A. 1993. The single cell gel electrophoresis assay (comet assay): A European review.
Mutation Res. 288:47-63.
Morehouse KM, Kiesel N and Ku Y. 1993. Identification of meat treated with ionizing radiation by capillary gas chro-matographic determination of radiolytically producted hy-drocarbones. J. Agric. Food Chem. 41:758-763.
Nam HS and Yang JS. 2001. Detection of gamma-irradiated spices by ESR spectroscopy. J. Korean Soc. Food Sci. Nutr. 30:239-242.
Nam HS, Lee SY and Yang JS. 2001. Detection of gamma-irra-diated dried fruits by measuring of free radicals. Korean J.
Food Sci. Technol. 33:423-426.
Oduko JM and Spyrou NM. 1990. Thermoluminescence of
irradiated foodstuffs. Radits. Phys. Chem. 36:603-607. Raffi JJ and Benzaria SM. 1993. Identification of irradiated
foods by elctron spin resonance techniques. J. Radiat.
Ste-ril. 1:281-304.
Sanderson DCW, Carmichael LA and Fisk S. 1998. Establish-ing luminescence methods to detect irradiated foods. Food
Sci. Technol. 12:97-102.
Schreiber GA. 1996. Thermoluminenescence and photostimu-lated luminescence techniques to identify irradiated foods. pp. 121-123. In: Detection Methods for Irradiated Foods, McMurray CH, Stewart EM, Gray R and Pearce J (eds.), The Royal Society of Chemistry, Cambridge, UK.
Soika C and Delincee H. 2000. Thermoluminescence analysis for detection of irradiated food-Thermoluminescence char-acteristics of minerals using different types of radiation and radiation dose. Lebensm. Wiss. Technol. 33:431-439. Stevenson MH, Crone AVJ, Hamilton JTG and McMurray
CH. 1993. The use of 2-dodecylcy-clobutanone for the iden-tification of irradiated chicken meat and eggs. Radiat. Phys.
Chem. 42:363-366.
UNEP. 1995. Montreal protocol on substance that deplete the ozone layer. p. 294. Report of the methyl bromide techni-cal options committee.
Yi SD and Yang JS. 2001. Properties of pulesd photostimul-ated luminescence and thermoluminescence of gamma-irradiated shrimp-taste seasoning powder. Food Sci.
Biote-chnol. 10:408-413.
Manuscript Received: February 28, 2008 Revision Accepted: March 5, 2008