This paper evaluates the efficiency of mobile content firms through a hybrid approach combining data envelopment analysis (DEA) to analyze the relative efficiency and performance of firms and principal component analysis (PCA) to analyze data structures. We performed a DEA using the total amount of assets, operating costs, employees, and years in business as inputs, and revenue as output. We calculated fifteen combinations of DEA efficiency in the mobile content firms. We performed a PCA on the results of the fifteen DEA models, dividing the mobile content firms into those having either ‘asset-oriented’ or ‘manpower and experience-oriented’ efficiency. Discriminant analysis was used to validate the relationship between the efficiency models and mobile content types. This paper contributes toward the construction of a framework that combines the DEA and PCA approaches in mobile content firms for use in comprehensive measurements. Such a framework has the potential to present major factors of efficiency for sustainable management in mobile content firms and to aid in planning mobile content industry policies.
Keywords: Mobile content, efficiency, DEA, PCA, discriminant analysis, corrected ordinary least square.
Manuscript received July 19, 2010; revised Nov. 23, 2010; accepted Nov. 24, 2010. This research was supported by the Ministry of Knowledge Economy (MKE), Rep. of Korea, under the Information Technology Research Center (ITRC) support program supervised by the National IT Industry Promotion Agency (NIPA-2011-(C1090-1111-0013)).
Eun Jin Cho (phone: +82 42 860 5159, email: [email protected]) is with the Technology Strategy Research Division, ETRI, Daejeon, Rep. of Korea.
Myeong Cheol Park (email: [email protected]) is with the Department of Management Science, KAIST, Daejeon, Rep. of Korea.
doi:10.4218/etrij.11.0110.0430
I. Introduction
The mobile content market has been emerging as a new source of revenue with high growth potential, as demonstrated by the recent success of smart phones from global companies, such as Google and Apple, as well as the introduction of flat-rate data services [1]. However, the mobile content market in Korea has remained much the same since mobile content services were first launched in 1999. In fact, there has actually been a negative growth rate in the Korean mobile content market. Moreover, the mobile content market environment is highly complex, and the life-cycles of mobile contents and the companies that create them are rather short. This situation has motivated decision makers to evaluate the performance of individual firms in order to determine whether a particular business is sustainable. Nevertheless, there has been little research related to assessing the performance of mobile content firms. The studies in [2], [3] did evaluate the efficiency of content companies but only as a subcategory of Internet firms. Therefore, in this paper, we consider mobile content firms as the sole subject for a performance evaluation.
Efficiency is a representative indicator in evaluating business performance, and is measured based on the extent to which a firm can produce maximum results given a minimum amount of manpower, cost, and infrastructure resources [4]. The evaluation of the business efficiency has become important for improvement of their operations and new strategies to keep up with competition [5]. Efficiency applied in business can be measured as a comparative concept because there is no theoretical maximum used as a benchmark.
Evaluating the Efficiency of Mobile Content
Companies Using Data Envelopment Analysis and
Principal Component Analysis
A data envelopment analysis (DEA) is a commonly used nonparametric approach to evaluate efficiency. Recent studies [2], [6] have presented a hybrid method involving both DEA and principal component analysis (PCA) as a way to solve this problem, and it is possible for various performance evaluation models to be constructed by combining all possible inputs and outputs. Multivariate analyses such as PCA and multidimensional scaling are applied to DEA results to illustrate the similarities and differences between various models and firms.
We applied a DEA-PCA combinational framework to measure the efficiency of mobile content firms. We designed multiple DEA models from various combinations of inputs and outputs. A PCA is applied to these multiple efficiency scores to identify the different efficiency characteristics. Identification of the efficiency fitness of each firm should yield insight into the weaknesses and strengths of mobile content firms. We tested the relationship between the type of efficiency and the type of mobile content using a discriminant analysis. From the results of this efficiency evaluation, we derived practical implications for firms that may be useful for future efficiency improvement. We tested the robustness of the DEA model by comparing the efficiency results between parametric and nonparametric methods, corrected ordinary least squares (COLS), and DEA. The studies in [2], [6] used only one approach, DEA, with little attention toward the consistency of efficiency measurements from other approaches. We diverged from these previous studies to enhance the reliability of our DEA results.
The rest of this paper is organized as follows: In section II, we review the existing literature on the mobile content industry and discuss related trends in Korea. We look into prior research related to efficiency and provide a summary of the studies applied to this subject. In section III, we describe the DEA methodology used in this paper and introduce the fifteen combinations of DEA models used in the analysis. In section IV, the PCA and discriminant analyses we used are described, and their results are provided. In the last section, we present our conclusions and suggest possible directions for future research.
II. Literature Review
1. Mobile Content Industry
As the telecom market enters into a phase of maturity, a slowdown in subscriber growth is pushing operators to seek out new sources of revenue [7]. The mobile content market is definitely one of the new potential revenue sources for telecom operators [1], [8]. “Mobile Internet” refers to a service used to download and use contents using mobile devices from any location. “Mobile content” refers to digital content that can be
set to mobile devices through a mobile communications network [1], [9], [10]. Previous studies about mobile content have mainly focused on new business models [11], content developments [12], [13], and user behavior [14], [15]. There are few studies about analysis of mobile content companies.
A. Characteristics of Mobile Content
The characteristics of mobile contents can be examined from the perspective of service supply and service use [16]. From the perspective of service supply, mobile content is provided through a complex ecosystem [17]-[20], which comprises 4 stages; namely, Content, Platform, Network, and Terminal. Content providers send content to customer terminals connected to mobile Internet through distribution channels such as internal web portals operated by a mobile communications company or external web portals operated by companies other than mobile communications companies [10]. Content providers are significantly influenced by platform operators and network operators. Compatibility with different platforms must be incorporated into the production of content [13].
The characteristic of mobile content use is the lack of temporal and spatial restrictions, which is ideal for short-term entertainment and the speedy proliferation of mobile content. Mobile content provides great mobility and convenience as mobile terminals are used for communications. However, it is also the restrictions on the use of mobile terminals that create the mobile content market’s unique characteristic. Due to the larger number of physical restrictions when compared to the conventional computing environment, such as short session playtimes, large latency periods, small screens, and limited input options, the conversion of wired content for use in the mobile environment is limited [15], [21].
B. Businesses Model of Mobile Content
Mobile content revenue models are diversely applied: A fee can be charged for a single access or purchase of contents; a membership fee can be charged for a set duration; or content can be provided for free using advertising revenue. In general, companies charge users a fee for any access or purchase of content. Users also pay a fee for the use of mobile Internet networks. Recently, fee packages combining mobile Internet fees and mobile content fees have become available [10].
According to [2], content providers are categorized as Internet companies. An Internet company encompasses a variety of business models, including the search engine service, web portal service, content, communities, and e-tailor. In the case of the search engine and web portal services, most of the revenue is generated through advertising; in the case of content and communities, membership fees and content charges
generate revenue; and, in the case of e-tailor, the sale of physical or digital products generates revenue. This research examines the mobile content provider which generates revenues by charging users a fee to download and use content.
C. Types of Mobile Content
Types of the most common mobile content include edutainment, games, video, news, transport information, and adult entertainment [10]. Japanese mobile content categorizes ringtones, mobile games, fancy e-mail, and electronic books. In particular, mobile music content is further divided into various types. This shows that mobile music contents account for the biggest portion of the Japanese mobile content market [22]. Korean mobile content is divided into games, broadcasting, information, music, distribution, and solutions [23]. Music, games, and information are commonly used mobile content. The level of use of each mobile content type differs in various countries.
The authors of [24], [17] divide mobile content into creative content and processed information based on creativity. Processed information is a type of mobile content that has been converted from contents used on other media. Creative content is content developed specifically for the mobile environment. Although the boundary between these two types is not clear, any mobile content is deemed to fall into either category when showing one of the aforementioned two characteristics. While creative content that uses new technologies, such as sensor technology, recognition, LBS, and augmented reality are being developed, their development is still at an early stage, and the majority of existing mobile content is processed information. Creative content that has been commercialized includes mobile games and LBS services. Processed information content has been responsible for the initiation of the mobile content market, their added value is not significant, and it is creative content that is expected to be the core revenue source among mobile networks in the future.
D. Overview of Korean Mobile Content Market
The revenues in the Korean mobile content market in 2008 reached KRW 640 billion (USD 840 million)–a 10.5% decrease from the previous year–and the market has been stagnant since 2006. The Korean mobile content market is primarily comprised of music, games, and information content, which accounts for 75% of the total mobile content revenues. Also, mobile music and mobile games are dominated by a small number of companies. There are 6 mobile game companies with revenue higher than KRW 5 billion (USD 6.6 million), while those with revenue figures lower than KRW 1 billion account for 70% of the entire mobile game market. The
mobile music market is also led by 5 companies.
Meanwhile, in the overall global market, mobile Internet claims a 24.4% share and has been growing at an average rate of 6.4% annually [25]. Thus, when compared to the rest of the world, the growth of the Korean mobile content market clearly appears to be performing poorly at both the telecom operator and government levels. This calls for a re-stimulation of demand.
In March 2009, the Korean government unveiled a stimulus plan for the mobile Internet and content market, which is currently being implemented [1]. Over 5 years, the Korean government is set to provide KRW 10 billion (USD 13.2 million) in support of the development of mobile content. There is a need for a performance analysis of mobile content companies to enhance their ability to distribute limited resources. By comprehensively analyzing individual mobile content companies’ performance, effective mobile content support policies can be set.
2. Efficiency Evaluation and Applied Research
The evaluation of business efficiency has become important for improvement of their operations and new strategies to keep up with competition [4], [5]. With efficiency being one of the main indicators of a company’s performance, such an evaluation must determine how efficiently such firms manage their technology, assets, and costs and must examine other key performance-related factors so that a better business strategy can be devised for future implementation. The first evaluation model based on a DEA framework was developed by Charnes, Cooper, and Rhodes in 1978 and was named the CCR model [26], [27].
A DEA is an optimized evaluation framework in which efficiency is measured for each decision-making unit (DMU) by using its input-output data and calculating its weight. The efficiency of a DMU,θ, is 0 < θ ≤ 1. A θ of 1 indicates full efficiency. The CCR model implemented in this study is in an input-oriented, constant-returns-to-scale, envelopment DEA form [27], which can be written as
0 1 0 0 1 max , s r r r m i i i u y v x θ = = =
∑
∑
(1) 1 1 s.t 1, 1,..., , , 0, 1,..., , 1,..., , s r rj r m i ij i r i u y j N v x u v r S i M = = = ≤ = ≥ = =∑
∑
where θ is the efficiency, xij is the value of input i for decision- making unit j, j0 is the company whose efficiency is being
and ur and vi are the relative input and output weights.
With DEA models, it is possible to simultaneously consider more than one input or output. Furthermore, these models use nonparametric approaches in which the assumption of a production function is unnecessary, but it is impossible to test the goodness of fit of the model. An alternative approach for measuring relative efficiency of decision-making units is to use statistical methods to estimate the best practice frontier and efficiency scores [28]. The COLS method is based on regression analysis [29]. The use of different methods can make up for the weak point of DEA that it is impossible to test hypothesis concerning the performance of the model [30].
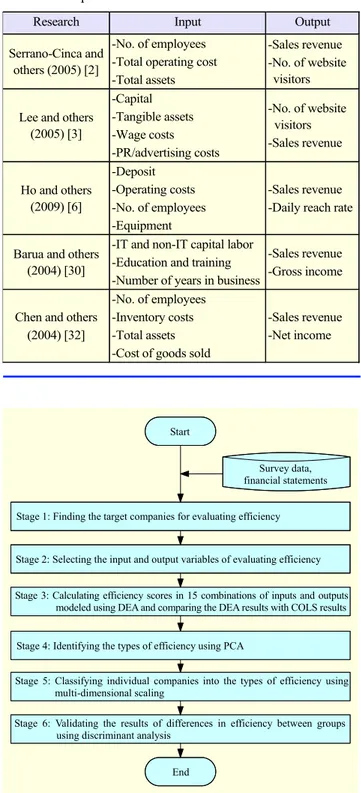
DEA is used in wide-ranging fields, from public services to the financial and telecommunications sectors [4], [22]. Related research into the efficiency of content firms has been conducted on dot-com firms and Internet companies [2], [3], and such studies employing a DEA method include [2], [3], [6], [30], [32]. The authors in [30] compared ‘digital’ dot-com companies and ‘physical’ dot-com companies in terms of the effect of IT investment on output. The authors of [32] assessed the e-business performance of retail companies using their financial data from 1997 to 2000. They used a super-efficiency analysis to compare the performance of both pure and partial Internet firms. The study in [3] compared firms selling physical goods and those selling digital products in an efficiency evaluation of Internet companies. The authors in [2] used a hybrid DEA-PCA method to evaluate the efficiency of Internet companies. Multivariate analysis on these results presented some overall efficiency models, revenue-related efficiency models, and efficiency models based on unique visitors. It was shown that there are significant differences between e-tailors, and non-e-tailors in terms of efficiency. The authors in [6] also applied a hybrid DEA-PCA approach in their efficiency evaluation of Taiwanese online banking firms. The study provided 45 DEA results and divided the firms into cost-oriented and Internet-cost-oriented companies through multivariate analysis. Table 1 shows a summary of the efficiency studies applied to dot-com companies.
Previous studies about efficiency of Internet companies have mainly focused on the comparisons between digital and physical companies or pure and partial online companies. The studies in [2], [3] treated content firms as a subcategory of Internet companies. In fact, it is difficult to find research focusing directly on the efficiency of mobile content firms.
III. Efficiency in Mobile Content Companies
We employed the DEA-PCA approach to identify the efficiency characteristics of individual mobile content firms. The robustness of the efficiency scores from the DEA were
Table 1. Summary of efficiency evaluation studies in dot-com companies.
Research Input Output
Serrano-Cinca and others (2005) [2]
-No. of employees -Total operating cost -Total assets
-Sales revenue -No. of website
visitors Lee and others
(2005) [3] -Capital -Tangible assets -Wage costs -PR/advertising costs -No. of website visitors -Sales revenue Ho and others (2009) [6] -Deposit -Operating costs -No. of employees -Equipment -Sales revenue -Daily reach rate
Barua and others (2004) [30]
-IT and non-IT capital labor -Education and training -Number of years in business
-Sales revenue -Gross income Chen and others
(2004) [32]
-No. of employees -Inventory costs -Total assets -Cost of goods sold
-Sales revenue -Net income
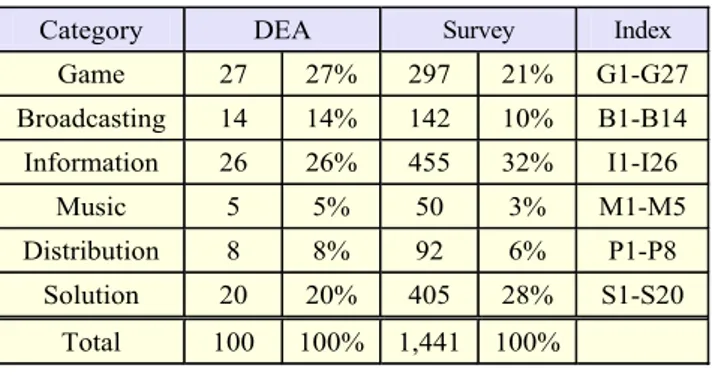
Fig. 1. Efficiency evaluation framework. Start
Stage 1: Finding the target companies for evaluating efficiency
Stage 2: Selecting the input and output variables of evaluating efficiency Stage 3: Calculating efficiency scores in 15 combinations of inputs and outputs
modeled using DEA and comparing the DEA results with COLS results Stage 4: Identifying the types of efficiency using PCA
Stage 5: Classifying individual companies into the types of efficiency using multi-dimensional scaling
Stage 6: Validating the results of differences in efficiency between groups using discriminant analysis
End
Survey data, financial statements
tested against other methods. The DEA results were studied using a multivariate statistical analysis to provide visual representations. The efficiency evaluation framework used for studying the mobile content companies is illustrated in Fig. 1.
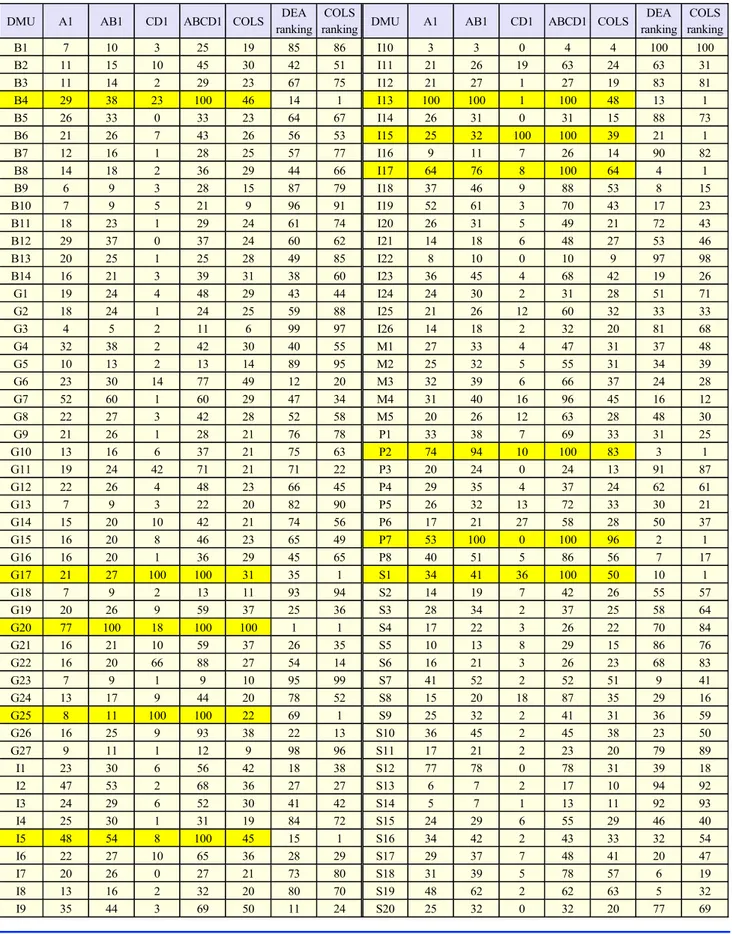
Table 2. Classification of mobile content.
Category DEA Survey Index
Game 27 27% 297 21% G1-G27 Broadcasting 14 14% 142 10% B1-B14 Information 26 26% 455 32% I1-I26 Music 5 5% 50 3% M1-M5 Distribution 8 8% 92 6% P1-P8 Solution 20 20% 405 28% S1-S20 Total 100 100% 1,441 100% 1. Data
A DEA is a comparative analysis technique, the successful use of which requires homogeneous data [33]. Most mobile content companies are small and do not have set procedures for their accounting practices nor do they audit their financial data. Of the data from the 1,441 mobile content firms in operation in Korea, identified through a 2008 industry survey [23], only 109 companies satisfied the homogeneity requirements: first, the company exists solely online; second, financial information is available from corporate disclosure by Financial Supervisory Service. For DEA, companies that can acquire as much reliable financial information as possible and those with similar characteristics were all selected. These firms are registered with the Korea Mobile Internet Business Association.
This study looked at the data of these 109 firms, dividing them into the six categories in Table 2: online gaming, digital broadcasting, information content, digital music, distribution and portals, and digital solution firms. We used χ2 statistics to
test whether the sample data indicated that a population distribution fit the data, which is called the goodness-of-fit test [34]. On computing X2, we found χ = 15.88 2 and 2
.05
χ = 11.07 with degree 5 of freedom. The result was that the data did not meet the same distribution of population. The number of game and broadcasting companies decreased from 31 to 27 and from 19 to 14, respectively. Previously excluded companies were chosen despite their small revenue size because they slightly impacted the result. We constructed data with 100 companies. We tested the goodness-of-fit test to the revised data. We found
2
χ = 10.74. Because 2 .05
χ = 11.07, with 5 degree of freedom, the data did not present sufficient evidence to contradict our hypothesis that the DEA sample possessed the same distribution of population.
2. DEA Model Specification
The next step is to design a DEA model for evaluating their efficiency. The most important step in designing a DEA model is choosing the proper inputs and outputs because the results of a DEA vary widely depending on the variables selected. Especially in service industry, measuring inputs and outputs is very complex [35]. However, the existing DEA literature provides no clear or precise criteria for variable selection.
In accordance with [36] definition of a company, a company is defined as a company with staff and assets that engages in spending to achieve its corporate objective. Among the inputs most often used for an efficiency evaluation are total assets, operating costs, and the total number of employees: variables which have been broadly used for evaluating firms [2], [6]. The input selected first was ‘total assets.’ Although mobile content companies spend less on inventory management and fixed investments when compared to other companies, they consider computers, databases, and software as important assets. However, as the identification of cost of individual cases of system establishment and maintenance is difficult in reality, ‘total assets’ of a mobile content company was selected as an input as the characteristics of a mobile content company’s assets are reflected in its total assets. ‘Operation costs,’ the second input, are the direct costs of a business operation. Operation costs can be defined as an input that represents a company’s operational capacity [5].
‘Number of employees’ was selected as the third input. As the knowledge-based industry is reliant on human resources, a resource that requires almost no materials, competent human resources are the most important asset of a mobile content company. ‘Business year’ was selected as the fourth input factor. As mobile content has a short lifecycle, ‘business experience’ was also selected as an input factor [30]. Although others, such as advertising costs, training costs, and development costs can be selected as inputs depending on the purpose of evaluation, such factors were excluded from this research.
In general, the output of a company is its revenue or profit. Profit is not suitable for analysis since it includes both cost and revenue [37]. Since it includes inputs as well as outputs, it would be desirable to avoid profit as output measure. As such,
Table 3. Inputs and output in DEA of mobile content firms.
Inputs Output A B C D 1 Total assets (₩) Total operating costs (₩) Number of employees (persons) Years in business (years) Revenue (₩)
Table 4. DEA and COLS efficiency results. DMU A1 AB1 CD1 ABCD1 COLS DEA
ranking COLS
ranking DMU A1 AB1 CD1 ABCD1 COLS DEA ranking COLS ranking B1 7 10 3 25 19 85 86 I10 3 3 0 4 4 100 100 B2 11 15 10 45 30 42 51 I11 21 26 19 63 24 63 31 B3 11 14 2 29 23 67 75 I12 21 27 1 27 19 83 81 B4 29 38 23 100 46 14 1 I13 100 100 1 100 48 13 1 B5 26 33 0 33 23 64 67 I14 26 31 0 31 15 88 73 B6 21 26 7 43 26 56 53 I15 25 32 100 100 39 21 1 B7 12 16 1 28 25 57 77 I16 9 11 7 26 14 90 82 B8 14 18 2 36 29 44 66 I17 64 76 8 100 64 4 1 B9 6 9 3 28 15 87 79 I18 37 46 9 88 53 8 15 B10 7 9 5 21 9 96 91 I19 52 61 3 70 43 17 23 B11 18 23 1 29 24 61 74 I20 26 31 5 49 21 72 43 B12 29 37 0 37 24 60 62 I21 14 18 6 48 27 53 46 B13 20 25 1 25 28 49 85 I22 8 10 0 10 9 97 98 B14 16 21 3 39 31 38 60 I23 36 45 4 68 42 19 26 G1 19 24 4 48 29 43 44 I24 24 30 2 31 28 51 71 G2 18 24 1 24 25 59 88 I25 21 26 12 60 32 33 33 G3 4 5 2 11 6 99 97 I26 14 18 2 32 20 81 68 G4 32 38 2 42 30 40 55 M1 27 33 4 47 31 37 48 G5 10 13 2 13 14 89 95 M2 25 32 5 55 31 34 39 G6 23 30 14 77 49 12 20 M3 32 39 6 66 37 24 28 G7 52 60 1 60 29 47 34 M4 31 40 16 96 45 16 12 G8 22 27 3 42 28 52 58 M5 20 26 12 63 28 48 30 G9 21 26 1 28 21 76 78 P1 33 38 7 69 33 31 25 G10 13 16 6 37 21 75 63 P2 74 94 10 100 83 3 1 G11 19 24 42 71 21 71 22 P3 20 24 0 24 13 91 87 G12 22 26 4 48 23 66 45 P4 29 35 4 37 24 62 61 G13 7 9 3 22 20 82 90 P5 26 32 13 72 33 30 21 G14 15 20 10 42 21 74 56 P6 17 21 27 58 28 50 37 G15 16 20 8 46 23 65 49 P7 53 100 0 100 96 2 1 G16 16 20 1 36 29 45 65 P8 40 51 5 86 56 7 17 G17 21 27 100 100 31 35 1 S1 34 41 36 100 50 10 1 G18 7 9 2 13 11 93 94 S2 14 19 7 42 26 55 57 G19 20 26 9 59 37 25 36 S3 28 34 2 37 25 58 64 G20 77 100 18 100 100 1 1 S4 17 22 3 26 22 70 84 G21 16 21 10 59 37 26 35 S5 10 13 8 29 15 86 76 G22 16 20 66 88 27 54 14 S6 16 21 3 26 23 68 83 G23 7 9 1 9 10 95 99 S7 41 52 2 52 51 9 41 G24 13 17 9 44 20 78 52 S8 15 20 18 87 35 29 16 G25 8 11 100 100 22 69 1 S9 25 32 2 41 31 36 59 G26 16 25 9 93 38 22 13 S10 36 45 2 45 38 23 50 G27 9 11 1 12 9 98 96 S11 17 21 2 23 20 79 89 I1 23 30 6 56 42 18 38 S12 77 78 0 78 31 39 18 I2 47 53 2 68 36 27 27 S13 6 7 2 17 10 94 92 I3 24 29 6 52 30 41 42 S14 5 7 1 13 11 92 93 I4 25 30 1 31 19 84 72 S15 24 29 6 55 29 46 40 I5 48 54 8 100 45 15 1 S16 34 42 2 43 33 32 54 I6 22 27 10 65 36 28 29 S17 29 37 7 48 41 20 47 I7 20 26 0 27 21 73 80 S18 31 39 5 78 57 6 19 I8 13 16 2 32 20 80 70 S19 48 62 2 62 63 5 32 I9 35 44 3 69 50 11 24 S20 25 32 0 32 20 77 69
Table 5. Regression coefficients from a COLS analysis. β s.e t Sig. Constant 3.471 0.875 3.967 0.000** ln asset 0.568 0.066 8.606 0.000** ln opex 0.287 0.062 4.606 0.000** ln employee 0.101 0.044 2.313 0.023* ln year –0.144 0.078 –1.852 0.067 **P<0.01, *P<0.05
revenues, the intermediate stage in the calculation profit, were incorporated into the calculation of the sales activities of mobile content businesses. In this study, we selected total assets, operating costs, number of employees, and number of years in business as the inputs, and revenue as the output, as shown in Table 3.
A full DEA model is generally used for assessing the overall efficiency of a DMU; in other words, an ABCD1 model using all inputs (A, B, C, and D) and a single output (1).
In this study, however, we designed the models using all possible combinations of input and output variables. Since efficiency results depend on the choice of inputs and outputs, this type of study can aid in assessing how the efficiency score for a given company depends on such choices, which may reveal the weaknesses and strengths of a firm [2].
3. DEA Results
The results of a DEA performed on 100 DMUs to evaluate the efficiency of mobile content companies are given in Table 4. All scores are between 1 and 100. The table shows that some DEA combination models, such as A1, AB1, CD1, and ABCD1, received high component loadings of the PCA shown in Table 7. The efficiency scores of the mobile content companies varied according to the model used for evaluation. Under the full DEA model, ten companies proved to be the most efficient; namely, B4, G17, G20, G25, I5, I13, I15, I17 P2, P7, and S1. These DMUs can be considered efficient companies overall.
However, using the full model alone, we were unable to determine whether they have the unique efficiency characteristics of an individual firm. To ascertain the efficiency features of the firms, 15 combinations of DEA efficiency were calculated. DMUs rated 100% efficient under the full model can widely differ in their scores under other models. For example, in Table 4, firm I13 received an efficiency score of 100% in the ABCD1 model, but received a score of 1% in the CD1 model.
To test the robustness of the DEA methods, we compared
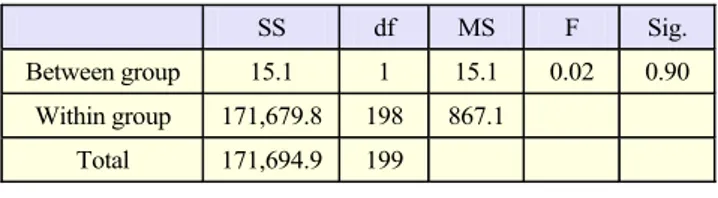
Table 6. Analysis of variance of DEA and COLS rankings.
SS df MS F Sig.
Between group 15.1 1 15.1 0.02 0.90 Within group 171,679.8 198 867.1
Total 171,694.9 199
our analysis results with those from a COLS analysis based on the regression approach. The COLS variables used were the same as in the full DEA model. All variables were in a logarithmic form. The model appears to be a good fit with
R2= 0.868. In Table 5, the ‘year’ variable is not statistically
significant at the 5% level, while the other variables are statistically significant at 1%. The (6th, 14th) and (8th, 16th) columns of Table 4 show the scores and rankings obtained from the COLS. We compared the efficiency scores and rankings of DEA and COLS. The Spearman correlation coefficients were 0.839.
The results of ANOVA in Table 6 show that the rankings of the two methods are not different. This shows that the DEA and COLS models are highly correlated and consistent, and that the DEA method can be used to estimate the efficiency of mobile content firms.
IV. Multivariate Analysis of DEA Efficiency Scores
1. PCA Results: Types of EfficiencyPCA is a data reduction technique to extract data and reduce redundant information. PCA is also frequently used to reveal hidden features of a data set or to visualize the main relationships that exist between observations [38]. PCA processes all combinations and DMUs, indentifying their similarities and differences [6].
We performed a PCA on the DEA efficiency scores obtained from the 15 combination models. The 15 DEA models were set as the variables, and the efficiency scores set as the observations. The first two principal components account for 75.98% of the total variance. Table 7 shows a matrix of the component loadings.
For all models, the first principal component has a positive sign, and thus the first component is named, ‘overall measure of efficiency.’ The highest weight is associated with ABCD1 (0.952), followed by the full model, ACD1 (0.920).
The second principal component is associated with specialization in the efficient use of inputs. The sign of the loading value of the second component is negative for models A1, AB1, AC1, AD1, ABD1, ABC1, ACD1, ABCD1, and B1,
Table 7. PCA component loadings matrix. Model PC1 PC2 Model PC1 PC2 A1 0.685 –0.697 BC1 0.733 0.381 AB1 0.733 –0.646 BD1 0.720 0.427 ABD1 0.903 –0.254 BCD1 0.757 0.517 AD1 0.879 –0.247 C1 0.470 0.525 ABC1 0.913 –0.191 D1 0.418 0.574 AC1 0.913 –0.191 CD1 0.570 0.719 ACD1 0.920 –0.090 ABCD1 0.952 –0.028 B1 0.419 –0.048
A: assets, B: operating cost, C: employees, D: years, and 1: revenue.
and all of them except B1 have input A (total assets). The rest of the models, BC1, BD1, C1, BCD1, D1, and CD1 are associated with positive loadings, and all of them have input C (employees) or input D (years in business).
Thus, the second component discriminates between models of efficiency that have ‘asset’ as a variable and models of efficiency that have ‘number of employees’ or ‘years in business’ as a variable. This component can be called, ‘asset-oriented versus manpower and experience ‘asset-oriented.’ The efficiency oriented operating costs did not vary in mobile content companies and was not a specific feature of mobile content companies.
2. Efficiency in Individual Mobile Content Companies Multidimensional scaling (MDS) was applied to the outcome of a PCA of mobile content companies’ efficiency in order to identify a pattern and the structure of the efficiency of 100 mobile content companies. Figure 2 is a bi-plot showing the component loadings of the efficiency models identified through the PCA and the factor scores of the mobile content companies [39].
The vectors represent the models while the coordinates represent the companies. As can be seen, a smaller slip angle between the vectors indicates a close relationship between the models. Accordingly, a relatively close relationship exists between D1, C1, CD1, BCD1, BC1, and BD1 and between A1 and AB1. Of these two groups, the first is a manpower/ experience efficiency model and the second is an asset efficiency model. The relative positions of the companies in each model can be understood through an orthographic projection in different vectors. This enables an analysis of the efficiency of individual mobile content companies. While Company G17 (located at the top) showed high efficiency in
Fig. 2. Principal component scores of mobile content companies and ideal vectors for the DEA models.
(Manpower & experience efficiency) (Overall efficiency) (Asset efficiency) PC2 PC1 –2 –1 0 1 2 3 4 –4 –3 –2 –1 0 1 2 3 4
Table 8. Discriminant analysis results.
Test of equality of group means (game vs. non-game companies) Wilks’ Λ F df1 df2 Sig.
A1 0.961 3.960 1 98 *0.049 CD1 0.952 4.943 1 98 *0.028 ABCD1 0.999 0.115 1 98 0.732
Results for multivariate discriminant function
Wilks’Λ χ2 df Sig.
0.916 8.493 3 *.037
*P<0.05
terms of manpower (C) and experience (D), it showed low efficiency in asset (A). In Fig. 2, another remarkable find was that G1, G17, G21, G22, G25, and G26 mobile game firms were located in manpower and experience efficiency models. MDS showed only a spatial map but it didn’t test statistics significance. We need an additional analysis to test relationships between types of mobile content companies and types of efficiency. 3. Validating the Results
efficiency and mobile content type using discriminant analysis. A discriminant function was set in which the dependent variable is the indicator of the group of companies and is assigned as 1 for game firms and 0 for the remaining companies. We are interested in manpower and experience efficiency, overall measured efficiency, and asset efficiency. The efficiencies obtained using models A1, CD1, and ABCD1 have been selected as representative members of each of the three model groups in Fig. 2. The discriminatory power of each DEA efficiency model can be assessed by looking at the value of the F statistic [37].
Table 8 provides the Wilks’ Λ obtained for A1, CD1, and ABCD1, and their corresponding F statistic values. Models A1 and CD1 result in F values that are highly significant, but the F statistic of model ABCD1 is not statistically significant, which means it has little discriminatory power. From the point of view of overall efficiency (ABCD1), one can conclude that there is little discriminatory power between game firms and the others.
Game companies have an advantage in high efficiency scores if the DEA model contains employees and years in business as inputs. The remaining mobile content companies have an advantage of high efficiency scores in a model containing assets as an input. A multivariate discriminant function includes all three models (A1, CD1, and ABCD1). The results confirm that there are efficiency differences between game companies and the rest of the mobile content companies, and that these differences are related to their inputs.
4. Implication
This research aims to evaluate the efficiency of mobile content companies and present them with strategies based on an analysis of the characteristics of the mobile content market. A DEA of 100 mobile content companies showed only 11 to be efficient. This finding is consistent with the structure of the Korean mobile content market, which is dominated by a small number of companies. Moreover, the mobile content companies identified as being efficient showed varying levels of efficiency in different areas.
A PCA based on the DEA of a mobile content company was performed to analyze the efficiency of all mobile content companies. The PCA showed a contrast in the mobile content companies’ asset efficiency and labor/experience efficiency. This shows that the different efficiencies of a mobile content company do not equally contribute to its global efficiency. Such a finding is consistent with the categorization of mobile content into creative content and processed information [24], [17]. Human resources are more important in the development of new and creative mobile content, whereas programs and
systems that convert conventional platforms into a mobile platform are important for the efficient processing of information.
Further analysis of the results of the DEA and PCA showed that mobile game companies’ labor/experience efficiency was higher than that of other companies. This difference in labor/experience efficiency was also verified through a discriminant analysis. Mobile games tend to be creative content as they are critically influenced by the mobile environment, whereas other mobile content tends to be processed information. Also, the experience efficiency of newer companies is superior to that of companies that have been established longer, as the lifecycle of mobile contents is short. What this verifies is that companies that deal with processed information which is converted from conventional platforms into a mobile platform have more business experience but generate less revenue, whereas companies that deal with creative content generate more profit despite having less business experience.
We derived efficiency strategies for creative content and processed information companies. The revenue potential of creative content companies is chiefly determined by the management of their personnel. Also, due to the short life cycle of game products, short-term strategies have greater and more immediate consequences on the performance of these companies than on their long-term strategies. For processed information companies, an efficient management of assets, particularly systems and equipment, which are their most important assets and have the greatest influence on their revenue performance, is a crucial requirement. In order for processed information companies to continue and advance their business, creative content will need to be included in their business field. These strategies can be referenced in the formation of advanced strategies to achieve increased efficiency based on mobile content companies’ characteristics and government policies.
V. Conclusion
Mobile content has restrictions which exist due to mobile frequency resources and device capacities, but the notable convenience of mobile content increases the growth potential of the mobile content market around the world. Mobile content is divided into processed information. While creative content is expected to become highly profitable in the future, their development is still at an early stage and the majority of existing mobile content is processed information.
Also, mobile content companies generally generate revenue by charging users a fee for downloading and using content. This revenue model followed by mobile content company sets
it apart from other Internet-based companies that implement a variety of revenue models. Furthermore, most research on mobile content has been on the development of new business models, content distribution and user behavior, while research on mobile content companies has been almost nonexistent.
While it was anticipated that the Korean mobile content market would become a key growth engine of the future, it is actually decreasing in size, and thus its efficiency needs to be assessed. Key indexes selected for the efficiency assessment were critical factors in a business operational capacity and in knowledge-based industry, such as assets, operational expenses, and human resources. Although the traditional DEA technique assesses the efficiency of a single mobile content company and presents business strategies, it cannot assess the mobile content industry as a whole. To collectively assess mobile content companies instead of individual ones, the PCA and MSD techniques were applied to the outcome of the efficiency assessment of individual mobile content companies in order to identify efficiencies found in all of them. Consequently, asset efficiency and manpower/experience efficiency were determined by inputs. A detailed analysis of the difference in efficiencies was carried out for each of the various types of mobile content and the cause of the differences was examined to present strategies towards increased efficiency.
The main contribution of this study has attempted to establish a framework based on the DEA-PCA methodology for assessment of the efficiency of mobile content companies and formation of strategies to further develop the mobile content industry. Despite these findings, certain limitations remain. This evaluation is based only on the financial data of the firms considered; non-financial data was not taken into account. In recent years, non-financial data, such as the number of visitors to a company’s website and other website access statistics, has been increasingly included in the efficiency evaluations of Internet companies. In this study, we were not able to include these types of data due to the difficulty in obtaining information, such as the content quantity, QoS, and number of downloads. Also, this study focused exclusively on Korean mobile content companies. Future research could use more data and expand the number of countries to make the evaluation framework more robust.
References
[1] Korea Communications Commission, Plan to Activate the Mobile Internet, Mar. 2009.
[2] C. Serrano-Cinca, Y. Fuertes-Callén, and C. Mar-Molinero, “Measuring DEA Efficiency in Internet companies” Decision
Support Syst., vol. 38, no. 4, 2005, pp 557-573.
[3] K.J. Lee, J.J. Kim, and G. Cho, “The Evaluation of the Efficiency
of Internet Companies Using a DEA Model,” J. Korea Manag., vol. 20, no. 1, 2005, pp. 109-136.
[4] E. Thanassoulis, Introduction to the Theory and Application of
Data Envelopment Analysis, Kluwer Academic Publishers, 2003.
[5] H.J. Wen, B. Lim, and H.L. Huang, “Measuring E-Commerce Efficiency: A Data Envelopment Analysis (DEA) Approach,” Ind.
Manag. & Data Syst., vol. 103, 2003, pp. 703-710.
[6] C.T.B. Ho and D.D. Wu, “Online Banking Performance Evaluation Using Data Envelopment Analysis and Principal Component Analysis,” Computer and Operation Research, vol. 36, 2009, pp. 1835-1842.
[7] C.H. Park, S.S Han, and W.H. Seok, “Mobile Telecommunications Market Regulations and Carrier Performance: The Korea Case,” ETRI J., vol. 32, no. 1, 2010, pp. 129-138.
[8] C. Kim et al., “A Systematic Approach to New Mobile Service Creation,” Expert Syst. Appl., vol. 35, 2008, pp. 762-771. [9] S. Kwon et al., “Activation Scheme of Mobile Contents in the
Wireless Internet,” Korea Communications Commission, Nov. 2009.
[10] OECD, Digital Broadband Content: Mobile Content New Content for New Platforms, May 2005.
[11] P.M.C. Swatman, C. Krueger, and K. van der Beek, “The Changing Digital Content Landscape: An Evaluation of e-Business Model Development in European Online News and Music,” Internet Research, vol. 16, 2006, pp. 53-80.
[12] C. Kim, E. Oh, and N. Shin, “An Empirical Investigation of Digital Content Characteristics, Value, and Flow,” J. Computer
Inf. Syst., vol. 50, 2010, pp. 79-87.
[13] A. Holzer and J. Ondrus, “Mobile Application Market: A Developer’s Perspective,” Telematics and Informatics, vol. 28, 2011, pp. 22-31.
[14] Y.G. Joo and S.Y. Sohn, “Structural Equation Model for Effective CRM of Digital Content Industry,” Expert Syst. Appl., vol. 34, 2008, pp. 63-71.
[15] R.B. Fich and A. Benbunan, “Understanding User Behavior with New Mobile Applications,” J. Strategic Inf. Syst., vol. 16, 2007, pp. 393-412.
[16] National Assembly Researcher Service, Plan to Activate the Mobile Internet Using Mobile Open Market, Mar. 2010.
[17] C. Feijoo et al., “Exploring a Heterogeneous and Fragmented Digital Ecosystem: Mobile Content,” Telematics and Informatics, vol. 26, 2009, pp. 282-292.
[18] J. Eckhardt, M. Lundborg, and C. Schlipp, “Digital Rights Management (DRM) and the Development of Mobile Content in Europe,” Computer Law and Security Report, vol. 23, 2007, pp. 543-549.
[19] M. Lundborg and E.O. Ruhl, “The Impact of Future Frequency Regulation on Business Models for Mobile TV,” CiCT Conf., Lyngby Copenhagen, Denmark, Nov. 30- Dec. 1, 2006.
[20] H.K. Sabat, “The Evolving Mobile Wireless Value Chain and Market Structure,” Telecommun. Policy, vol. 26, 2002, pp. 505-535.
[21] A. Tsalgatidou and E. Pitoura, “Business Models and Transactions in Mobile Electronic Commerce: Requirements and Prorperties,” Computer Network, vol. 37, 2001, pp. 221-236. [22] MCF, Survey Results about Mobile Content Industry Structure,
July, 2009.
[23] D. Choi et al., “A Study on Global Digital Content Industry: Domestic Digital Content Market Survey,” Korea IT Industry Promotion Agency, Jan. 2009.
[24] I. Maghiros, F. Abadie, and C. Pascu, Introduction to the State of
the Art of the Creative Content Sector, Seville: Institute of
Prospective Technological Studies, 2007. [25] Global Mobile Forecast, Yankee Group, Dec. 2008.
[26] M.J. Farrell, “The Measurement of Productive Efficiency,” J.
Royal Statistical Soc., Series A, vol. 120, Part III, 1957, pp.
253-289.
[27] A. Charnes, W.W. Cooper, and E. Rhodes, “Measuring the Efficiency of Decision Making Units,” European J. Operational
Research, vol. 2, 1978, pp. 429-444.
[28] J. Cubbin and G. Tzanidakis, “Regression Versus Data Envelopment Analysis for Efficiency Measurement: An Application to the England and Wales Regulated Water Industry,” Utility Policy, vol. 7, 1998, pp. 75-85.
[29] A. Azadeh et al., “An Integrated DEA-COLS-SFA Algorithm for Optimization and Policy Making of Electricity Distribution Units,” Energy Policy, vol. 37, 2009, pp. 2605-2618.
[30] A. Barua et al., “DEA Evaluations of Long- and Short-Run Efficiencies of Digital vs. Physical Product ‘Dot Com’ Companies,” Socio-Economic Planning Sciences, vol. 38, 2004, pp. 233-253.
[31] N.K. Avkiran and B.R Parker, “Pushing the DEA Research Envelope,” Socio-Economic Planning Sciences, vol. 44, 2010, pp. 1-7.
[32] Y. Chen, L. Motiwalla, and M.R. Khan, “Using Super-Efficiency DEA to Evaluate Financial Performance of e-Business Initiative in the Retail Industry,” Int. J. Inf. Tech. & Decision Making, vol. 3, no. 2, 2004, pp. 337-351.
[33] B. Golany and Y. Roll, “An Application Procedure for DEA,”
Omega, vol. 17, 1989, pp. 237-250.
[34] D.D. Wackerly, W. Mendenshall III, and R.L. Scheaffer,
Mathematical Statistics with Applications, Duxbury, 2002.
[35] M. Sigala, “Using Data Envelopement Analysis for Measuring and Benchmarking Productivity in the Hotel Sector,” J. Travel
and Tourism Marketing, vol. 16, 2004, pp. 39-60.
[36] L.M. Seiford and J. Zhu, “Profitability and Marketability of the Top 55 U.S. Commercial Banks,” Manag. Sci., vol. 45, 1999, pp. 1270-1288.
[37] N. Donthu and B. Yoo, “Retail Productivity Assessment Using
Data Envelopment Analysis,” J. Retailing, vol. 74, 1998, pp. 89-105.
[38] G.H. Dunteman, Principal Components Analysis, Newbury Park, CA, USA: Sage University Paper Series on Quantitative Applications in the Social Sciences, 1999.
[39] H. Kang et al., Multivariate Analysis with SAS: A Primer with
Examples, Seoul: Jayu Academy, 2005.
Eun Jin Cho received her BBA and MS in
business administration from Chung-Ang University in 1998 and 2000, respectively, and her PhD in management science from KAIST in 2011. Since 2000, she has worked at ETRI as a member of the research staff. Her major research interests include telecom regulations, IT policy and strategy, technology commercialization, and new media business models.
Myeong Cheol Park received his BS and MA
from Seoul National University, and his PhD in business administration from the University of Iowa. He has worked at ETRI for 17 years as a member of the research staff. Currently, he is a professor of the Management Science Department at Korea Advanced Institute of Science and Technology. He is a board member of Communication Policy Research South (CPRsouth). His major research interests include telecommunications management strategy, ICT economics, and telecommunications policy and regulations.