Hyang Woon Lee, MD,
PhD
Jagriti Arora, MS
Xenophon Papademetris,
PhD
Fuyuze Tokoglu, MS
Michiro Negishi, PhD
Dustin Scheinost, MS
Pue Farooque, MD
Hal Blumenfeld, MD,
PhD
Dennis D. Spencer, MD
R. Todd Constable, PhD
Correspondence to Dr. Lee: leeh@ewha.ac.kr Supplemental data at Neurology.orgAltered functional connectivity in seizure
onset zones revealed by fMRI intrinsic
connectivity
ABSTRACT
Objective:
The purpose of this study was to investigate functional connectivity (FC) changes in
epileptogenic networks in intractable partial epilepsy obtained from resting-state fMRI by using
intrinsic connectivity contrast (ICC), a voxel-based network measure of degree that reflects the
number of connections to each voxel.
Methods:
We measured differences between intrahemispheric- and interhemispheric-ICC
(ICC
intra2inter) that could reveal localized connectivity abnormalities in epileptogenic zones
while more global network changes would be eliminated when subtracting these values. The
ICC
intra2intermap was compared with the seizure onset zone (SOZ) based on intracranial EEG
(icEEG) recordings in 29 patients with at least 1 year of postsurgical follow-up. Two independent
reviewers blindly interpreted the icEEG and fMRI data, and the concordance rates were compared
for various clinical factors.
Results:
Concordance between the icEEG SOZ and ICC
intra2intermap was observed in 72.4%
(21/29) of the patients, which was higher in patients with good surgical outcome, especially in
those patients with temporal lobe epilepsy (TLE) or lateral temporal seizure localization.
Concor-dance was also better in the extratemporal lobe epilepsy than the TLE group. In 85.7% (18/21) of
the cases, the ICC
intra2intervalues were negative in the SOZ, indicating decreased FC within the
epileptic hemisphere relative to between hemispheres.
Conclusions:
Assessing alterations in FC using fMRI-ICC map can help localize the SOZ, which
has potential as a noninvasive presurgical diagnostic tool to improve surgical outcome. In
addi-tion, the method reveals that, in focal epilepsy, both intrahemispheric- and interhemispheric-FC
may be altered, in the presence of both regional as well as global network abnormalities.
Neurology®2014;83:2269–2277
GLOSSARY
CI5 confidence interval; ETLE 5 extratemporal lobe epilepsy; EZ 5 epileptogenic zone; FC 5 functional connectivity; FoV 5 field of view; ICC5 intrinsic connectivity contrast; icEEG 5 intracranial EEG; MNI 5 Montreal Neurological Institute; MPRAGE5 magnetization-prepared rapid acquisition with a gradient echo; rs-fMRI 5 resting-state fMRI; SOZ 5 seizure onset zone; TE5 echo time; TLE 5 temporal lobe epilepsy; TR 5 repetition time.
Epilepsy can be conceptualized as a network disorder that may involve not only epileptogenic
regions but also remote cortical areas.
1,2Examination of epileptogenic networks may provide
a better understanding of seizure generation and propagation to other brain regions.
Further-more, understanding the network properties may help guide surgical intervention for better
postoperative outcomes in refractory epilepsy. Various measures of connectivity have been used
to better understand epileptogenic networks.
2–6Functional connectivity (FC) measurements from resting-state fMRI (rs-fMRI) data can
pro-vide new insights into epileptogenic networks.
7Previous studies in focal epilepsy, focusing
mostly on medial temporal lobe epilepsy (TLE), reported variable results: FC usually decreased
From the Department of Neurology (H.W.L.), Ewha Womans University School of Medicine and Ewha Medical Research Institute, Seoul, Korea; and Departments of Neurology (H.W.L., P.F., H.B.), Diagnostic Radiology (H.W.L., J.A., X.P., F.T., M.N., R.T.C.), Biomedical Engineering (X.P., D.S., R.T.C.), Neurosurgery (H.B., D.D.S., R.T.C.), and Neurobiology (H.B.), Yale University School of Medicine, New Haven, CT. Go to Neurology.org for full disclosures. Funding information and disclosures deemed relevant by the authors, if any, are provided at the end of the article. The Article Processing Charge was paid by internal funds in the Department of Diagnostic Radiology, Yale University School of Medicine. This is an open access article distributed under the terms of the Creative Commons Attribution-Noncommercial No Derivative 3.0 License, which permits downloading and sharing the work provided it is properly cited. The work cannot be changed in any way or used commercially.but sometimes increased in the seizure focus,
and also changed in the contralateral temporal
and other cortical areas.
8–16Examining FC
changes might help localize the epileptogenic
zone (EZ).
17Nevertheless, few rs-fMRI studies
have compared this directly with postsurgical
outcome.
To apply fMRI FC analysis to localize the
EZ regardless of the seizure focus requires a
voxel-based analysis method that does not rely
on a priori assumptions as to specific regions of
interest. Epileptogenic networks may involve
nodes ipsilateral or contralateral to the seizure
focus, thus network properties could lead to
both intrahemispheric- and
interhemispheric-FC alterations.
7To distinguish the seizure
focus from other changes in remote brain
areas, a contrast between
intrahemispheric-and interhemispheric-FC was introduced.
Differences between intrahemispheric- and
interhemispheric-FC maps were compared
with the seizure onset zone (SOZ) identified
based on intracranial EEG (icEEG) recordings
in epilepsy surgery patients. We also compared
the concordance rates in subgroups of various
clinical factors.
METHODS Subjects.We analyzed data retrospectively from 29 patients with intractable partial epilepsy. The inclusion criteria were patients who (1) were referred for anatomical MRI and rs-fMRI between October 2004 and February 2011, (2) subsequently underwent epilepsy surgery after icEEG seizure recordings, and (3) had at least 1 year of postsurgical follow-up. The patients’ data were compared with those of 85 normal healthy volunteers (male/female5 44:41, mean age 34.7 6 11.3 years).
Standard protocol approvals, registrations, and patient consents.Written informed consent was obtained from all par-ticipants. This study was approved by the Human Investigational Committee of the Yale University School of Medicine.
Data acquisition.All patients had 2 to 8 runs of rs-fMRI using a 3T MR scanner (Siemens Trio, Siemens Medical, Erlangen, Germany) or a 1.5T MR scanner (Siemens Sonata) with short breaks between runs (less than a minute) to provide high-quality data free of motion artifacts. Images were acquired with an echoplanar imaging sequence with a 2-second repetition time (TR), 30-millisecond echo time (TE), 256-mm field of view (FoV), 90° flip angle, 643 64 matrix size, 4 3 4 mm in-plane resolution, and 4-mm slice thickness without gap, generating 220 image volumes. Each control subject had 8 runs of rs-fMRI using the 3T MR scanner with the same imaging parameters.
Anatomical images were acquired with 2-dimensional (300-millisecond TR, 2.43-millisecond TE, 60° flip angle) and 3-dimensional T1-weighted sagittal magnetization-prepared rapid acquisition with a gradient echo (MPRAGE) sequence (2,530-millisecond TR, 3.34-millisecond TE, 7° flip angle) with
256-mm FoV, 2563 256 matrix size, 1-mm thickness, and 176 contiguous slices.
FC analysis using intrinsic connectivity contrast.To calcu-late the intrinsic connectivity contrast–degree (ICC-dth) measure,
the correlation between the rs-fMRI BOLD time course of a reference voxel and all other gray matter voxels was determined, and the number of such correlations above a correlation threshold (.0.25) was used as a measure of the degree reflecting network connectivity.18
First, 2 ICC-dthmaps were computed for each voxel to capture
hemispheric differences in FC after preprocessing. The first map was of a voxel’s connectivity within the ipsilateral hemisphere (ICCintra). The second map was of voxel’s connectivity to the
con-tralateral hemisphere (ICCinter). Both maps were generated for each
voxel in the gray matter. Finally, the difference map was created by subtracting ICCinter from ICCintra(ICCintra2inter) to cancel out
global network alterations (figure 1). ICC values were normalized to fit a gaussian distribution with zero mean and unitary variance, and smoothed with a 6-mm gaussian kernel. To compute the group statistics, single subject results were normalized to the Montreal Neurological Institute (MNI) standard template using the intensity-only component as implemented in BioImage Suite soft-ware (www.bioimagesuite.org).19,20
Differences between each individual patient and the 85 con-trol subjects were identified using a group t test (p, 0.05 with family-wise error correction, 20-voxel cluster threshold). The ICCintra2intermap was initially created with a threshold t value
of 2.0 in each patient, then adjusted stepwise by a t value of 0.05 to a higher threshold if the map showed diffuse and widespread changes, or to a lower threshold if it revealed too subtle changes. Regions with reliable ICC differences were identified anatomi-cally by using the Talairach Daemon Atlas21after transforming
MNI coordinates into Talairach coordinates corrected using a nonlinear transformation.22
Anatomical localization of 3-dimensional electrode positions and coregistration to ICC maps.Intracranial elec-trodes (Ad-Tech Medical Instruments Corp., Racine, WI) were implanted as part of surgery procedures. All patients underwent pre- and postoperative MRI and CT scans with subdural electro-des. MRI was performed as described above, and Lightspeed CT (Siemens Medical) was done with parameters of 120 kVp, 600 milliseconds/220 mA, helical/64 mode, 1.5-mm thickness without gap, and 260 3 220 mm FoV. Electrode locations were identified using the postoperative CT and postoperative MRI, and registered to the preoperative MRI,23 then
coregistered to the MPRAGE image of individual patients using BioImage Suite.19 This sequence of registrations allows
the electrode locations and ICC maps to be coregistered and displayed on the individual’s MPRAGE image (figure 1).
Identification of the icEEG SOZ. All patients underwent icEEG recording using 128-channel video-EEG monitoring equipment (Bio-Logic Systems Corp., Mundelein, IL) with 16-bit A/D conversion, 256-Hz sampling, 90-dB common mode rejection ratio, and 0.1- to;70-Hz bandpass filter. First, the icEEG was reviewed separately, blind to other clinical information, by 2 expert neurologists (H.W.L. and P.F.) to identify the SOZ using traditional icEEG visual analysis. If the results disagreed, the 2 reviewers discussed the case to reach a final consensus or declare the case nonlocalizing if they could not localize the SOZ or failed to reach an agreement.
Concordance between the icEEG SOZ and fMRI-ICC maps. The concordance rate was evaluated between the
fMRI-ICC map and icEEG SOZ, not resected cortical area in postoperative imaging. This was because not all of these patients had postoperative MRI (some of them had postoperative CT instead) and several patients had multiple subpial transections with or without partial surgical resection since the cortical area included a functionally eloquent region. The results of ICC maps were interpreted separately by 2
reviewers (H.W.L. and R.T.C.) who were blinded to all other clinical data. The fMRI-ICC maps were presented to the 2 reviewers separately, in random patient order. In cases with multiple cortical regions with mixed increased or decreased ICC changes, only the cortical area showing the largest cluster with the peak intensity difference was taken into account. In the same manner as for the icEEG, if the 2 reviewers disagreed,
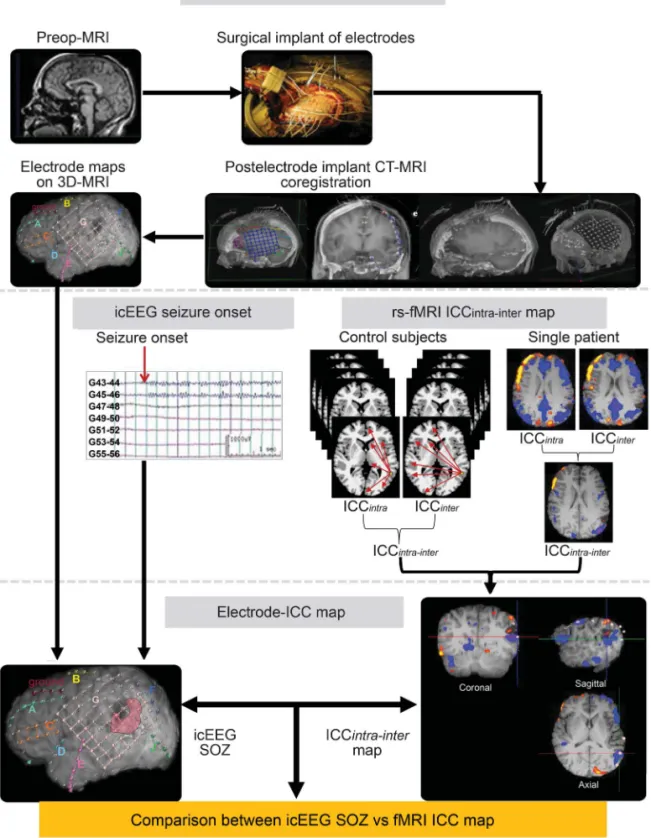
Figure 1 Diagram summarizing the preprocessing steps and the creation of the ICC map to compare with the icEEG SOZ
The ICC was measured for each voxel, reflecting the number of connections to each voxel from all other voxels in the gray matter either within the same hemisphere (intrahemispheric) or between hemispheres (interhemispheric). After normaliza-tion of the ICC maps with those from control subjects, the within-subject difference of intrahemispheric- and interhemi-spheric-ICC (ICCintra2inter) was compared with the icEEG SOZ in individual patients. ICC5 intrinsic connectivity contrast;
they discussed the case to reach a consensus or categorize it as nonlocalizing.
For both the icEEG SOZ and fMRI-ICC maps, the reviewers interpreted the cortical localization of abnormality as to the side, lobar, or sublobar. The concordance between these modalities was determined on the coregistered 3-dimensional brain surface rendering of electrode locations and ICC maps in each patient. Concordance was determined only when there was spatial overlap between the SOZ and ICC change regions at the same sublobar location. Surgical outcomes were determined based on the Engel classification24and International League Against Epilepsy
out-come criteria.25
Statistical analysis.To assess the reliability of each test modal-ity, agreement rates were calculated between the reviewers based on their initial independent interpretations using Cohenk coef-ficient. The reliability of concordance between the icEEG SOZ and ICC maps was determined based on the final consensus using generalizedk-type statistics.26Thex2test for proportions was
used to compare concordance rates in subgroups of patients with various clinical factors including surgical outcome and final local-ization. Statistical results were calculated using Stata 10.0 (Stata-Corp, College Station, TX) fork coefficients and SPSS 16.0.0 (SPSS Inc., Chicago, IL) for other tests, with p, 0.05 considered significant.
RESULTS
The patients were 14 males and 15
females, with the age range of 7 to 55 years (mean
29.4
6 11.3). There were 13 patients with TLE
and 16 with extratemporal lobe epilepsy (ETLE),
with a mean seizure onset age of 12.4
6 8.1 years
and a mean epilepsy duration of 13.9
6 7.4 years
(table 1). The interrater agreement rate for ICC
intra-2interinterpretation was 89.7% (
k 5 0.66, 95%
con-fidence interval [CI]
5 0.31–1.00), which was
comparable to that of the icEEG SOZ (agreement
rate 93.1%,
k 5 0.79, 95% CI 0.51–1.00). ICC
in-tra2intermaps showed localized changes in 23 of 29
patients. Among them, 21 patients showed
concor-dance of their ICC
intra2intermaps with their icEEG
SOZ (91.3%,
k 5 0.76, 95% CI 0.44–1.00).
In 18 of the cases with concordance (18/21,
85.7%), ICC
intra2interwas negative in the SOZ,
indi-cating decreased FC within the epileptic hemisphere
relative to between hemispheres. The remaining 3
patients with concordance (3/21, 14.3%) had
posi-tive values of ICC
intra2interin the SOZ, indicating
lower interhemispheric FC than intrahemispheric
FC.
Representative cases are shown in figures 2 and 3.
Patient 5 in table 1 with lesional TLE had negative
values on the ICC
intra2intermap in the left lateral
tem-poral cortical region that matched well with the icEEG
SOZ at the posteroinferior border of the structural
lesion (figure 2), indicating lower connectivity within
the epileptic hemisphere relative to between
hemi-spheres in this area. In contrast, patient 14 with lesional
ETLE had positive values on the ICC
intra2intermap in
the right parietooccipital SOZ (figure 3), indicating
lower interhemispheric relative to intrahemispheric
FC in this area. These 2 patients were seizure free after
surgery.
The overall concordance between the icEEG SOZ
and ICC
intra2intermap was higher in patients with
good surgical outcome than those with poor outcome
(93.3% vs 50.0%). This was particularly the case in
patients with TLE (85.7% vs 50.0%) and lateral
tem-poral seizure localization (80.0% vs 0%). Concordance
was also better in the ETLE than TLE group (93.8%
vs 46.2%,
x
25 8.134, p 5 0.010). Of note,
concor-dance was good in ETLE regardless of seizure outcome
(100% vs 87.5%), while in TLE, it was better with
good outcome than poor outcome (85.7% vs 0%)
(table 2). No specific trends were observed in other
patient subgroups (table 2, table e-1 on the Neurology
®Web site at Neurology.org).
DISCUSSION
This study demonstrates that FC
mapping at the voxel level, based on rs-fMRI data,
may
provide
additional
information
for
the
identification of the EZ, potentially improving surgical
outcome. Differences between intrahemispheric- and
interhemispheric-ICC
values
(ICC
intra2inter)
were
mapped and compared with the icEEG SOZ in 29
epilepsy surgery patients. The main findings of this
study were as follows: (1) concordance between the
icEEG SOZ and ICC
intra2intermap was observed in
72.4% (21/29), (2) ICC
intra2intermaps in the SOZ
showed lower FC within the epileptic hemisphere
relative to between hemispheres in 85.7% (18/21),
and (3) concordance was higher in patients with good
surgical outcome (especially in those with TLE and
lateral temporal seizure localization) and also better in
the ETLE than TLE group. Our findings suggest the
possibility that this approach could add another
information dimension in the workup of patients who
are candidates for epilepsy surgery.
Most rs-fMRI studies in partial epilepsy, mainly
targeting medial TLE, have reported decreased
FC,
6,8,9,14,16but a few studies have shown increases
in connectivity.
11,17In addition to changes in the
sei-zure focus, contralateral temporal or remote cortical
changes were reported as well.
6,12,13,15,16The
variabil-ity of these findings might be related to patient
het-erogeneity or methodologic differences. Only a few
patients with neocortical epilepsy (included mainly in
the TLE cohorts) have been studied with rs-fMRI so
far.
4,17Changes in areas remote to the seizure focus or
in the contralateral hemisphere have also been
re-ported in other human studies using different
neuro-imaging
modalities
such
as
PET.
27,28The
mechanisms for changes outside the seizure foci are
not completely understood, but frequent seizure
spread with comorbid neurobehavioral abnormalities
and possible compensatory mechanisms have been
suggested.
29A study using a tetanus toxin rat model
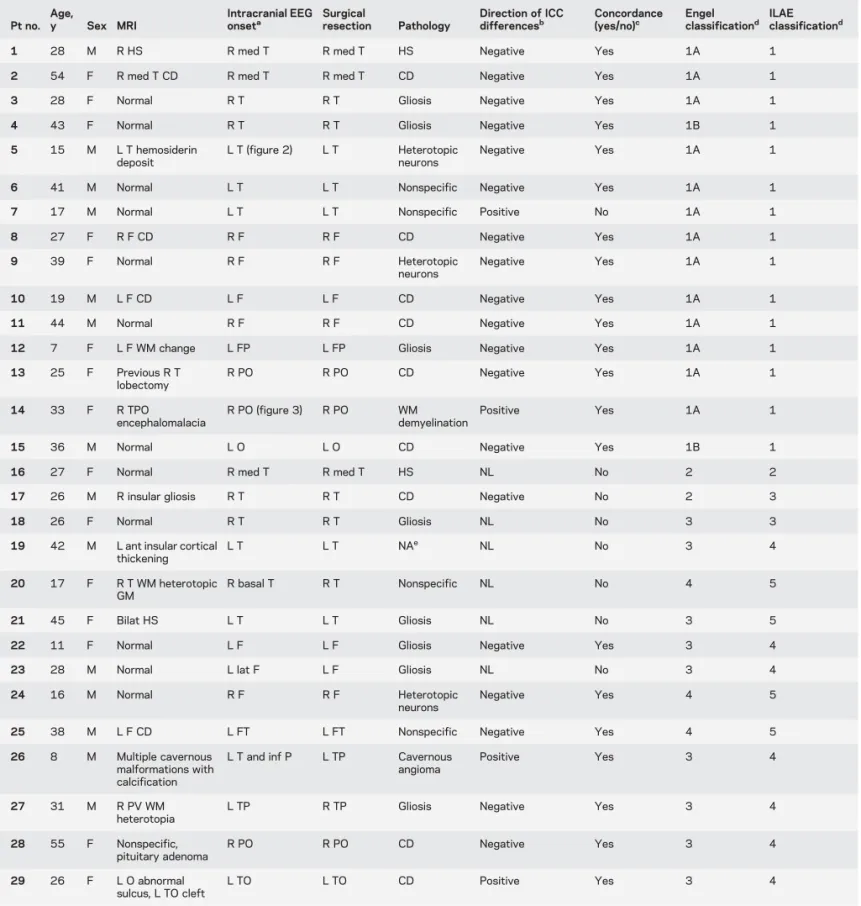
Table 1 Clinical information of all patients and concordance between intracranial EEG seizure onset and fMRI-ICC maps
Pt no. Age,
y Sex MRI
Intracranial EEG
onseta Surgicalresection Pathology Direction of ICCdifferencesb Concordance(yes/no)c Engelclassificationd ILAEclassificationd
1 28 M R HS R med T R med T HS Negative Yes 1A 1
2 54 F R med T CD R med T R med T CD Negative Yes 1A 1
3 28 F Normal R T R T Gliosis Negative Yes 1A 1
4 43 F Normal R T R T Gliosis Negative Yes 1B 1
5 15 M L T hemosiderin deposit
L T (figure 2) L T Heterotopic neurons
Negative Yes 1A 1
6 41 M Normal L T L T Nonspecific Negative Yes 1A 1
7 17 M Normal L T L T Nonspecific Positive No 1A 1
8 27 F R F CD R F R F CD Negative Yes 1A 1
9 39 F Normal R F R F Heterotopic
neurons
Negative Yes 1A 1
10 19 M L F CD L F L F CD Negative Yes 1A 1
11 44 M Normal R F R F CD Negative Yes 1A 1
12 7 F L F WM change L FP L FP Gliosis Negative Yes 1A 1
13 25 F Previous R T lobectomy R PO R PO CD Negative Yes 1A 1 14 33 F R TPO encephalomalacia R PO (figure 3) R PO WM demyelination Positive Yes 1A 1
15 36 M Normal L O L O CD Negative Yes 1B 1
16 27 F Normal R med T R med T HS NL No 2 2
17 26 M R insular gliosis R T R T CD Negative No 2 3
18 26 F Normal R T R T Gliosis NL No 3 3
19 42 M L ant insular cortical thickening L T L T NAe NL No 3 4 20 17 F R T WM heterotopic GM R basal T R T Nonspecific NL No 4 5 21 45 F Bilat HS L T L T Gliosis NL No 3 5
22 11 F Normal L F L F Gliosis Negative Yes 3 4
23 28 M Normal L lat F L F Gliosis NL No 3 4
24 16 M Normal R F R F Heterotopic
neurons
Negative Yes 4 5
25 38 M L F CD L FT L FT Nonspecific Negative Yes 4 5
26 8 M Multiple cavernous malformations with calcification
L T and inf P L TP Cavernous angioma
Positive Yes 3 4
27 31 M R PV WM
heterotopia
L TP R TP Gliosis Negative Yes 3 4
28 55 F Nonspecific, pituitary adenoma R PO R PO CD Negative Yes 3 4 29 26 F L O abnormal sulcus, L TO cleft L TO L TO CD Positive Yes 3 4
Abbreviations: ant5 anterior; bilat 5 bilateral; CD 5 cortical dysplasia; F 5 frontal; FP 5 frontoparietal; FT 5 frontotemporal; GM 5 gray matter; hemi 5 hemisphere; HS5 hippocampal sclerosis; ICC 5 intrinsic connectivity contrast; ILAE 5 International League Against Epilepsy; inf 5 inferior; lat 5 lateral; med5 medial; NA 5 not available; NL 5 nonlocalized; O 5 occipital; P 5 parietal; PO 5 parietooccipital; pt 5 patient; PV 5 periventricular; sup 5 superior; T5 temporal; TO 5 temporooccipital; TP 5 temporoparietal; TPO 5 temporoparieto-occipital; WM 5 white matter.
aBased on intracranial seizure onset electrodes. bEither negative or positive difference in ICC
intra2intermaps.
cEither concordant (yes) or discordant (no) based on the sublobar localization. dPostsurgical seizure outcome.
for focal neocortical epilepsy, where the etiology and
the seizure focus were controlled to be identical in all
animals, showed decreased interhemispheric but
increased intrahemispheric FC in the epileptic and
nonepileptic hemispheres, but these changes altered
with time.
30In this focal epilepsy model, the
func-tional alterations observed were not restricted to the
epileptic focus but were in multiple brain regions,
supporting the possibility that both regional and
global changes occur in neocortical epilepsy.
It is somewhat counterintuitive that the location
of the SOZ stands out when subtracting the
interhemispheric-ICC from intrahemispheric-ICC
in the majority of our patients. This finding suggests
that FC changes in the EZ have characteristic features
that are distinct within the epileptic hemisphere or
between hemispheres, while FC outside the epileptic
foci is relatively stable within the epileptic and the
contralateral hemispheres. FC could be influenced
in different ways when comparing local vs remote
connectivity (e.g., the former is more related to the
epileptogenesis itself while the latter is associated with
more global changes in network properties).
Recent evidence has suggested that a laterality
index based on FC could be helpful to predict surgical
outcomes but this does not provide information on
the EZ.
4In the current study, we examined whether
FC changes could have localizing value in epilepsy
surgery patients. The concordance between the
icEEG SOZ and fMRI FC changes was analyzed to
investigate whether these FC changes truly represent
the EZ. We observed that the concordance rate
between the 2 modalities was higher in patients with
good surgical outcome. Of note, concordance was
good in ETLE regardless of surgical outcome, while
in TLE it was higher in patients with good outcome.
These findings suggest that this kind of FC mapping
approach may be helpful in improving seizure
local-ization for subgroups of patients with otherwise poor
outcome.
Various methods of network analysis based on
graph theory have been used to assess FC in epileptic
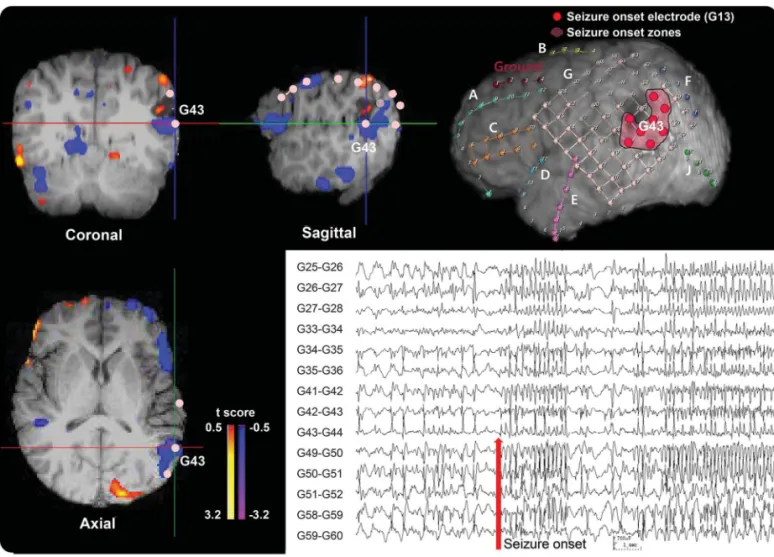
Figure 2 Example of the icEEG SOZ/ICCintra2intermap comparison in a 15-year-old male with lesional temporal lobe epilepsy
Patient 5 (table 1) with cavernous hemangioma shows negative values on the ICCintra2intermap at the posteroinferior border of a structural lesion in the left
lateral temporal area in the top and bottom images on the left and the top image in the middle. This is concordant with the icEEG SOZ as shown in the 3-dimensional MRI surface rendering at the top right (marked as pink) and the bottom right icEEG finding (the red arrow marks a seizure onset). The color bar to the right of the ICC map indicates thet score for difference between intrahemispheric- and interhemispheric-ICC values. Both the results of the ICC map and the icEEG SOZ suggest that the epileptogenic zone is in the left lateral temporal lobe, and this patient has been seizure-free since resection of this region. ICC5 intrinsic connectivity contrast; icEEG 5 intracranial EEG; SOZ 5 seizure onset zone.
networks.
3,6–17,31,32A recent study revealed increased
FC in the icEEG SOZ when using local FC measures
within close cortical areas.
17In the current analysis,
we used the ICC
intra2intermap, since this highlighted
localized changes while the individual ICC
intraand
ICC
intermaps showed diffuse and bilateral changes
that were insufficient for localization in most cases.
Healthy normal brain tissue typically demonstrates
more within hemisphere connectivity and less
contra-lateral hemisphere connectivity.
7In contrast, the
neg-ative values of ICC
intra2interin the EZ in most of our
patients may indicate less FC in that region.
Tradi-tionally,
the
interictal
epileptiform
discharges
observed on EEG are characterized as increased
syn-chrony in the EZ.
33,34Previous studies using scalp or
icEEG reported increased connectivity within the
sei-zure focus, but decreased connectivity outside of the
focus in TLE
11,35and ETLE.
36Several other studies
have challenged this classic view showing that the
synchrony and/or correlation of EEG activity are
dynamically changing over time, or even decreased
at seizure onset.
37Our study suggests that the
epilep-tic hemisphere exhibits lower connectivity than the
contralateral side, although that does not indicate
absolute changes. To assess that, future studies in
larger and more homogeneous groups of patients
would be needed.
One of the difficulties in localizing the ICC changes
was that the ICC maps often showed multifocal
changes in cortical areas in addition to those areas that
matched the SOZ. It is unclear at this time whether the
multiple focal regions (1) result from an epileptogenic
network rather than a single seizure focus, (2) reflect
other aspects of functional changes such as comorbid
neurobehavioral abnormalities,
31,38(3) relate to artifacts
that require further technical improvement in analysis
methods, or (4) result from a combination of all of the
above. The next logical step to fully consider all the
possibilities would be to perform network analyses
(using the same rs-fMRI data) on these multiple nodes
to determine the central node and other network
prop-erties and to correlate these with detailed clinical data.
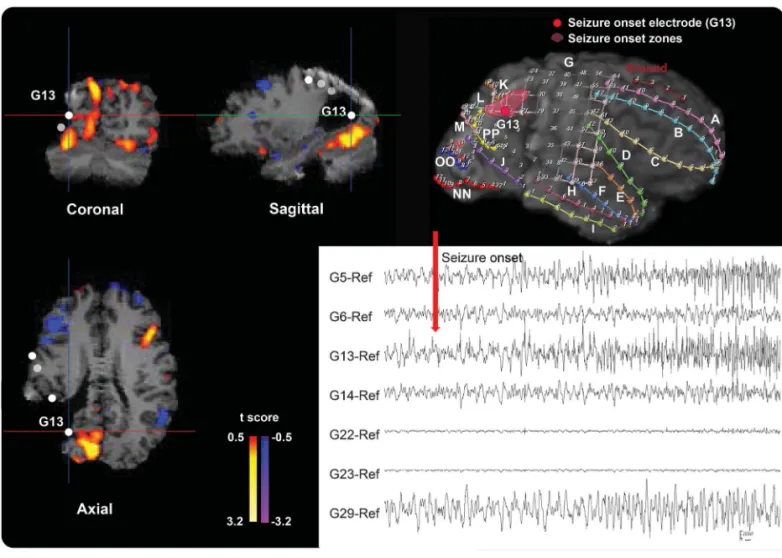
Figure 3 Example of the icEEG SOZ/ICCintra2intermap comparison in a 33-year-old woman with lesional extratemporal lobe epilepsy
Patient 14 (table 1) with right parietooccipital lobe epilepsy shows positive values on the ICCintra2intermap in the right parietooccipital region in the top and
bottom images on the left and the top image in the middle. This matches well with the icEEG SOZ shown in the 3-dimensional MRI surface rendering at the top right (marked as pink) and the bottom right icEEG finding (the red arrow marks a seizure onset). The color bar to the right of the ICC map indicates thet score for difference between intrahemispheric- and interhemispheric-ICC values. Both the results of the ICC map and the icEEG SOZ suggest that the epileptogenic zone is in the right parietooccipital lobe, and this patient has been seizure-free since resection of this region. ICC5 intrinsic connectivity contrast; icEEG5 intracranial EEG; SOZ 5 seizure onset zone.
However, the overall validity of this method is still
under investigation and warrants further studies to
develop an automated and quantifiable method to
select significant connectivity clusters of interest.
FC measurement using rs-fMRI has the potential
to provide a novel noninvasive method to localize the
SOZ as a part of presurgical evaluation. In our study,
the concordance rate between the icEEG SOZ and
fMRI-ICC map was better in patients with good
out-come, suggesting that this kind of approach can be
useful as a biomarker that reflects epileptogenesis
and also predicts surgical outcome in advance when
planning epilepsy surgery. For instance, patients in
whom brain areas showing ICC changes are resected
completely would be expected to have better surgical
outcome. Although it is still in the early stage of
development, with further validation in patients with
intractable partial epilepsy, this kind of approach may
ultimately be useful for both clinical and scientific
purposes, especially as part of presurgical evaluations.
We hope that our study represents a step forward in
developing clinically useful analysis paradigms using
fMRI-based intrinsic connectivity measurements.
AUTHOR CONTRIBUTIONS
Hyang Woon Lee: design and conceptualization of the study design, sub-ject selection, analysis and interpretation of the data, statistical analysis,
drafting and revising the manuscript. Jagriti Arora: data collection, anal-ysis of the fMRI data, statistical analanal-ysis, and revising the manuscript. Xenophon Papademetris: analysis of the fMRI data and revising the man-uscript. Fuyuze Tokoglu: data collection and analysis of the fMRI data. Michiro Negishi: data collection and analysis of the fMRI data. Dustin Scheinost: analysis of the fMRI data and revising the manuscript. Pue Farooque: analysis, interpretation of the icEEG data, and revising the manuscript. Hal Blumenfeld: subject selection, data collection, inter-pretation of the icEEG data, and revising the manuscript. Dennis D. Spencer: data collection, analysis of the icEEG data, and revising the manuscript. R. Todd Constable: study design, interpretation of the fMRI data, and revising the manuscript.
STUDY FUNDING
Dr. Lee is funded by the Basic Science Research Program through the National Research Foundation (NRF) of Korea by the Ministry of Science, ICT, and future planning (NRF-2011-0015788 and 2014-R1A2A1A11052103), and by the Ewha Global Top 5 Grant 2011 of Ewha Womans University of Korea. Dr. Blumenfeld is funded by the NIH grant NS055829. Dr. Constable is funded by the NIH grant EB009666-02.
DISCLOSURE
The authors report no disclosures relevant to the manuscript. Go to Neurology.org for full disclosures.
Received May 31, 2013. Accepted in final form September 11, 2014. REFERENCES
1. Kramer MA, Cash SS. Epilepsy as a disorder of cortical network organization. Neuroscientist 2012;18:360–372. 2. Lemieux L, Daunizeau J, Walker MC. Concepts of
con-nectivity and human epileptic activity. Front Syst Neurosci 2011;5:1–13.
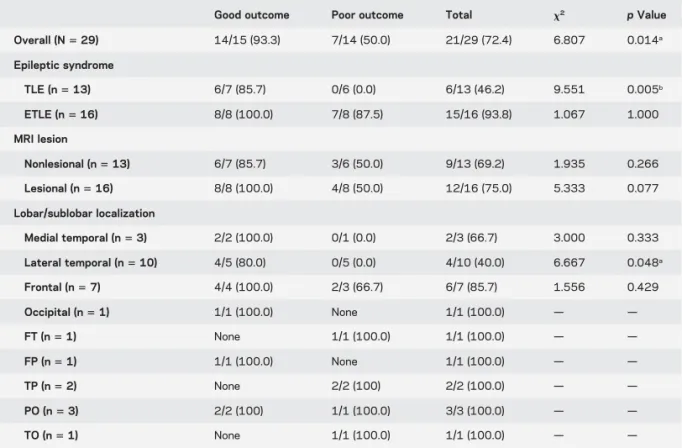
Table 2 Concordance rates between intracranial EEG seizure onset and fMRI-ICC maps in different clinical conditions according to postsurgical seizure outcome
Good outcome Poor outcome Total x2 p Value
Overall (N5 29) 14/15 (93.3) 7/14 (50.0) 21/29 (72.4) 6.807 0.014a Epileptic syndrome TLE (n5 13) 6/7 (85.7) 0/6 (0.0) 6/13 (46.2) 9.551 0.005b ETLE (n5 16) 8/8 (100.0) 7/8 (87.5) 15/16 (93.8) 1.067 1.000 MRI lesion Nonlesional (n5 13) 6/7 (85.7) 3/6 (50.0) 9/13 (69.2) 1.935 0.266 Lesional (n5 16) 8/8 (100.0) 4/8 (50.0) 12/16 (75.0) 5.333 0.077 Lobar/sublobar localization Medial temporal (n5 3) 2/2 (100.0) 0/1 (0.0) 2/3 (66.7) 3.000 0.333 Lateral temporal (n5 10) 4/5 (80.0) 0/5 (0.0) 4/10 (40.0) 6.667 0.048a Frontal (n5 7) 4/4 (100.0) 2/3 (66.7) 6/7 (85.7) 1.556 0.429 Occipital (n5 1) 1/1 (100.0) None 1/1 (100.0) — — FT (n5 1) None 1/1 (100.0) 1/1 (100.0) — — FP (n5 1) 1/1 (100.0) None 1/1 (100.0) — — TP (n5 2) None 2/2 (100) 2/2 (100.0) — — PO (n5 3) 2/2 (100) 1/1 (100.0) 3/3 (100.0) — — TO (n5 1) None 1/1 (100.0) 1/1 (100.0) — —
Abbreviations: ETLE5 extratemporal lobe epilepsy; FP 5 frontoparietal; FT 5 frontotemporal; ICC 5 intrinsic connectivity contrast; PO5 parietooccipital; TLE 5 temporal lobe epilepsy; TO 5 temporooccipital; TP 5 temporoparietal.
Data are n (%).
3. Bettus G, Ranjeva JP, Wendling F, et al. Interictal func-tional connectivity of human epileptic networks assessed by intracerebral EEG and BOLD signal fluctuations. PLoS One 2011;6:e20071.
4. Negishi M, Martuzzi R, Novotny EJ, Spencer DD, Constable RT. Functional MRI connectivity as a predictor of the surgical outcome of epilepsy. Epilepsia 2011;52: 1733–1740.
5. Wilke C, Worrell GA, He B. Analysis of epileptogenic network properties during ictal activity. Conf Proc IEEE Eng Med Biol Soc 2009;2009:2220–2223.
6. Zhang X, Tokoglu F, Negishi M, et al. Social network theory applied to resting-state fMRI connectivity data in the identification of epilepsy networks with iterative fea-ture selection. J Neurosci Methods 2011;199:129–139. 7. Constable RT, Scheinost D, Finn ES, et al. Potential
use and challenges of functional connectivity mapping in intractable epilepsy. Front Neurol 2013;4:39. doi: 10.3389/fneur.2013.00039.
8. Bettus G, Guedj E, Joyeux F, et al. Decreased basal fMRI functional connectivity in epileptogenic networks and con-tralateral compensatory mechanisms. Hum Brain Mapp 2009;30:1580–1591.
9. Bettus G, Bartolomei F, Confort-Gouny S, et al. Role of resting state functional connectivity MRI in presurgical investigation of mesial temporal lobe epilepsy. J Neurol Neurosurg Psychiatry 2010;81:1147–1154.
10. Frings L, Schulze-Bonhage A, Spreer J, Wagner K. Reduced interhemispheric hippocampal BOLD signal coupling related to early epilepsy onset. Seizure 2009;18:153–157. 11. Liao W, Zhang Z, Pan Z, et al. Altered functional
con-nectivity and small-world in mesial temporal lobe epilepsy. PLoS One 2010;5:e8525.
12. Morgan VL, Gore JC, Abou-Khalil B. Cluster analysis detection of functional MRI activity in temporal lobe epi-lepsy. Epilepsy Res 2007;76:22–33.
13. Morgan VL, Gore JC, Abou-Khalil B. Functional epileptic network in left mesial temporal lobe epilepsy detected using resting fMRI. Epilepsy Res 2010;88:168–178. 14. Pereira FR, Alessio A, Sercheli MS, et al. Asymmetrical
hippocampal connectivity in mesial temporal lobe epi-lepsy: evidence from resting state fMRI. BMC Neurosci 2010;11:66.
15. Zhang Z, Lu G, Zhong Y, et al. Impaired perceptual net-works in temporal lobe epilepsy revealed by resting fMRI. J Neurol 2009;256:1705–1713.
16. Zhang Z, Lu G, Zhong Y, et al. fMRI study of mesial tem-poral lobe epilepsy using amplitude of low-frequency fluctu-ation analysis. Hum Brain Mapp 2010;31:1851–1861. 17. Stufflebeam SM, Liu H, Sepulcre J, Tanaka N,
Buckner RL, Madsen JR. Localization of focal epileptic discharges using functional connectivity magnetic reso-nance imaging. J Neurosurg 2011;114:1693–1697. 18. Martuzzi R, Ramani R, Qiu M, Shen X, Papademetris X,
Constable RT. A whole-brain voxel based measure of intrinsic connectivity contrast reveals local changes in tis-sue connectivity with anesthetic without a priori assump-tions on thresholds or regions of interest. Neuroimage 2011;58:1044–1050.
19. Joshi A, Scheinost D, Okuda H, et al. Unified framework for development, deployment and robust testing of neuro-imaging algorithms. Neuroinformatics 2011;9:69–84.
20. Papademetris X, Jackowski AP, Schultz RT, Staib LH, Duncan JS. Integrated intensity, point-feature nonrigid registration. Med Image Comput Comput Assist Interv 2001;3216:763–770.
21. Lancaster JL, Woldorff MG, Parsons LM, et al. Auto-mated Talairach atlas labels for functional brain mapping. Hum Brain Mapp 2000;10:120–131.
22. Lacadie CM, Fulbright RK, Rajeevan N, Constable RT, Papademetris X. More accurate Talairach coordinates for neuroimaging using non-linear registration. Neuroimage 2008;42:717–725.
23. Meltzer JA, Zaveri HP, Goncharova II, et al. Effects of working memory load on oscillatory power in human intracranial EEG. Cereb Cortex 2008;18:1843–1855. 24. Engel J Jr, van Ness PC, Rasmussen TB, Ojemann LM.
Outcome with respect to epileptic seizures. In: Engel J Jr, editor. Surgical Treatment of the Epilepsies, 2nd ed. New York: Raven Press; 1993:609–622.
25. Wieser HG, Blume WT, Fish D, et al. ILAE Commission Report: proposal for a new classification of outcome with respect to epileptic seizures following epilepsy surgery. Epilepsia 2001;42:282–286.
26. Landis JR, Koch GG. The measurement of observer agree-ment for categorical data. Biometrics 1977;33:159–174. 27. Bouilleret V, Dupont S, Spelle L, Baulac M, Samson Y,
Semah F. Insular cortex involvement in mesiotemporal lobe epilepsy: a positron emission tomography study. Ann Neurol 2002;51:202–208.
28. Chassoux F, Semah F, Bouilleret V, et al. Metabolic changes and electro-clinical patterns in mesio-temporal lobe epilepsy: a correlative study. Brain 2004;127:164–174.
29. Koepp MJ, Woermann FG. Imaging structure and func-tion in refractory focal epilepsy. Lancet Neurol 2005;4: 42–53.
30. Otte WM, Dijkhuizen RM, van Meer MP, et al. Charac-terization of functional and structural integrity in experi-mental focal epilepsy: reduced network efficiency coincides with white matter changes. PLoS One 2012;7:e39078. 31. Holmes M, Folley BS, Sonmezturk HH, et al. Resting
state functional connectivity of the hippocampus associ-ated with neurocognitive function in left temporal lobe epilepsy. Hum Brain Mapp 2014;35:735–744. 32. Holmes MJ, Yang X, Landman BA, et al. Functional
net-works in temporal-lobe epilepsy: a voxel-wise study of resting-state functional connectivity and gray-matter con-centration. Brain Connect 2013;3:22–30.
33. Dichter MA, Ayala GF. Cellular mechanism of epilepsy: a status report. Science 1987;237:157–164.
34. Kandel ER, Schwartz JH, Jessell TM. Principles of Neural Science, 4th ed. New York: McGraw-Hill; 2000. 35. Bettus G, Wendling F, Guye M, et al. Enhanced EEG
functional connectivity in mesial temporal lobe epilepsy. Epilepsy Res 2008;81:58–68.
36. Shevon CA, Cappell J, Emerson R, et al. Cortical abnor-malities in epilepsy revealed by local EEG synchrony. Neuroimage 2007;35:140–148.
37. Schindler K, Leung H, Elger CE, Lehnertz K. Assessing seizure dynamics by analyzing the correlation structure of multichannel intracranial EEG. Brain 2007;130:65–77. 38. Vlooswijk MC, Vaessen MJ, Jansen JF, et al. Loss of
net-work efficiency associated with cognitive decline in chronic epilepsy. Neurology 2011;77:938–944.