Low-Dose Persistent Organic Pollutants Impair Insulin
Secretory Function of Pancreatic
b-Cells: Human and
In Vitro Evidence
Yu-Mi Lee,
1Chae-Myeong Ha,
2,3Se-A Kim,
2,3Themis Thoudam,
2,3Young-Ran Yoon,
3,4Dae-Jung Kim,
5Hyeon-Chang Kim,
6Hyo-Bang Moon,
7Sungmi Park,
8In-Kyu Lee,
3,8,9and Duk-Hee Lee
1,3Diabetes 2017;66:2669–2680 | https://doi.org/10.2337/db17-0188
Low-dose persistent organic pollutants (POPs), especially organochlorine pesticides (OCPs) and polychlorinated biphenyls (PCBs), have emerged as a new risk factor for type 2 diabetes. We evaluated whether chronic exposure to low-dose POPs affects insulin secretory function of b-cells in humans and in vitro cells. Serum concentrations of OCPs and PCBs were measured in 200 adults without diabetes. Mathematical model–based insulin secretion in-dices were estimated by using a 2-h seven-sample oral glucose tolerance test. Insulin secretion by INS-1Eb-cells was measured after 48 h of treatment with three OCPs or one PCB mixture. Static second-phase insulin secretion significantly decreased with increasing serum concentra-tions of OCPs. Adjusted means were 63.2, 39.3, 44.1, 39.3, 39.7, and 22.3 across six categories of a summary measure of OCPs (Ptrend= 0.02). Dynamicfirst-phase
in-sulin secretion remarkably decreased with increasing concentrations of OCPs among only insulin-sensitive individuals (Ptrend= 0.02); the insulin levels among
indi-viduals with high OCPs were∼30% of those with low OCPs. Compared with OCPs, PCBs showed weaker as-sociations. The decreased insulin secretion by INS-1E b-cells was observed for even 1 pmol/L OCP. The data from human and in vitro cell experiments suggest that
chronic exposure to low-dose POPs, especially OCPs, can induce pancreaticb-cell dysfunction.
Chronic exposure to low-dose chlorinated persistent organic pollutants (POPs), especially organochlorine pesticides (OCPs) and polychlorinated biphenyls (PCBs), has been linked to the risk of type 2 diabetes (T2D) (1). POPs include several hun-dred highly lipophilic chemicals that bioaccumulate mainly in adipose tissue and are resistant to biodegradation (1). Although most chlorinated POPs were banned several de-cades ago in many countries, the modern general population is exposed to these chemicals through POP-contaminated foods, such as fatty animal foods, seafood, dairy products, and breast milk (1). Besides, these chemicals stored in ad-ipose tissue are an important internal exposure source (1). The release of these chemicals from adipose tissue is mech-anistically linked to adiposity, a traditional risk factor of T2D (1,2).
Both insulin resistance (IR) and b-cell dysfunction are important for the development of T2D, but many people exhibit predominantly either IR or b-cell dysfunction (3). Moreover, the role of obesity, the most important known
1Department of Preventive Medicine, School of Medicine, Kyungpook National
University, Daegu, Republic of Korea
2Department of Biomedical Science, Graduate School, Kyungpook National
Uni-versity, Daegu, Republic of Korea
3BK21 Plus KNU Biomedical Convergence Program, Department of Biomedical
Science, Kyungpook National University, Daegu, Republic of Korea
4Department of Biomedical Science, School of Medicine, Kyungpook National
University and Hospital, Daegu, Republic of Korea
5Department of Endocrinology and Metabolism, Ajou University School of
Med-icine, Suwon, Republic of Korea
6Department of Preventive Medicine, Yonsei University College of Medicine,
Seoul, Republic of Korea
7Department of Environmental Marine Sciences, College of Science and
Tech-nology, Hanyang University, Ansan, Republic of Korea
8Leading-edge Research Center for Drug Discovery and Development for Diabetes
and Metabolic Disease, Kyungpook National University, Daegu, Republic of Korea
9Department of Internal Medicine, School of Medicine, Kyungpook National
Univer-sity, Daegu, Republic of Korea
Corresponding authors: Duk-Hee Lee, [email protected], and In-Kyu Lee, leei@ knu.ac.kr.
Received 13 February 2017 and accepted 13 July 2017. This article contains Supplementary Data online at http://diabetes .diabetesjournals.org/lookup/suppl/doi:10.2337/db17-0188/-/DC1. Y.-M.L. and C.-M.H. contributed equally to this work.
This article is featured in a podcast available at http://www.diabetesjournals.org/ content/diabetes-core-update-podcasts.
© 2017 by the American Diabetes Association. Readers may use this article as
long as the work is properly cited, the use is educational and not for profit, and the
work is not altered. More information is available at http://www.diabetesjournals .org/content/license.
risk factor of T2D, seems to differ depending on the types of T2D preceded predominantly by IR versusb-cell dysfunc-tion (4). Although overweight and obesity are the most important risk factors of IR-dominant T2D, the role of ad-iposity is weak in T2D preceded predominantly by b-cell dysfunction (4). At present, genetic predisposition is con-sidered a key determinant ofb-cell function (5).
Although epidemiological and experimental studies have revealed the relationship of POPs with IR (6,7), some hu-man studies have suggested that direct toxicity of POPs to b-cells (rather than to decreased peripheral insulin sensitiv-ity) may be a more plausible mechanism linking POPs and T2D (8–10). For example, serum concentrations of POPs were related to the markers of b-cell dysfunction (e.g., HOMA-b and 2-h insulin after oral glucose tolerance test [OGTT]), not IR markers among Greenland Inuit without diabetes (9). In addition, serum concentrations of PCBs were related to low levels of fasting insulin or HOMA-b, not IR, among children (8,10). On the other hand, in one study that used an intravenous glucose tolerance test, p,p9-dichlorodiphenyltrichloroethane (DDT), not other POPs, was associated with both HOMA-IR andfirst-phase insulin secretion after adjustment for peripheral insulin sensitivity (11). Because decreased insulin secretion as a result of pan-creaticb-cell dysfunction is crucial for the development of overt T2D (12), careful evaluation of the association be-tween POPs and insulin secretion is important to under-stand the role of POPs in the pathogenesis of T2D.
Although hyperglycemic-euglycemic insulin clamp tech-niques are widely considered gold standard methods for assessing insulin secretion and IR in vivo (13), these ap-proaches are difficult to apply practically to epidemiological studies. Several surrogate measures are derived from OGTTs or fasting insulin and glucose, but all these methods have limitations, and correlations among the indices are modest (14).
We assessed mathematical model–based insulin secre-tion (dynamicfirst- and static second-phase of b-cell func-tion) and insulin sensitivity among participants without diabetes by using a 2-h seven-sample OGTT, a reduced version of a 5-h 11-sample full oral minimal model assess-ment that was validated against clamp methods (15,16), and evaluated the relationship with serum concentra-tions of OCPs or PCBs. In addition, we determined whether the findings in humans were reproduced in in vitro cell experiments.
RESEARCH DESIGN AND METHODS
Study Participants
Two hundred patients were recruited at the Routine Health Checkup Center of Kyungpook National University Hospi-tal, Daegu, Korea, from October 2013 to December 2015. Among patients age.30 years, those with at least one of the following criteria were excluded: 1) any history of diabetes, myocardial infarction, stroke, or heart failure;2) diagnosis of cancer within previous 5 years; 3) current participation in any clinical drug trial; or4) pregnancy.
We obtained written informed consent from each partici-pant. The study’s protocol was reviewed and approved by the Institutional Review Board of Kyungpook National Uni-versity Hospital (IRB No. KNUH 2013-12-016).
Measurements
Detailed information on general characteristics and health-related behaviors is provided in the Supplementary Data. Before venous blood sampling, all the participants fasted overnight for at least 8 h. Approximately 5 mL of serum was drawn from each participant, and the samples were kept in a freezer at270°C until analysis. Total cholesterol and triglyceride levels were measured by an enzymatic method by using an ADVIA 1800 autoanalyzer (Siemens Medical Solutions, Malvern, PA). Glucose was measured by a colorimetric method on the same analyzer. Insulin and C-peptide were quantified by a radioimmunoassay method (SR-300; STRATEC, Birkenfeld, Germany). Intra-and interassay coefficients of variation were 0.5 and 0.8 for glucose, 1.8 and 6.3 for insulin, and 2.7 and 4.0 for C-peptide, respectively.
Two-Hour Seven-Sample OGTT
For the minimal model assessment of pancreatic b-cell responsivity, we used a 2-h OGTT protocol that consisted of seven venous blood samplings at 0, 10, 20, 30, 60, 90, and 120 min after ingestion of 75 g of glucose at time 0 (15). Plasma glucose, insulin, and C-peptide levels were measured for each sample.
Indices of Insulin Sensitivity and Insulin Secretion of Pancreaticb-Cells
Indices of insulin sensitivity and insulin secretion were obtained from seven samples of glucose, insulin, and C-peptide concentrations measured during the OGTT protocol by using the minimal model (17–19) and were calculated by means of SAAM II (Simulation Analysis and Modeling) version 2.1 software (https://tegvirginia.com/ solutions/saam-ii) and the individual estimates from the 2-h seven-sample OGTT. The insulin sensitivity index is the ability of insulin to stimulate glucose disposal and in-hibit glucose production (20). Insulin secretion indices con-sist of two components: dynamic phase secretion (Fd) and
static phase secretion (Fs) (15);Fd is the amount of
dy-namic first-phase secretion of insulin per unit increase of glucose, which is used to assess the appropriateness of in-sulin secretion in response to a change in glucose; Fs is
over-basal average static second-phase secretion of insulin per unit over-basal average glucose, which is used to assess the appropriateness of insulin secretion for a given glucose level (20). The disposition index (DI) is a product of the insulin sensitivity index (SI) and b-cell insulin secretion.
Thus, dynamic phase DI (DId) =Fd3 SI, and static phase
DI (DIs) =Fs3 SI(20).
In addition, we calculated conventional estimators HOMA-IR and HOMA-b to assess insulin sensitivity and insulin release in most epidemiological studies. The equations are as follows: HOMA-IR = (fasting insulin [mIU/mL] 3 fasting
plasma glucose [mmol/L])/22.5 and HOMA-b = (20 3 fasting plasma insulin [mIU/mL])/(fasting plasma glucose [mmol/L]2 3.5) (21).
Measurement of POPs in Serum
Serum concentrations of POPs, including PCBs and OCPs, were analyzed in the laboratory of Hanyang University (Ansan, Korea) by using high-resolution gas chromatogra-phy with high-resolution mass spectrometry (AutoSpec Premier; Waters, Milford, MA). POP concentrations in serum were reported as the wet weight in picograms per milliliter. The limit of detection (LOD) was defined as the concentration that generated a signal equal to three times the baseline noise. In the analysis, POP concentrations below the LOD were replaced with LOD / 3. Thirty-seven POPs (18 OCPs, 19 PCBs) were quantified, but we evaluated 4 OCPs and 6 PCBs for which at least 70% of the participants had concentrations above the LOD:p,p9-DDT; p,p9-dichlor-odiphenyldichloroethylene (DDE);b-hexachlorocyclohexane (HCH); trans-nonachlor; PCB118; PCB138; PCB153; PCB170; PCB180; and PCB187. We tried both wet-weight concentrations with lipid adjustment (including serum concentrations of triglycerides and total cholesterol as covariates) and lipid-standardized concentrations (by divid-ing wet-weight concentrations by total lipids [total lipids (mg/dL) = 2.273 total cholesterol + triglycerides + 62.3]) (22). Because they showed similar associations, we present the results of wet-weight concentrations.
Supplementary Table 1 shows the detection rate and distribution of POP concentrations. For a direct comparison of results with the in vitro cell study, we present concentra-tions of POPs in molar units (nmol/L) in cases ofb-HCH, p,p9-DDT, trans-nonachlor, and the mixture of PCBs.
In Vitro Experiments
Insulin secretion and insulin content were analyzed to assess the chronic effects of three low-dose OCPs (p,p9-DDT; b-HCH; and trans-nonachlor) and Aroclor 1254 (PCB mixture) on INS-1Eb-cells. For insulin assays, 3.0 3 105 INS-1E cells per well were seeded in 24-well plates with complete RPMI medium and grown for 48 h. The cells were preincubated in the RPMI medium containing 0.5% of FBS for 1 h followed by incubation with various concentrations of each compound (10212–1026mol/L) for 48 h. The OCPs and PCB mixture were dissolved and stored in absolute methanol. Thefinal concentration of methanol in the media was 0.1% volume for volume, including the control. Measure-ment of glucose-stimulated insulin secretion was performed as previously described (23,24) with some modifications. Detailed information on in vitro experiments is provided in the Supplementary Data.
Statistical Analysis
Serum concentrations of individual POPs were catego-rized into quartiles, and the last quartile was further categorized with the cutoff points of 90th and 95th percentile levels because the range of the last quartile was too wide, and insulin secretion clearly decreased
with increasing concentrations of POPs, even within the 4th quartile (Q4). In addition, we determined the summary measures of OCPs and PCBs by summing the ranks of the individual congeners of four OCPs (p,p9-DDT; p,p9-DDE; b-HCH; and trans-nonachlor) and six PCBs (PCB118, PCB138, PCB153, PCB170, PCB180, and PCB187), respec-tively. The summary measures were also categorized into groups by cutoff points at the 25th, 50th, 75th, 90th, and 95th percentile levels. Distributions of each compound according to the categories of the summary measures of OCPs and PCBs are presented in Supplementary Table 2. In fact, human studies on POPs should be interpreted by primarily focusing on the summary measures of POPs rather than on individual compounds because the serum concentrations of individual compounds highly correlate in the general population (correlation coefficients among four OCPs and six PCBs in this study: 0.35–0.87 and 0.76–0.98, respectively). In this situation, interpretation that focuses on individual compounds may be misleading. Among sev-eral methods for estimation of the summary measures of POPs (1), we used the summary measure that sums the rank orders of individual compounds belonging to each sub-class; this approach enables equal contributions from all constituent compounds. Absolute concentration–based summary measures seem to be intuitively reasonable, but their results are similar to those of a couple of individual compounds with much higher absolute concentrations com-pared with the other compounds. The advantage of a rank-based summary measure of POPs over other methods is discussed in detail elsewhere (1).
Insulin secretion and sensitivity indices were log-transformed, controlling for the skewed distribution. Ad-justed geometric means of insulin secretion and sensitivity indices according to POP concentrations were estimated by using the generalized linear model. The covariates were age (continuous, years), sex (male/female), BMI (continu-ous, kg/m2), cigarette smoking (continuous, pack-years), alcohol consumption (continuous, g/week), physical activity (continuous, MET-min/week), total cholesterol (continuous, mg/dL), and triglycerides (continuous, mg/dL). When the in-dices of insulin secretion were an outcome variable, insulin sensitivity was also considered as a covariate or an effect modifier because insulin secretion from pancreatic b-cells is directly affected by insulin sensitivity. Correlation coeffi-cients of covariates with insulin sensitivity/insulin secretion indices are provided in Supplementary Table 3. All data were analyzed with SAS 9.4 software (SAS Institute, Cary, NC). RESULTS
Human Study
Table 1 shows general characteristics of the study par-ticipants. Among the 200 participants, 36% were male. The mean age was 55.1 years, and the mean BMI was 24.6 kg/m2. Current smokers and current drinkers con-stituted 11.5% and 49.5% of the cohort, respectively. Correlation coefficients of BMI and health behaviors with the summary measures of OCPs and PCBs are shown in
Supplementary Table 4. BMI showed a weak positive corre-lation with the summary measure of OCPs but not with the summary measure of PCBs.
Markers of insulin sensitivity and secretion estimated on the basis of 2-h seven-sample OGTT were only weakly associated with HOMA-IR and HOMA-b, which were estimated on the basis of fasting glucose and insulin (Sup-plementary Table 5). Correlation coefficients between static and dynamic insulin secretion estimated by means of 2-h seven-sample OGTT with HOMA-b were 0.26 and 0.30, respectively.
Table 2 shows the association between summary mea-sures of OCPs or PCBs and markers of insulin secretion and sensitivity indices among all the participants. Results on individual compounds belonging to OCPs and PCBs are presented in Supplementary Tables 6 and 7. In crude mod-els, insulin sensitivity decreased as the summary measure of OCPs or PCBs increased (Ptrend, 0.01 for OCPs and 0.01
for PCBs). Among the markers of insulin secretion,Fs
significantly decreased as the summary measure of OCPs or PCBs increased (Ptrend, 0.01 for OCPs and 0.03 for
PCBs), whereas Fd was not statistically significant
de-spite a decreasing tendency with increasing dose of OCPs or PCBs.
After adjustment for age, sex, BMI, cigarette smoking, alcohol consumption, physical activity, total cholesterol, and triglycerides (model 2), only the inverse relation between OCPs andFs remained significant; adjusted
geo-metric means ofFswere 63.4, 38.4, 44.2, 39.4, 40.1, and
22.7 across six categories of summary measures of OCPs (,25%, 25 to ,50%, 50 to ,75%, 75 to ,90%, 90 to,95%, $95%; Ptrend= 0.03). When insulin sensitivity
was further adjusted (model 3), the relation remained un-changed. OCPs also showed a decreasing tendency with static DI, with a marginal statistical significance (Ptrend =
0.06). On the other hand, when HOMA-IR and HOMA-b were used as markers of insulin sensitivity and insulin se-cretion, the summary measure of PCBs was inversely asso-ciated with HOMA-b (Ptrend = 0.02 in model 3), whereas
OCPs were not related to either.
Evaluation of the association of OCPs or PCBs with glucose during fasting and at 2 h showed that glucose levels at 2 h gradually increased with increasing serum concen-trations of OCPs and PCBs, whereas the increase in fasting glucose was prominent in the highest 5th percentile group of OCPs or PCBs (Supplementary Table 8). We repeated all these analyses after excluding those with concentrations below the LOD as a sensitivity analysis, and the results were very similar to those among all participants (Sup-plementary Table 9).
We next assessed the associations of POPs with insulin secretion by the levels of IR (Fig. 1) and found a statistically significant interaction between the summary measure of OCPs and HOMA-IR onFd(Pinteraction= 0.01). Among
par-ticipants with HOMA-IR ,1.95 (median value; relatively insulin-sensitive individuals), a strong inverse association was observed between OCPs and Fd (Ptrend = 0.02); the
adjusted mean of insulin secretion among participants in Q4 of OCPs was ,30% of that in the Q1 of OCPs. In contrast, no association was found between OCPs and Fd among participants with HOMA-IR $1.95 (relatively
insulin-resistant individuals). Similarly, theFsalso showed
a tendency for a stronger inverse association with OCPs among relatively insulin-sensitive individuals compared with relatively insulin-resistant individuals, although theP value for the interaction was not statistically significant (Fig. 1).
Results for PCBs were generally weaker than those for OCPs (Fig. 2). PCBs showed a clearer pattern of interaction with HOMA-b (Pinteraction= 0.09) than with markers of
in-sulin secretion on the basis of the 2-h seven-sample OGTT
(Pinteraction= 0.69 forFs and 0.12 forFd). As in the OCP
findings, the decreasing trend of insulin secretion was clearer among relatively insulin-sensitive individuals than among relatively insulin-resistant individuals.
When we tried tertiles of HOMA-IR in sensitivity analyses and participants were restricted to the relatively insulin-sensitive individuals, the patterns became more prominent (Supplementary Figs. 1 and 2). Of note, PCBs also showed a marginally significant interaction with
Fd(Pinteraction= 0.07). On the other hand, when the marker
of insulin sensitivity, which was estimated by the 2-h seven-sample OGTT, was used instead of HOMA-IR, the interactions were not observed. The results of individual compounds belonging to OCPs and PCBs are presented in Supplementary Tables 10 and 11.
When we evaluated the associations of obesity indices (BMI, waist circumference, and percent body fat) with insulin secretion and sensitivity indices without consid-eration of POPs, only insulin sensitivity clearly decreased with increasing obesity (Table 3). NeitherFsnorFdwas
associated with obesity indices.
Table 1—General characteristics of study participants
Characteristic Value Age (years) 55.16 12.1 (30–71) Sex Male 72 (36.0) Female 128 (64.0) BMI (kg/m2) 24.66 3.3 (17.0–37.4) ,25 117 (58.5) $25 to ,30 71 (35.5) $30 12 (6.0) Cigarette smoking (pack-years) 6.76 13.6 (0–60) Alcohol consumption (g/week) 79.06 223.9 (0–2,580) Physical activity (MET-min/week) 2,749.26 3,796.3 (0–24,318.0) Total cholesterol (mg/mL) 185.76 32.4 (114.0–313.0) Triglycerides (mg/mL) 128.26 78.4 (34.0–536.0)
Table 2— Geome tric m e a ns of insul in s ensi ti vi ty and s ecret ion indi cat or s a ccordi ng to categor ies o f s ummar y measur es of OCPs and P CB s Su mma ry me asu re o f O CPs o r P CBs Q1 (, 25 %) Q2 (2 5 to , 50 %) Q3 (50 to , 75% ) Q4 -1 (7 5 to , 90 %) Q4 -2 (90 to , 95% ) Q4 -3 ($ 95 % ) Ptr e n d ∑ OCPs * 7 5– 23 4 2 37 –3 9 9 401 –561 56 4– 683 686 –72 0 7 2 2– 78 0 n =4 9 n =5 1 n =5 1 n =2 9 n =1 0 n =1 0 ∑ PCBs † 38 –31 8 3 23 –5 8 9 593 –872 8 7 8– 1,0 5 4 1 ,061 –1,125 1 ,12 6– 1, 19 9 n =5 0 n =4 9 n =5 1 n =3 0 n =1 0 n =1 0 SI (10 2 4 dL/kg/min p er m U/mL) ∑ OCPs Mo de l 1 12.60 6 1.85 8.47 6 1.22 7 .1 1 6 1.0 2 6.68 6 1.28 4.5 5 6 1.48 5.44 6 1.77 , 0. 01 Mo de l 2 10.06 6 2.00 8.07 6 1.11 7 .4 5 6 1.1 0 6.99 6 1.40 6.1 2 6 2.03 7.05 6 2.31 0.33 ∑ PCBs Mo de l 1 12.10 6 1.77 8.75 6 1.29 6 .3 6 6 0.9 2 6.15 6 1.16 8.3 3 6 2.72 6.98 6 2.28 0.01 M o d e l 2 9. 21 6 1.5 8 8.57 6 1.20 6 .6 4 6 0.9 1 7.20 6 1.39 11.00 6 3.39 7.84 6 2.49 0.76 Fs (1 0 2 9 /m in) ∑ OCPs Mo de l 1 63.45 6 6.97 3 9 .8 1 6 4.29 44.61 6 4.80 3 9 .24 6 5.60 4 4 .3 5 6 10.79 2 3 .36 6 5.68 , 0. 01 Mo de l 2 63 .4 3 6 10.20 3 8 .4 2 6 4.27 44.16 6 5.30 3 9 .42 6 6.39 4 0 .1 1 6 10.79 2 2 .71 6 6.02 0.03 Mo de l 3 63 .1 5 6 10.00 3 9 .2 5 6 4.31 44.12 6 5.22 3 9 .31 6 6.28 3 9 .6 7 6 10.52 2 2 .31 6 5.83 0.02 ∑ PCBs Mo de l 1 53.91 6 6.06 4 7 .1 1 6 5.35 41.29 6 4.60 4 0 .58 6 5.89 36.70 6 9.23 3 5 .81 6 9.01 0.03 Mo de l 2 47.01 6 6.79 4 3 .0 1 6 5.08 43.50 6 5.02 4 4 .03 6 7.15 3 9 .1 4 6 10.14 39.58 6 10 .58 0 .60 Mo de l 3 46.76 6 6.65 4 3 .8 0 6 5.10 44.11 6 5.01 4 3 .82 6 7.00 37.46 6 9.58 38.75 6 10 .21 0 .51 Fd (10 2 9) ∑ OCPs Mo de l 1 484.88 6 92 .6 4 5 0 9 .3 2 6 95.39 380.51 6 71 .2 6 408.65 6 10 1.49 46 0.7 4 6 194.87 3 93.50 6 16 6.4 3 0.42 Mo de l 2 547 .4 7 6 155.58 48 5.1 5 6 95.29 356.73 6 75 .7 1 380.93 6 10 9.12 33 8.5 1 6 160.99 3 42.72 6 16 0.4 4 0.38 Mo de l 3 545 .7 1 6 155.05 49 2.7 6 6 97.05 356.50 6 75 .6 4 380.19 6 10 8.89 33 5.8 0 6 159.69 3 38.33 6 15 8.4 1 0.36 ∑ PCBs Mo de l 1 549 .8 4 6 103.58 46 5.0 1 6 88.49 368.79 6 68 .7 9 4 0 3 .21 6 98.06 55 9.8 3 6 235.82 3 38.46 6 14 2.5 7 0.25 Mo de l 2 655 .8 4 6 160.90 42 7.4 5 6 85.77 367.85 6 72 .1 0 3 2 9 .79 6 90.98 48 2.1 1 6 212.39 2 69.08 6 12 2.2 7 0.17 Mo de l 3 653 .6 4 6 160.44 43 2.2 4 6 86.92 371.02 6 72 .8 3 3 2 8 .80 6 90.75 46 9.2 7 6 207.26 2 65.57 6 12 0.7 8 0.15 DI s (10 2 13 dL/kg/min 2 per m U/mL) ∑ OCPs Mo de l 1 669 .2 6 6 159.22 26 0.9 4 6 60.85 230.01 6 53 .6 4 1 8 4 .58 6 57.08 136.88 6 72 .0 8 85.42 6 44 .98 , 0. 01 Mo de l 2 521 .8 3 6 172.10 23 9.2 0 6 54.53 238.96 6 58 .8 6 1 9 3 .60 6 64.36 171.12 6 94 .4 4 1 1 0 .62 6 60.10 0.06 ∑ PCBs Mo de l 1 542 .0 1 6 130.37 32 1.2 1 6 78.05 181.92 6 43 .3 3 1 7 9 .72 6 55.81 22 8.1 1 6 122.69 17 9.46 6 96.52 , 0.01 Mo de l 2 337.86 6 97 .9 4 2 8 5 .6 0 6 67.71 202.41 6 46 .8 8 2 3 8 .87 6 77.87 33 8.5 1 6 176.21 2 33.89 6 12 5.5 8 0.61 Continu ed o n p . 2674
Table 2— Co nti nued Su mma ry me asu re o f O CPs o r P CBs Q1 (, 25 %) Q2 (2 5 to , 50 %) Q3 (50 to , 75% ) Q4 -1 (7 5 to , 90 %) Q4 -2 (90 to , 95% ) Q4 -3 ($ 95 % ) Ptr e n d DI d (10 2 13 dL/k g/min p er m U/mL) ∑ OCPs Mo de l 1 5,151 .3 9 6 1,4 11.89 3 ,3 94.62 6 911 .9 7 1 ,953 .8 1 6 524.89 1,9 27.51 6 68 6.7 1 1,409 .2 2 6 854.97 1,4 68.69 6 891 .0 6 , 0. 01 Mo de l 2 4,534 .0 8 6 1,8 06.82 3 ,0 67.63 6 844 .9 5 1 ,929 .1 5 6 574.13 1,8 80.66 6 75 5.4 8 1,426 .0 9 6 951.08 1,7 08.55 6 1,121 .6 3 0 .18 ∑ PCBs Mo de l 1 5,596 .0 3 6 1,5 08.06 3 ,2 03.52 6 872 .0 8 1 ,622 .8 6 6 433.03 1,7 74.31 6 61 7.3 0 3,55 5.8 2 6 2,142.72 1,7 13.70 6 1,032 .6 7 0 .01 Mo de l 2 4,770 .4 3 6 1,6 37.20 2 ,8 62.60 6 803 .5 4 1 ,717 .2 3 6 470.83 1,7 77.56 6 68 6.0 0 4,27 6.3 8 6 2,635.38 1,6 14.27 6 1,026 .1 4 0 .24 HOMA-I R ∑ OCPs Mo d e l 1 3. 06 6 0.1 4 2.74 6 0.12 3 .0 2 6 0.1 3 3.40 6 0.20 2.8 3 6 0.28 3.85 6 0.38 0.03 M o d e l 2 3. 19 6 0.1 8 2.77 6 0.11 3 .0 4 6 0.1 3 3.42 6 0.20 2.5 2 6 0.24 3.61 6 0.34 0.19 M o d e l 3 3. 19 6 0.1 8 2.76 6 0.11 3 .0 4 6 0.1 3 3.42 6 0.20 2.5 3 6 0.24 3.62 6 0.34 0.18 ∑ PCBs Mo d e l 1 3. 15 6 0.1 4 2.75 6 0.13 3 .0 5 6 0.1 4 3.16 6 0.18 3.4 5 6 0.35 3.10 6 0.31 0.37 M o d e l 2 3. 26 6 0.1 7 2.72 6 0.11 3 .0 7 6 0.1 3 3.13 6 0.18 3.2 4 6 0.30 3.25 6 0.31 0.39 M o d e l 3 3. 27 6 0.1 7 2.71 6 0.11 3 .0 7 6 0.1 3 3.13 6 0.18 3.2 6 6 0.30 3.26 6 0.31 0.36 HOMA-b ∑ OCPs Mo de l 1 12 8.62 6 8.84 9 9 .4 2 6 6.70 11 2.31 6 7.57 105 .80 6 9. 45 97 .6 3 6 14.86 92.21 6 14 .03 0 .04 Mo de l 2 116.02 6 10 .6 8 9 5.9 0 6 6.10 11 8.45 6 8.15 11 4.93 6 10.67 9 1 .6 6 6 14.13 92.45 6 14 .02 0 .50 Mo de l 3 116.13 6 10 .6 9 9 5.4 3 6 6.09 11 8.47 6 8.15 11 5.00 6 10.67 9 1 .8 9 6 14.16 92.83 6 14 .08 0 .52 ∑ PCBs Mo de l 1 13 0.83 6 8.77 114.72 6 7 .77 10 3.27 6 6.85 9 9 .70 6 8.63 9 4 .4 1 6 14.15 77.09 6 11 .55 , 0. 01 Mo de l 2 127.10 6 10 .2 6 107.57 6 7 .10 10 6.99 6 6.90 101 .27 6 9. 19 89 .2 2 6 12.94 82.87 6 12 .39 0 .02 Mo de l 3 127.22 6 10 .2 8 107.23 6 7 .10 10 6.73 6 6.90 101 .36 6 9. 21 89 .9 1 6 13.08 83.18 6 12 .46 0 .02 Data are m ean 6 SD un less othe rwise indica te d . M odel 1: crude. Mo del 2 : a djusted fo r ag e, sex , BM I, ciga rette smokin g, alcoh o lc o n su mption, p hysical activity, to ta lc hole stero l, a nd triglycerides. M o del 3 : furt h er adjust e d for insulin sensit ivity. *∑ OCPs: ra n k s um o f four OCPs (p, p 9-DDT, p,p 9-D DE, b -HCH, a n d trans -n on a c h lor ). †∑ PCBs: rank s u m of six P CBs (PCB118 , P CB138 , P CB153, PCB170 , P CB180, and P CB18 7).
In Vitro Experiments
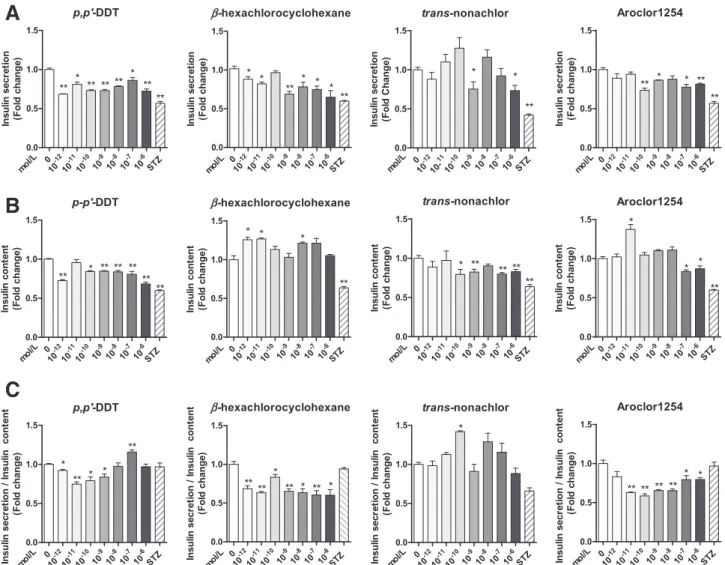
The decreased insulin secretion after stimulation by glucose was observed for 10212mol/Lp,p9-DDT and b-HCH (Fig. 3A). At 1029 mol/L, insulin secretion levels were signi fi-cantly decreased for all OCPs and Aroclor 1254. However, in the range of doses differing by;106-fold (10212–1026 mol/L), no linear dose-response relations were observed, but nonmonotonic dose-response relations with some fluctuations were. Little or no effect of OCPs or Aroclor 1254 on the basal insulin secretion level was found (Supplementary Fig. 3).
Insulin content also significantly decreased in cells treated with p,p9-DDT (10212–1026 mol/L, except 10211 mol/L); trans-nonachlor (10210–1026 mol/L, except 1028 mol/L); and Aroclor 1254 (1027–1026mol/L) (Fig. 3B). In contrast, the insulin content in b-HCH–treated cells significantly increased at low concentrations (10212–10211 mol/L). A very low concentration (10211mol/L) of Aroclor 1254 also yielded an increased concentration of intracellular insulin content. Again, no linear dose-response relations were found.
The ratio of insulin secretion/insulin content revealed different mechanisms of action among different chemical compounds (Fig. 3C). For example, p,p9-DDT showed the most consistent decrease pattern for insulin secretion and intracellular insulin content in INS-1E cells. Bothb-HCH and Aroclor 1254 seemed to primarily decrease insulin se-cretion. In the case of trans-nonachlor, decreased insulin
synthesis seemed to be more pronounced than decreased insulin secretion.
DISCUSSION
On the basis of human and in vitro studies, we demonstrate that chronic exposure to low-dose POPs can induce pan-creatic b-cell dysfunction. POPs were found to be more strongly related to markers of insulin secretion than to IR. Between two common subclasses of POPs, OCPs showed more consistent results compared with PCBs. For example, Fsamong participants in the highest 5th percentile of the
summary measure of OCPs was only one-third of those in the lowest 25th percentile. In contrast to POPs, obesity indices, such as BMI, waist circumference, and percent body fat, were found to be strongly associated only with IR but not with indices of insulin secretion.
Of note, the associations of POPs withFdwere different
depending on the levels of HOMA-IR. The inverse asso-ciations between these chemicals withFdwere observed
among sensitive individuals and not in insulin-resistant individuals. Among insulin-sensitive individuals, the insulin levels among those in Q4 of OCPs were only 20–30% of those in Q1 of these chemicals. However, these strong inverse associations completely disappeared as HOMA-IR increased. TheFsalso showed a similar
interac-tion, but the pattern was weaker than that ofFd. All these
interactions were more pronounced when the analysis was restricted to more insulin-sensitive individuals.
Figure 1—Associations between insulin secretion indicators (A–E) and concentrations of OCPs stratified by the level of HOMA-IR. ∑OCPs: rank
sum of four OCPs (p,p9-DDT; p,p9-DDE; b-HCH; and trans-nonachlor) adjusted for age, sex, BMI, cigarette smoking, alcohol consumption, physical activity, total cholesterol, triglycerides, and insulin sensitivity. For the analyses in which the static and dynamic DIs are dependent
variables, insulin sensitivity was excluded from the preceding covariates.●, insulin-sensitive group (HOMA-IR <1.95); □, insulin-resistant group
As people become insulin resistant, a compensatory oversecretion of insulin occurs as long as the pancreatic b-cells work. Therefore, no association of POPs with Fd among insulin-resistant individuals suggests that the
inverse association between POPs and insulin secretion is masked by the hyperactivation of pancreatic b-cells. This notion indicates that the detrimental effect of chronic ex-posure to low-dose POPs on pancreaticb-cells may be the result of reversible functional impairment (which can be overcome by the compensatory mechanism to activate pan-creatic b-cells) as opposed to the direct cellular toxicity resulting from high-dose chemical exposure that leads to irreversible cell damage.
The possibility of the reversible functional impairment of pancreaticb-cells is also supported by the findings from in vitro experiments. In this study, the treatment of INS-1E b-cells with 1 pmol/L p,p9-DDT for 48 h decreased the in-sulin secretion and intracellular inin-sulin content, but no further decrease was observed with an increase in the dose of p,p9-DDT to 1 mmol/L. Other compounds also demonstrated nonlinearity. Because direct cellular toxicity commonly shows a linear dose-response relation, it may not be a plausible mechanism underlying the decreased insulin secretion or intracellular insulin content resulting from POPs.
Low levels of POPs may indirectly affect the function of INS-1E b-cells, and this pathway can be compensated by an increased dose of POPs through certain biological
mechanisms. The possibility of nonlinearity was sug-gested in our review article summarizing various epide-miological and experimental studies of POPs and T2D (1). Of note, mitochondrial dysfunction, a possible molecu-lar mechanism linking POPs and T2D (1,7,25), can be com-pensated by the induction of cellular protective mechanisms by slightly increased doses of chemicals; this phenomenon is called hormesis (26).
In addition, the current in vitro experiments suggest that different chemical compounds have different molecular mechanisms of action. For example, p,p9-DDT showed the most consistent pattern for decreased insulin secretion and a decrease in intracellular insulin content. Bothb-HCH and Aroclor 1254 seemed to primarily decrease insulin secre-tion. In the case oftrans-nonachlor, decreased insulin syn-thesis seemed to be more important than decreased insulin secretion. Mechanistically, decreased insulin content in the in vitro experiments may be relevant to the decreasedFs,
whereas the decreased insulin secretion may be relevant to Fd. Nonetheless, because humans are exposed to all these
chemical mixtures, bothFdandFscan be affected by POP
mixtures.
The POP-related decrease in insulin secretion may explain the risk of T2D in Asian and elderly people. Compared with people of European descent, Asians with T2D are characterized by early b-cell dysfunction, which develops at a lower BMI (27). At present, genetic predis-position and a greater tendency for visceral adiposity at any
Figure 2—Associations between insulin secretion indicators (A–E) and concentrations of PCBs stratified by the level of HOMA-IR. ∑PCBs:
rank sum of six PCBs (PCB118, PCB138, PCB153, PCB170, PCB180, and PCB187) adjusted for age, sex, BMI, cigarette smoking, alcohol consumption, physical activity, total cholesterol, triglycerides, and insulin sensitivity. For the analyses in which the static and dynamic DIs are
dependent variables, insulin sensitivity was excluded from the preceding covariates.●, sensitive group (HOMA-IR <1.95); □,
Ta b le 3— G e ome tr ic m e a n s o f in s u lin sen s iti v it y a nd se cr et ion in d ic ators a ccordin g to c ategori e s o f obesi ty-r el ated in dices Catego ry of obesit y -related indices Q1 ( , 25 %) Q2 (25 to , 50% ) Q3 (50 to , 75% ) Q4 -1 (7 5 to , 90 %) Q4 -2 (90 to , 95% ) Q4 -3 ( $ 95 % ) P tr e n d BM I (k g /m 2 ) 17.0 – 22.3 2 2 .4– 24 .2 24 .2 – 26 .4 26.4 – 28.2 2 8 .2– 30 .7 30.8 – 37.4 n 5 0 50 50 3 0 10 1 0 S I (10 2 4 dL /k g/ min p er m U/ mL) M o del 1 14.33 6 1.99 9.33 6 1.30 6.9 2 6 0.96 5.62 6 1.01 4.6 1 6 1.43 3.25 6 1.01 , 0. 01 M o del 2 12.14 6 1.72 9.07 6 1.24 6.8 7 6 0.93 6.33 6 1.12 5.4 3 6 1.64 3.32 6 1.00 , 0. 01 F s (10 2 9 /m in) M o del 1 45.08 6 5.09 47 .20 6 5 .3 3 40.81 6 4.61 4 7 .09 6 6.87 6 1 .2 1 6 15.47 3 4 .83 6 8.80 0.85 M o del 2 42.50 6 4.97 44 .64 6 5 .0 4 39.90 6 4.45 5 1 .01 6 7.43 6 2 .2 4 6 15.49 3 4 .37 6 8.52 0.70 M o del 3 42.08 6 4.85 43 .49 6 4 .8 5 40.89 6 4.51 5 1 .97 6 7.46 6 3 .3 7 6 15.53 3 5 .62 6 8.70 0.50 F d (10 2 9 ) M o del 1 349.06 6 65 .7 1 438 .26 6 8 2 .50 487.63 6 91 .7 9 541.09 6 13 1.50 65 0.0 3 6 273.62 380.33 6 16 0.0 9 0.20 M o del 2 350.56 6 70 .7 6 409 .18 6 7 9 .77 466.81 6 89 .9 1 538.08 6 13 5.35 58 8.4 1 6 252.79 386.81 6 16 5.5 3 0.24 M o del 3 348.01 6 70 .2 4 401 .36 6 7 8 .50 475.34 6 91 .8 2 545.51 6 13 7.29 59 6.2 7 6 256.10 397.17 6 17 0.1 1 0.20 Waist c ircu mfere n ce (cm ) 59.5 – 78.0 7 9 .0– 84 .0 85 .0 – 91 .0 91.5 – 97.0 9 7 .5– 99 .5 1 00.0 – 119.0 n 4 7 54 49 3 1 9 1 0 S I (10 2 4 dL /k g/ min p er m U/ mL) M o del 1 16.33 6 2.22 9.22 6 1.17 7.8 5 6 1.04 4.25 6 0.71 4.9 2 6 1.53 2.49 6 0.73 , 0. 01 M o del 2 13.79 6 2.14 9.17 6 1.23 8.1 9 6 1.10 5.00 6 0.87 5.2 7 6 1.64 2.75 6 0.81 , 0. 01 F s (10 2 9 /m in) M o del 1 50.42 6 5.88 45 .83 6 4 .9 9 44.44 6 5.08 4 1 .80 6 6.00 4 2 .9 3 6 11.44 3 1 .59 6 7.99 0.10 M o del 2 41.37 6 5.45 44 .44 6 5 .0 3 44.14 6 5.02 4 8 .13 6 7.12 4 9 .4 1 6 13.07 3 3 .25 6 8.31 0.96 M o del 3 40.88 6 5.30 43 .69 6 4 .8 7 44.80 6 5.02 4 8 .96 6 7.14 5 0 .7 0 6 13.21 3 4 .15 6 8.40 0.86 F d (10 2 9 ) M o del 1 479.02 6 91 .3 0 283 .03 6 50 .3 3 5 45 .9 4 6 101.91 603.64 6 14 1.66 69 1.2 1 6 301.05 339.48 6 14 0.2 7 0.30 M o del 2 420.73 6 92 .4 9 258 .23 6 48 .7 8 5 33 .4 2 6 101.21 596.67 6 14 7.42 78 1.6 6 6 345.12 328.09 6 13 6.8 9 0.19 M o del 3 416.64 6 91 .4 9 254 .67 6 48 .1 1 5 39 .8 5 6 102.38 605.12 6 14 9.40 79 8.2 9 6 352.12 335.30 6 13 9.7 8 0.17 Bo dy fa t (%)* 14.8 – 25.5 2 6 .3– 32 .3 32 .4 – 36 .9 37.3 – 41.7 4 1 .9– 43 .5 44.1 – 51.3 n 4 9 51 46 3 2 10 9 S I (10 2 4 dL /k g/ min p er m U/ mL) M o del 1 12.73 6 1.87 6.73 6 0.97 8.3 5 6 1.27 6.57 6 1.20 7.9 9 6 2.60 4.87 6 1.67 0.01 M o del 2 15.88 6 2.28 7.14 6 0.92 5.8 4 6 0.90 4.45 6 0.81 5.4 7 6 1.67 3.59 6 1.16 , 0. 01 F s (10 2 9 /m in) M o del 1 45.29 6 5.09 37 .82 6 4 .1 6 48.24 6 5.59 4 9 .65 6 6.90 29.72 6 7.39 79.95 6 20 .95 0 .24 M o del 2 50.57 6 6.10 38 .88 6 4 .1 9 41.48 6 5.35 4 4 .78 6 6.83 27.66 6 7.10 74.89 6 20 .33 0 .89 M o del 3 49.05 6 5.86 39 .55 6 4 .2 1 41.32 6 5.25 4 6 .58 6 7.04 28.51 6 7.22 77.70 6 20 .82 0 .67 F d (10 2 9 ) M o del 1 339.36 6 64 .5 7 503 .17 6 9 3 .84 478.05 6 93 .8 7 435.58 6 10 2.55 35 0.1 2 6 147.46 902.97 6 40 0.8 7 0.19 M o del 2 343.37 6 72 .6 4 510 .96 6 9 6 .54 425.44 6 96 .1 2 421.20 6 11 2.67 35 6.7 0 6 160.49 878.76 6 41 8.1 6 0.36 M o del 3 334.90 6 71 .1 3 518 .29 6 9 8 .02 424.03 6 95 .7 1 435.07 6 11 6.87 36 5.7 6 6 164.57 905.87 6 43 1.2 3 0.30 Da ta are m ean 6 SD unless o therw ise indicated. M o d el 1: cru d e. Model 2 : a djusted for age , se x, cigarette smoking, alcohol c onsumption, p hysic a l a ctivit y , total c ho lesterol, a nd triglyc e rides. Model 3 : further adjusted for in s ulin sensit iv ity. *Sam pl e s ize for ana lyses of percen t b ody fat was 197.
given BMI are suspected to contribute to ethnic disparities in T2D (27). However, the levels of many chemicals belong-ing to the POP class in both humans and the environment are higher in many Asian countries than in Western Europe or North America because emission sources of many POPs in the past several decades have shifted from industrialized countries of the northern hemisphere to less-developed countries in tropical and subtropical regions (28). Thus, chronic exposure to POPs and other chemicals may be the key reason whyb-cell dysfunction–dominant T2D is more common among Asians than among Caucasians. Similarly, the role of POPs in the development of T2D may become more important with aging, given that the body’s burden of POPs is higher in elderly people than in younger people because lipophilic chemicals like POPs tend to accumulate with age (29). This observation may explain why insulin secretory defects are more prevalent in T2D for older (30) than for middle-aged adults.
A couple of epidemiological studies suggested that traditional risk factors of T2D, including obesity, have varying relations with incident T2D, depending on preceding degrees of IR or pancreatic b-cell dysfunction before diag-nosis (4,31). In particular, among elderly people, greater adiposity and significant weight gain have been linked to even lower rates of incident T2D preceded predominantly byb-cell dysfunction (4,31). These puzzling results also can be explained by POPs because adipose tissue is a major storage site for POPs and can play a primarily protective role against the effects of POPs on critical organs. For example, when two elders are exposed to the same amounts of POPs from the environment, the one with less adi-posity has an increased chance of POPs reaching pancre-aticb-cells (2).
Although HOMA-b has been widely used in epidemio-logical studies to estimate insulin secretion because of its convenience, it may have a limited value for the evaluation
Figure 3—Effects of OCPs or Aroclor 1254 (PCB mixture) on glucose-stimulated insulin secretion in INS-1E b-cells. Each chemical was
incubated with INS-1E cells at concentrations from 10212to 1026mol/L for 48 h. Streptozotocin (STZ) at 2.53 1024mol/L served as a positive
control forb-cell damage. At the end of the incubation period, media were collected to measure secreted insulin (A), and the cells were subjected
to extraction to measure cellular insulin content (B). Ratios of insulin secretion to insulin content are also presented (C). Data are mean 6 SE of six independent samples. *P < 0.05, **P < 0.001 vs. control.
of the effects of POPs and other chemicals on pancreatic b-cell function. When we compared the results of insulin secretion estimated by 2-h seven-sample OGTT with those of HOMA-b, the results differed depending on how in-sulin secretion was measured. Different associations would be expected because correlation coefficients among these markers were not.0.3. In addition, the clearly contrasting associations between POPs andFdby insulin-resistant levels
suggest that the accurate analysis of different phases of in-sulin secretion is important. Furthermore, the interaction between POPs and insulin-resistant levels onFd was
ob-served when HOMA-IR, not the marker of insulin sensitiv-ity estimated by 2-h seven-sample OGTT, was used as a marker of insulin sensitivity. This finding may be related to the fact that OGTT provides useful information about glucose tolerance but not insulin sensitivity/IR per se (32,33). All these findings suggest that how insulin secretion and insulin sen-sitivity are measured in human studies is important.
The study has several limitations. First, it was cross-sectional, which does not allow for determination of a temporal relation. Nonetheless, that pancreatic b-cell function affects serum concentrations of OCPs or PCBs is unlikely. In addition, the supporting evidence from our in vitro experiments suggests that the associations observed in this study may be causal. In a future study, we can evaluate whether POPs affect the course ofb-cell function over time. Second, we assessed insulin secretion and insulin sensitivity by using a reduced version of the oral minimal model rather than gold standard techniques, such as the hyperglycemic-euglycemic clamp, for practical reasons. However, the use of OGTT can be preferable for physiolog-ical significance, not for simplicity (14).
In conclusion, this study provides important findings that mechanistically support the recent evidence linking POPs and T2D (1). Chronic exposure to low doses of POPs may increase the risk of T2D by primarily affecting pancre-aticb-cell function rather than IR. Because the impairment of insulin secretion (rather than impairment of insulin ac-tion) is a critical determinant of T2D (34), the influence of POPs on pancreaticb-cell function should be urgently eval-uated in a prospective study.
Funding.This study was supported by the Korean Health Technology R&D Project funded by the Ministry of Health and Welfare (HI13C0715), a grant of the Korea Health Technology R&D Project through the Korea Health Industry Development Institute (KHIDI) funded by the Ministry of Health and Welfare, Republic of Korea (HI16C1501), and the Basic Science Research Program through the National Re-search Foundation of Korea (NRF) funded by the Ministry of Science, ICT and Future Planning (NRF-2017R1A2B3006406).
Duality of Interest.No potential conflicts of interest relevant to this article were reported.
Author Contributions. Y.-M.L. performed the statistical analyses and drafted the human data parts of the manuscript. C.-M.H. and S.P. performed the in vitro experiments and drafted the in vitro data parts of the manuscript. S.-A.K. conducted the experiments on human subjects. T.T. performed the in vitro experiments. Y.-R.Y., D.-J.K., H.-C.K., and H.-B.M. contributed to the discussion. I.-K.L. conceived the hypothesis and edited the manuscript. D.-H.L. conceived the
hypothesis, led the project, and edited the manuscript. D.-H.L. is the guarantor of this work and, as such, had full access to all the data in the study and takes responsibility for the integrity of the data and the accuracy of the data analysis.
References
1. Lee DH, Porta M, Jacobs DR Jr, Vandenberg LN. Chlorinated persistent organic
pollutants, obesity, and type 2 diabetes. Endocr Rev 2014;35:557–601
2. Lee YM, Kim KS, Jacobs DR Jr, Lee DH. Persistent organic pollutants in adipose
tissue should be considered in obesity research. Obes Rev 2017;18:129–139
3. American Diabetes Association. Diagnosis and classification of diabetes
mel-litus. Diabetes Care 2011;34(Suppl. 1):S62–S69
4. Imamura F, Mukamal KJ, Meigs JB, et al. Risk factors for type 2 diabetes
mellitus preceded byb-cell dysfunction, insulin resistance, or both in older adults:
the Cardiovascular Health Study. Am J Epidemiol 2013;177:1418–1429
5. McCarthy MI. Genomics, type 2 diabetes, and obesity. N Engl J Med 2010;363:
2339–2350
6. Lee DH, Steffes MW, Sjödin A, Jones RS, Needham LL, Jacobs DR Jr. Low dose organochlorine pesticides and polychlorinated biphenyls predict obesity, dys-lipidemia, and insulin resistance among people free of diabetes. PLoS One 2011;6: e15977
7. Ruzzin J, Petersen R, Meugnier E, et al. Persistent organic pollutant expo-sure leads to insulin resistance syndrome. Environ Health Perspect 2010;118:
465–471
8. Jensen TK, Timmermann AG, Rossing LI, et al. Polychlorinated biphenyl ex-posure and glucose metabolism in 9-year-old Danish children. J Clin Endocrinol
Metab 2014;99:E2643–E2651
9. Jørgensen ME, Borch-Johnsen K, Bjerregaard P. A cross-sectional study of the association between persistent organic pollutants and glucose intolerance among
Greenland Inuit. Diabetologia 2008;51:1416–1422
10. Park SH, Ha E, Hong YS, Park H. Serum levels of persistent organic pollutants and insulin secretion among children age 7-9 years: a prospective cohort study.
Environ Health Perspect 2016;124:1924–1930
11. Færch K, Højlund K, Vind BF, et al. Increased serum concentrations of per-sistent organic pollutants among prediabetic individuals: potential role of altered
substrate oxidation patterns. J Clin Endocrinol Metab 2012;97:E1705–E1713
12. Muoio DM, Newgard CB. Mechanisms of disease: molecular and metabolic mechanisms of insulin resistance and beta-cell failure in type 2 diabetes. Nat Rev
Mol Cell Biol 2008;9:193–205
13. DeFronzo RA, Tobin JD, Andres R. Glucose clamp technique: a method for
quantifying insulin secretion and resistance. Am J Physiol 1979;237:E214–E223
14. Ferrannini E, Mari A. Beta cell function and its relation to insulin action in
humans: a critical appraisal. Diabetologia 2004;47:943–956
15. Dalla Man C, Campioni M, Polonsky KS, et al. Two-hour seven-sample oral glucose tolerance test and meal protocol: minimal model assessment of beta-cell responsivity and insulin sensitivity in nondiabetic individuals. Diabetes 2005;54:
3265–3273
16. Dalla Man C, Yarasheski KE, Caumo A, et al. Insulin sensitivity by oral glucose minimal models: validation against clamp. Am J Physiol Endocrinol Metab 2005;289:
E954–E959
17. Breda E, Cavaghan MK, Toffolo G, Polonsky KS, Cobelli C. Oral glucose toler-ance test minimal model indexes of beta-cell function and insulin sensitivity.
Di-abetes 2001;50:150–158
18. Breda E, Toffolo G, Polonsky KS, Cobelli C. Insulin release in impaired glucose tolerance: oral minimal model predicts normal sensitivity to glucose but defective
response times. Diabetes 2002;51(Suppl. 1):S227–S233
19. Toffolo G, Breda E, Cavaghan MK, Ehrmann DA, Polonsky KS, Cobelli C. Quantitative indexes of beta-cell function during graded up&down glucose infusion from C-peptide minimal models. Am J Physiol Endocrinol Metab 2001;280:
E2–E10
20. Cobelli C, Dalla Man C, Toffolo G, Basu R, Vella A, Rizza R. The oral minimal
21. Matthews DR, Hosker JP, Rudenski AS, Naylor BA, Treacher DF, Turner RC. Homeostasis model assessment: insulin resistance and beta-cell function from fasting plasma glucose and insulin concentrations in man. Diabetologia 1985;28:
412–419
22. Phillips DL, Pirkle JL, Burse VW, Bernert JT Jr, Henderson LO, Needham LL. Chlorinated hydrocarbon levels in human serum: effects of fasting and feeding. Arch
Environ Contam Toxicol 1989;18:495–500
23. Allagnat F, Cunha D, Moore F, Vanderwinden JM, Eizirik DL, Cardozo AK. Mcl-1
downregulation by pro-inflammatory cytokines and palmitate is an early event
contributing tob-cell apoptosis. Cell Death Differ 2011;18:328–337
24. Santini E, Fallahi P, Ferrari SM, Masoni A, Antonelli A, Ferrannini E. Effect of PPAR-gamma activation and inhibition on glucose-stimulated insulin release in
INS-1e cells. Diabetes 2004;53(Suppl. 3):S79–S83
25. Liu Q, Wang Q, Xu C, et al. Organochloride pesticides impaired mitochondrial function in hepatocytes and aggravated disorders of fatty acid metabolism. Sci Rep 2017;7:46339
26. Lee DH, Jacobs DR Jr. Hormesis and public health: can glutathione depletion and mitochondrial dysfunction due to very low-dose chronic exposure to persistent
organic pollutants be mitigated? J Epidemiol Community Health 2015;69:294–300
27. Yoon KH, Lee JH, Kim JW, et al. Epidemic obesity and type 2 diabetes in Asia.
Lancet 2006;368:1681–1688
28. Tanabe S, Minh TB. Dioxins and organohalogen contaminants in the
Asia-Pacific region. Ecotoxicology 2010;19:463–478
29. Hue O, Marcotte J, Berrigan F, et al. Plasma concentration of organochlorine
compounds is associated with age and not obesity. Chemosphere 2007;67:1463–
1467
30. Chang AM, Halter JB. Aging and insulin secretion. Am J Physiol Endocrinol
Metab 2003;284:E7–E12
31. Meneilly GS, Elliott T, Tessier D, Hards L, Tildesley H. NIDDM in the elderly.
Diabetes Care 1996;19:1320–1325
32. Steil GM, Hwu CM, Janowski R, et al. Evaluation of insulin sensitivity and beta-cell function indexes obtained from minimal model analysis of a meal tolerance test.
Diabetes 2004;53:1201–1207
33. Caumo A, Bergman RN, Cobelli C. Insulin sensitivity from meal tolerance tests
in normal subjects: a minimal model index. J Clin Endocrinol Metab 2000;85:4396–
4402
34. Ashcroft FM, Rorsman P. Diabetes mellitus and theb cell: the last ten years.