저작자표시-비영리-변경금지 2.0 대한민국 이용자는 아래의 조건을 따르는 경우에 한하여 자유롭게 l 이 저작물을 복제, 배포, 전송, 전시, 공연 및 방송할 수 있습니다. 다음과 같은 조건을 따라야 합니다: l 귀하는, 이 저작물의 재이용이나 배포의 경우, 이 저작물에 적용된 이용허락조건 을 명확하게 나타내어야 합니다. l 저작권자로부터 별도의 허가를 받으면 이러한 조건들은 적용되지 않습니다. 저작권법에 따른 이용자의 권리는 위의 내용에 의하여 영향을 받지 않습니다. 이것은 이용허락규약(Legal Code)을 이해하기 쉽게 요약한 것입니다. Disclaimer 저작자표시. 귀하는 원저작자를 표시하여야 합니다. 비영리. 귀하는 이 저작물을 영리 목적으로 이용할 수 없습니다. 변경금지. 귀하는 이 저작물을 개작, 변형 또는 가공할 수 없습니다.
Association of Aortic Vascular Stiffness
with Epicardial and Pericardial Adipose Tissues
on 64-Multidetector Computed Tomography
: In Relation with Coronary Atherosclerosis
by
Tae Young Choi
Major in Medicine
Department of Medical Sciences
The Graduate School, Ajou University
Association of Aortic Vascular Stiffness
with Epicardial and Pericardial Adipose Tissues
on 64-Multidetector Computed Tomography
: In Relation with Coronary Atherosclerosis
by
Tae Young Choi
A Dissertation Submitted to The Graduate School of
Ajou University in Partial Fulfillment of the Requirements
for the Degree of Ph.D.
of Medicine
Supervised by
Seung Jea Tahk, M.D., Ph.D.
Major in Medicine
Department of Medical Sciences
The Graduate School, Ajou University
This certifies that the dissertation
of Tae Young Choi is approved.
SUPERVISORY COMMITTEE
Seung Jea Tahk
Jun Han Shin
Doo Kyung Kang
So Yeon Choi
Hyuk Jae Chang
The Graduate School, Ajou University
i
- ABSTRACT -
Association of Aortic Vascular Stiffness with Epicardial and
Pericardial Adipose Tissues on 64-Multidetector Computed
Tomography : In Relation with Coronary Atherosclerosis
Objectives: Increased measured vascular stiffness is an early marker of atherosclerosis and
is associated with cardiovascular risk factors. Coronary artery calcium (CAC) and adipose tissues are accurate markers of overall burden of coronary atherosclerosis and metabolic status, respectively. We evaluated the relation of vascular stiffness with epicardial (EAT) and pericardial (PAT) adipose tissues, as well as the presence and severity of CAC.
Methods: One hundred and eleven consecutive subjects, mean age 59±11 years, 78% male,
underwent 64-multidetector row cardiac computed tomography (MDCT) and their carotid-radial pulse wave velocity (PWV) was measured using SphygmoCor tonometry. EAT and total thoracic adipose tissue (TAT) volumes were measured using MDCT. PAT was calculated as TAT – EAT. The highest tertile of EAT (≥ 111 ml) and PAT (≥ 103 ml) were defined as significant adipose tissue depots.
Results: PWV was moderately associated with EAT (r=0.46, p<.001), and PAT (r=0.41,
p<.001). PWV increased proportionally with the severity of CAC from 0-400+. The relative risk of highest vs. lowest tertile of PWV was 3.03 (95% CI 1.22-7.51, p=0.01) for significant EAT, 2.34 (95% CI 1.10-4.90, p=0.02) for significant PAT and 2.46 (95% CI 1.13-3.14, p=0.01) for significant CAC (CAC 100+) after adjustment for conventional cardiovascular
ii
risk factors. This relative risk was increased after combination of CAC 100+ with each significant adipose tissue.
Conclusion: Increased vascular stiffness is associated with increase in EAT, PAT and
coronary atherosclerosis. EAT was associated with higher relative risk of PWV, compared with CAC, suggesting a role of adipose tissue in vascular stiffness.
Keyword : Vascular stiffness, Epicardial adipose tissue, Pericardial adipose tissue, Coronary atherosclerosis, Cardiac computed tomography
iii
TABLE OF CONTENTS
ABSTRACT ··· i
TABLE OF CONTENTS ··· iii
LIST OF FIGURES ··· v
LIST OF TABLES ··· vi
Ⅰ. INTRODUCTION ··· 1
Ⅱ. STUDY POPULATION AND METHODS ··· 3
A. STUDY POPULATION ··· 3
B. MEASUREMENT OF CAROTID-RADIAL PWV ··· 3
C. MDCT IMAGE ACQUISITION AND POST-PROCESSINGSTUDY
POPULATION ··· 4
D. MEASUREMENT OF CAC SCORE ··· 4
E. MEASUREMENT OF ADIPOSE TISSUE VOLUME ··· 5
F. STATISTICAL ANALYSIS ··· 6
Ⅲ. RESULTS ··· 8
Ⅳ. DISCUSSTION ··· 14
A. ASSOCIATION OF VASCULAR STIFFNESS WITH ADIPOSE TISSUE POPULATION ··· 14
B.ASSOCIATION OF VASCULAR STIFFNESS WITH CAC ··· 15
C. ASSOCIATION OF ADIPOSE TISSUE WITH CAC ··· 15
Ⅴ. CONCLUSION ··· 17
iv
v
LIST OF FIGURES
Fig. 1. Quantification of epicardial (EAT) and thoracic adipose tissue (TAT) using dedicated software using contrast enhanced MDCT ··· 6
Fig. 2. Mean values of (A) volume of epicardial (EAT) and pericardial adipose tissue (PAT) across tertiles of pulse wave velocity (PWV), (B) PWV
across coronary artery calcium (CAC) score, and (C) CAC score across tertiles of PWV (p=0.03), and (D) increasing volume of EAT and PAT with higher CAC score groups (p=.001, p=.001, respectively) ··· 11
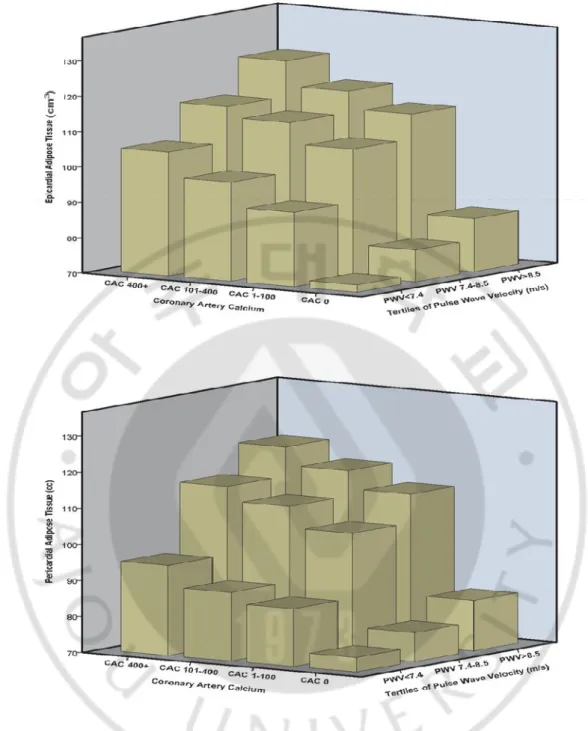
Fig. 3. Relationship of epicardial and pericardial adipose tissue with vascular stiffness and coronary atherosclerosis ··· 13
vi
LIST OF TABLES
Table 1. Baseline characteristics divided by pulse wave velocity (PWV) ··· 10
Table 2. (A) Increase in epicardial adipose tissue (EAT) and pericardial adipose tissue (PAT) Volume as well as coronary artery calcium (CAC) Score with each tertile increase in pulse wave velocity (PWV), and (B) relative risk of increased pulse wave velocity (PWV) by increased epicardial adipose tissue (EAT), pericardial adipose tissue (PAT), and significant coronary artery
1
-I. INTRODUCTION
Arterial stiffness measured by pulse wave velocity (PWV) is an early manifestation of atherosclerosis and an independent risk factor of cardiovascular outcome (Laurent et al., 2001). It has been shown to correlate highly with the coronary atherosclerosis burden measured by coronary artery calcium (CAC) (Liu et al., 2011).
Adipose tissue plays an important role in energy homeostasis storing lipid depot and inflammation, as well by producing tumor necrosis factor (TNF)- , interleukin-6 (IL-6), and other cytokines as an endocrine organ secreting hormone (Mazurek et al., 2003; Ahima, 2006). As an active source of multiple bioactive factors, epicardial adipose tissue (EAT) was also reported to be involved in plaque instability, arterial thrombosis (Tavora et al., 2010) and is associated with increased adverse cardiac events (Taguchi et al., 2001; Rosito et al., 2008; Cheng et al., 2010). Studies have also shown an association and a role of adipose tissues in coronary atherosclerosis, which may be well explained by their proximity to the coronary vessels
(Taguchi et al., 2001; Jeong et al., 2007; Ahn et al., 2008; Sarin et al., 2008; Ahmadi et al., 2010). Since adipose tissues are associated with the coronary atherosclerosis measured by CAC, it may be important to evaluate the association of adipose tissues with PWV and whether such an association is present in the absence of CAC in patients with arterial stiffness, which may represent the early manifestation of atherosclerosis.
In this study, we evaluated whether 1) vascular stiffness is associated with the extent of CAC as well as adipose tissue present around the heart [EAT and pericardial adipose tissue (PAT), adipose tissue situated on outside the parietal pericardium within the mediastinum], 2) vascular stiffness is associated with the extent of adipose tissue in subjects
2
3
-II. STUDY POPULATION AND METHODS
A. STUDY POPULATION
The study included 128 consecutive outpatients who were referred for MDCT scan. All patients were ≥18 years of age and were referred for chest pain, abnormal stress test, shortness of breath, or syncope to evaluate coronary artery disease (CAD). Exclusion criteria for the study included known allergy to iodine, rhythm disturbances, or renal failure. We excluded the patient who had known CAD and previous stents (n=1). After MDCT, patients were excluded if they had intracardiac devices pacemakers (n=3) or implantable cardioverter defibrillators (n=1). Patients were also excluded from the study if epicardial and total thoracic adipose tissue (TAT) could not be measured due to severe misalignment artifact (n=1) or insufficient scan length (n=11). One hundred eleven patients were included to final statistical analysis. The study protocol and consent form were approved by the Institutional Review Board Committee.
B. MEASUREMENT OF CAROTID-RADIAL PWV
The radial and carotid artery sites were used to assess the PWV. Measurement of carotid-radial PWV was performed after an overnight fast. All patients were asked to restrain from consumption of caffeinated beverages and alcohol, and smoking for more than 12 hours before the assessment. Studies were conducted in a quiet, temperature-controlled room (23-25°C) one hour prior to a scheduled MDCT. Brachial blood pressure was measured using a validated oscillometric device (705CP; Omron Co., Tokyo, Japan). After blood pressure was measured, PWV was obtained in a supine position with applanation tonometry using the
4
-SphygmoCor system (version 7·1; AtCor Medical Co., IL, USA). The surface distance from the supra-sternal notch to the radial recording site was measured. PWV was calculated from the distance between measurement points and the measured time delay (PWV= ∆Distance between carotid and radial artery /∆time). All measurements were performed by one investigator. This technique has been validated for its reproducibility and used extensively
(O'Rourke et al., 2002).
C. MDCT IMAGE ACQUISITION AND POST-PROCESSING
All MDCT images were acquired using 64-multidetector row Lightspeed VCT scanner (General Electric Healthcare Co., Milwaukee, WI, USA). The details of the image acquisition were previously published (Budoff et al., 2008). All patients underwent non-contrast and contrast enhanced studies for CAD evaluation. The scan parameters for noncontrast scan were 64×2.5 mm section collimation, 120 kV tube voltage, and 400 mA tube current, acquired during 75% of RR interval using prospective electrocardiogram (ECG) triggering. Applied scan parameters for contrast enhanced scan were 64×0.625 mm section collimation, 100 or 120 kV tube voltage, and 350-780 mA tube current. Dose modulation was used in all cases to reduce radiation.
D. MEASUREMENT OF CAC SCORE
CAC was considered present in a coronary artery when a density of >130 Hounsfield units was detected in >3 contiguous pixels (>1.02 mm2) overlying that coronary artery and quantified using the previously described Agatston scoring method (Agatston et al., 1990). The lesion score was calculated by multiplying the lesion area by the density factor obtained
5
-from the maximal Hounsfield units (HU) in this area. The density factor was 1 for lesions with a maximum density of 130-199 HU; 2 for a maximum density of 200-299 HU; 3 for a maximum density of 300-399 HU and 4 for lesions with density >400 HU. Total calcium score was determined by summing individual lesion scores from each of the four main coronary arteries (left main, left anterior descending, circumflex, and right coronary arteries).
E. MEASUREMENT OF ADIPOSE TISSUE VOLUME
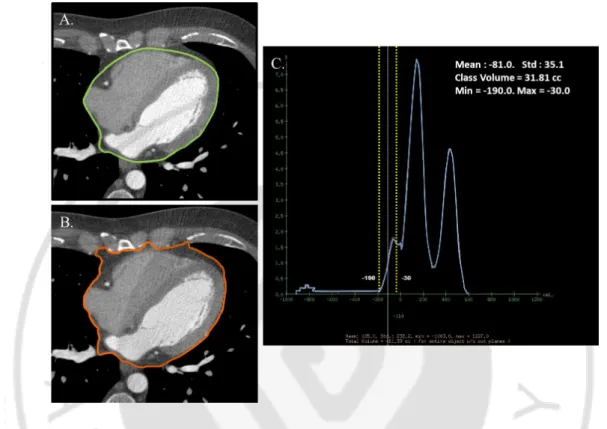
All adipose tissue measurements were performed on the axial slices on GE Advantage Windows 4.4 Workstations using contrast enhanced MDCT images to help in the tracing out of the pericardium by making it easily identifiable (Fig. 1).
EAT was defined as the adipose tissue present between the surface of the heart and the visceral pericardium. The measurement of EAT was performed on axial images starting from 10 mm above the superior extent of the left main ostium to the last slice containing the part of the pericardial sac. It was measured by manually tracing out the pericardium every 10 slices below the start point and software automatically tracing out the segments in between selected slices. TAT measurement was performed using the same superior boundary as described above. The inferior boundary was defined by the diaphragm. The anterior border of the volume was defined by the chest wall and posterior border by the aorta, bronchi and esophagus. Adipose tissue present in the posterior mediastinum and para-aortic adipose tissue was not included in the TAT measurements. The observer was given interactive access to the coronal and sagittal images to help facilitate accurate measurements.
Since absolute HU of the pixels correspond to the properties of that tissue selected, volume analysis software was used to discern fat from other tissues using a threshold of -190
6
-to -30 HU. PAT was calculated by subtracting out EAT from TAT volume. All adipose tissue measurements were performed by one experienced MDCT reader, blinded to patient baseline characteristics, PWV, and a precise CAC score.
Fig. 1. Quantification of epicardial (EAT) and thoracic adipose tissue (TAT) using dedicated software using contrast enhanced MDCT. For EAT volume (A), the border of the pericardium was traced manually on axial slices for EAT volume starting from 10mm above the left main ostium to the last slice containing the part of pericardial sac in every 10 slices. The anterior border was defined by the chest wall and posterior border by the aorta, bronchi and esophagus for TAT volume (B). Hounsfield units from −190 to −30 were assigned to isolate adipose tissue within the total selected volume. Adipose tissue within the selected volume was automatically quantified (C).
F. STATISTICAL ANALYSIS
All statistical analyses were performed with PASW version 18.0 (SPSS, Chicago, IL, USA). Continuous variables are shown as mean ± standard deviation (SD) where applicable,
7
-otherwise, medians and 25th and 75th percentiles (interquartile range [IQR]) are given. All categorical data are reported as a percentage or absolute number. Kruskal-Wallis tests and analysis of variance tests were used to assess differences between groups. CAC score was classified according to the calcium score groupings of 0 (n=19), 1-100 (n=28), 101-400 (n=33), 400+ (n=31). The association of vascular stiffness with each adipose tissue depot as well as CAC was analyzed by multiple regression analysis. A Spearman correlation was used for correlation between EAT, PAT, and PWV. The logistic regression analyses were employed to assess the relation of increased PWV and each adipose tissue volume as well as significant CAC (CAC 100+). Increased PWV (>8.5 m/s) was defined as the highest tertile of PWV, compared to the lowest tertile of PWV (<7.4 m/s). The highest tertile of EAT (≥111 ml) and PAT (≥103 ml) were defined as significant adipose tissue depots. Interrelations were studied using linear regression analysis. These analyses were adjusted for age, gender, and other traditional cardiovascular risk factors such as diabetes, hypertension, hypercholesterolemia, family history of premature CAD, smoking status, and body mass index (BMI).
8
-III. RESULTS
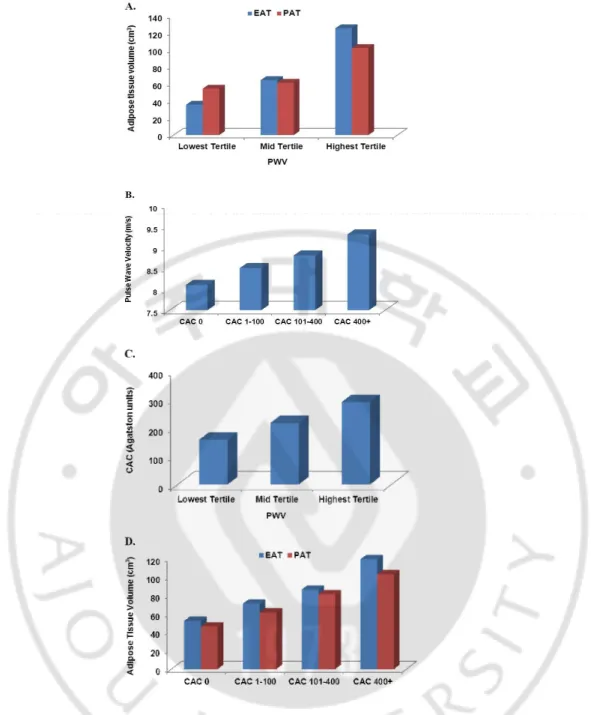
The baseline characteristics of 111 consecutive participants are summarized in Table 1 according to their PWV categories. The mean PWV in the entire cohort was 7.9±1.2 m/s. There were no significant differences among PWV categories in the prevalence of cardiovascular risk factors except smoking status (Table 1). There was a modest correlation between EAT (r=0.46, p<.001) and PAT (r=0.41, p<.001) volumes with PWV. Similarly, EAT and PAT were significantly increased with each tertile increase in PWV (Table 1 and Fig. 2A). The minimal mean EAT and PAT were observed in the lowest PWV cohort, whereas the maximal mean EAT and PAT were observed in the highest PWV cohort. PWV (m/s) increased proportionally with the presence and severity of CAC from CAC 0 to CAC 400+ (8.1±0.1, 8.5±0.1, 8.8±0.1, 9.3±0.2, respectively, p=.001) (Fig. 2B). CAC was significantly increased with each tertile increase in PWV (Fig. 2C). Significant association between increase in adipose tissues (EAT and PAT) with the severity of CAC was observed (Fig. 2D).
After adjustment for cardiovascular factors using linear regression analysis, the EAT and PAT increased 48.6 cm3, and 27.4 cm3 with each tertile increase in PWV from lowest to the highest PWV (p=.001, p=.002, respectively) (Table 2A). Significant EAT and PAT were independent predictors of increased PWV, after adjustment for cardiovascular risk factors using logistic regression analysis. The relative risk of the highest vs. lowest tertile of PWV was 3.03 (95%CI 1.22-7.51, p=0.01) for significant EAT, 2.34 (95%CI 1.10-4.90, p=0.02) for significant PAT, and 2.46 (95%CI 1.13-3.14, p=0.01) for significant CAC after controlling for cardiovascular risk factors. Combination of CAC 100+ and significant adipose tissues provide more robust relative risk than either alone (Table 2B). Each adipose
9
-tissue volume was increased proportionally in each CAC category as PWV increased. Similarly, each adipose tissue volume was increased in each PWV category as CAC increased (Fig. 3). The maximum level of adipose tissue volume was observed in a group with the highest CAC and PWV. The minimum level of adipose tissue volume was found in a group with CAC 0 (AU) and PWV <7.4 (m/s). Interestingly, among subjects without burden of coronary atherosclerosis (CAC 0), adipose tissues (p=0.001 for EAT, p=0.001 for PAT) were increased proportionally with each category increase in PWV.
- 10 - Table 1. Baseline characteristics divided by pulse wave velocity (PWV).
Total Lowest Tertile PWV Mid Tertile PWV Highest Tertile PWV
P-value N=111 N=18 N=40 N=53 Age (years) 59±11 60±7 59±11 60±10 0.9 Male, n (%) 87 (78) 14 (80) 28 (70) 45 (85) 0.2 Diabetes, n (%) 12 (11) 2 (10) 4 (10) 6 (11) 0.9 Hypertension, n (%) 52 (47) 5 (28) 21 (53) 26 (49) 0.2 Hypercholesterolemia, n (%) 65 (59) 10 (56) 27 (68) 28 (53) 0.6 Family History of CAD, n (%) 56 (50) 9 (50) 20 (51) 27 (50) 0.9 Smoking Status, n (%) 26 (23) 2 (13) 10 (24) 14 (27) 0.01 Systolic blood pressure (mmHg) 131±17 127±17 133±16 136±20 0.2 Diastolic blood pressure (mmHg) 78±11 79±9 78±9 80±10 0.6 BMI (kg/m2) 27.7±4.5 27.5±4.7 27.9±4.2 27.6±4.6 0.8 CAC score (AU), median (IQR) 215 (38-304) 38 (32-159) 196 (42-290) 290 (67-437) 0.03 EAT (cm3) 89±42 35.5±9.2 64.4±9.7 125.1±30.4 <.001 PAT (cm3) 79±52 54.3±10.2 61.3±8.7 101.9±20.9 <.001 AU; Agatston units. BMI; body mass index. CAC; coronary artery calcium. CAD; coronary artery disease. EAT; epicardial adipose tissue. IQR; interquartile range. PAT; pericardial adipose tissue. Lowest tertile of PWV; PWV<7.4 m/s, mid tertile of PWV; PWV 7.4-8.5 m/s, and highest tertile of PWV; PWV >8.5 m/s. Values are presented as mean±standard deviation.
- 11 -
Fig. 2. Mean values of (A) volume of epicardial (EAT) and pericardial adipose tissue (PAT) across tertiles of pulse wave velocity (PWV), (B) PWV across coronary artery calcium (CAC) score, and (C) CAC score across tertiles of PWV (p=0.03), and (D) increasing volume of EAT and PAT with higher CAC score groups (p=.001, p=.001, respectively). Models were adjusted for conventional risk factors. Lowest tertile of PWV; <7.4 m/s, mid tertile of PWV; 7.4-8.5 m/s, and highest tertile of PWV; >8.5 m/s.
- 12 -
Volume as well as coronary artery calcium (CAC) score with each tertile increase in pulse wave velocity (PWV), and (B) relative risk of increased pulse wave velocity (PWV) by increased epicardial adipose tissue (EAT), pericardial adipose tissue (PAT), and significant coronary artery calcium (CAC).
A.
Adjusted Model a EAT (cm3) PAT (cm3) CAC (AU)
PWV b 48.6 (42.6-54.6), p=0.001 27.4 (19.9-39.8), p=0.002 67 (36-130), p<0.001 Generalized linear models. a Adjusted for age, gender, diabetes, hypertension, hypercholesterolemia,
family history of coronary artery disease, smoking status, and body mass index. b Each tertile increase in PWV.
B.
Adjusted Model a Lowest tertile of PWV e Highest tertile of PWV f P-value EAT (cm3) b 1 (Ref) 3.03 (1.22- 7.51) 0.01 PAT (cm3) b 1 (Ref) 2.34 (1.10-4.90) 0.02 CAC (AU) c 1 (Ref) 2.46 (1.13- 3.14) 0.01 CAC & EAT d 1 (Ref) 12.06 (1.59-37.49) 0.01
CAC & PAT d 1 (Ref) 6.71 (1.18-24.90) 0.03
Logistic regression analysis. AU; Agatston units. CI; confidence interval. a Adjusted for age, gender,
diabetes, hypertension, hypercholesterolemia, family history of coronary artery disease, smoking status, and body mass index. b Highest tertile vs. lower 2 tertiles of EAT or PAT. c CAC 100+ vs. CAC 0-99. d CAC 100+ and highest tertile vs. CAC 0-99 and lower 2 tertiles of EAT or PAT. e Lowest tertile of PWV; PWV<7.4 m/s. f Highest tertile of PWV; PWV>8.5 m/s.
- 13 -
Fig. 3. Relationship of epicardial and pericardial adipose tissue with vascular stiffness and coronary atherosclerosis. Epicardial and pericardial adipose tissues increased with each tertile increase in pulse wave velocity and coronary artery calcium categories. The highest volume of each adipose tissue was observed in a group with coronary artery calcium (CAC) score 400+ (Agatston units) and pulse wave velocity (PWV) 8.5 + (m/s) (both significant, p<.001 for the trend).
- 14 -
IV. DISCUSSION
PWV is a relatively simple, noninvasive test that could be a useful adjunct to conventional CAD risk factors in identifying patients at increased risk for future cardiovascular events. The present study demonstrates the following: 1) EAT and PAT were highly correlated with PWV and were found to be independent predictors of increased PWV, 2) the highest levels of adipose tissues were found in patients with the highest PWV and CAC score and groups without CAC had the least adipose tissues, and 3) in patients with CAC score of zero, adipose tissues volumes increased with the severity of PWV.
A. ASSOCIATION OF VASCULAR STIFFNESS WITH ADIPOSE
TISSUE
Vascular stiffness is a marker related to the severity of atherosclerosis and/or predicting the risk of cardiovascular disease (Willum-Hansen et al., 2006). Visceral adiposity of the abdomen has been identified as a risk factor for accelerated arterial stiffening in elderly participants (Sutton-Tyrrell et al., 2001). Natale et al (Natale et al., 2009) reported that increased echocardiographic measurement of EAT was associated with increased carotid vascular stiffness. There are a number of mechanisms such as increased insulin resistance, stimulation of the sympathetic nervous system, or impaired endothelium-dependent vasodilation by which adipose tissue might contribute to vascular stiffening (O'Hare et al., 1989; ter Maaten et al., 1999; Montagnani and Quon, 2000). Inflammation originating from obesity (Yudkin et al., 1999) and an increased level of the hormone leptin were reported to be associated with reduced arterial distensibility (Singhal et al., 2002). In our study, each volume of adipose tissue
- 15 -
surrounding the heart was increased in patients with higher vascular stiffness. It was an independent predictor for the highest tertile of PWV after adjustment for conventional cardiac risk factors, more than the CAC.
Interestingly, in patients without CAC, PWV was increased in patients with higher levels of EAT and PAT. This implies that the anatomical marker of the volume of visceral adipose tissue is influential in predicting vascular stiffness as an early marker of subclinical atherosclerosis. This suggests early systemic interaction of visceral adipose tissues with vascular stiffness prior to atherosclerotic burden of coronary vasculature.
B. ASSOCIATION OF VASCULAR STIFFNESS WITH CAC
It has been reported that increased PWV is associated with a higher total CAC and coronary artery plaque burden (McLeod et al., 2004; Kullo et al., 2006). Common etiological factors of vascular stiffness and atherosclerosis, presence of atherosclerosis itself (Farrar et al., 1991), and mediators related with atherosclerosis (Wang and Fitch, 2004) might explain this association between vascular stiffness and atherosclerosis. In this study, PWV was increased with the increased extent of CAD represented by CAC. CAC 100+ was an independent predictor for the highest tertile of PWV after adjustment for conventional cardiovascular risk factors.
C. ASSOCIATION OF ADIPOSE TISSUE WITH CAC
EAT or PAT is associated with CAD (Taguchi et al., 2001; Jeong et al., 2007; Rosito et al., 2008; Sarin et al., 2008). In this study, we measured the whole EAT and PAT around the heart by MDCT, because EAT and PAT are concentrated in the atrioventricular and interventricular
- 16 -
grooves and along the major branches of the coronary arteries in the normal heart (Iacobellis et al., 2005). Considering its anatomical location, surrounding the coronary arteries and the myocardium, EAT may play a potent role in the pathogenesis of CAD as an endocrine organ. In fact, segments of coronary arteries lacking EAT or separated from it by a bridge of myocardial tissue are reported to be protective against the development of atherosclerosis in those segments (Ishikawa et al., 1997). PAT situated on outside the parietal pericardium is supplied by the pericardiacophrenic artery, a branch of internal mammary artery (Taguchi et al., 2001). Presently, PAT was related with CAC as well as EAT. This suggests that both adipose tissues depots producing pro-inflammatory mediators and cytokines are suspected to have a local influence on the underlying coronary arteries as paracrine organs.
This study had several limitations. Carotid-femoral PWV is considered as the ‘gold-standard’ measurement of arterial stiffness (Laurent et al., 2006). Although we measured carotid-radial PWV for arterial stiffness, it was known that correlation of carotid-femoral vs. carotid-radial PWV measurements is high (r2 =0.90) (Di Iorio et al., 2010). This was a cross-sectional study. The sample size was relatively small. To conclusively clarify the endocrinologic roles of adipose tissues related to vascular stiffness and CAD, more studies including biomarkers (e.g., C-reactive protein, adiponectin, insulin) are needed.
- 17 -
V. CONCLUSION
This study reveals the association of EAT and PAT, measures of obesity with an effect on coronary atherosclerosis, with vascular stiffness, which is an early manifestation of atherosclerosis. This association persisted even in patients with CAC scores of zero, which indicates the probability of early systemic interaction of vascular stiffness with visceral adipose tissue prior to subclinical coronary atherosclerosis. Our findings suggest that measures of vascular stiffness can identify individuals at risk for CAD, and metabolic disorders. EAT and PAT are useful anatomical indicators showing association with increased vascular stiffness and coronary atherosclerosis.
- 18 -
REFERENCES
1. Agatston AS, Janowitz WR, Hildner FJ, Zusmer NR, Viamonte M, Jr., Detrano R: Quantification of coronary artery calcium using ultrafast computed tomography. J Am Coll Cardiol 15: 827-832, 1990
2. Ahima RS: Adipose tissue as an endocrine organ. Obesity (Silver Spring) 14 Suppl 5: 242S-249S, 2006
3. Ahmadi N, Nabavi V, Yang E, Hajsadeghi F, Lakis M, Flores F, Zeb I, Bevinal M, Ebrahimi R, Budoff M: Increased epicardial, pericardial, and subcutaneous adipose tissue is associated with the presence and severity of coronary artery calcium. Acad Radiol 17: 1518-1524, 2010
4. Ahn SG, Lim HS, Joe DY, Kang SJ, Choi BJ, Choi SY, Yoon MH, Hwang GS, Tahk SJ, Shin JH: Relationship of epicardial adipose tissue by echocardiography to coronary artery disease. Heart 94: e7, 2008
5. Budoff MJ, Dowe D, Jollis JG, Gitter M, Sutherland J, Halamert E, Scherer M, Bellinger R, Martin A, Benton R, Delago A, Min JK: Diagnostic performance of 64-multidetector row coronary computed tomographic angiography for evaluation of coronary artery stenosis in individuals without known coronary artery disease: results from the prospective multicenter ACCURACY (Assessment by Coronary Computed Tomographic Angiography of Individuals Undergoing Invasive Coronary Angiography) trial. J Am Coll Cardiol 52: 1724-1732, 2008
- 19 -
6. Cheng VY, Dey D, Tamarappoo B, Nakazato R, Gransar H, Miranda-Peats R, Ramesh A, Wong ND, Shaw LJ, Slomka PJ, Berman DS: Pericardial fat burden on ECG-gated noncontrast CT in asymptomatic patients who subsequently experience adverse cardiovascular events. JACC Cardiovasc Imaging 3: 352-360, 2010
7. Di Iorio BR, Cucciniello E, Alinei P, Torraca S: Reproducibility of regional pulse-wave velocity in uremic subjects. Hemodial Int 14: 441-446, 2010
8. Farrar DJ, Bond MG, Riley WA, Sawyer JK: Anatomic correlates of aortic pulse wave velocity and carotid artery elasticity during atherosclerosis progression and regression in monkeys. Circulation 83: 1754-1763, 1991
9. Iacobellis G, Corradi D, Sharma AM: Epicardial adipose tissue: anatomic, biomolecular and clinical relationships with the heart. Nat Clin Pract Cardiovasc Med 2: 536-543, 2005
10. Ishikawa Y, Ishii T, Asuwa N, Masuda S: Absence of atherosclerosis evolution in the coronary arterial segment covered by myocardial tissue in cholesterol-fed rabbits. Virchows Arch 430: 163-171, 1997
11. Jeong JW, Jeong MH, Yun KH, Oh SK, Park EM, Kim YK, Rhee SJ, Lee EM, Lee J, Yoo NJ, Kim NH, Park JC: Echocardiographic epicardial fat thickness and coronary artery disease. Circ J 71: 536-539, 2007
12. Kullo IJ, Bielak LF, Turner ST, Sheedy PF, 2nd, Peyser PA: Aortic pulse wave velocity is associated with the presence and quantity of coronary artery calcium: a community-based study. Hypertension 47: 174-179, 2006
- 20 -
13. Laurent S, Boutouyrie P, Asmar R, Gautier I, Laloux B, Guize L, Ducimetiere P, Benetos A: Aortic stiffness is an independent predictor of all-cause and cardiovascular mortality in hypertensive patients. Hypertension 37: 1236-1241, 2001
14. Laurent S, Cockcroft J, Van Bortel L, Boutouyrie P, Giannattasio C, Hayoz D, Pannier B, Vlachopoulos C, Wilkinson I, Struijker-Boudier H: Expert consensus document on arterial stiffness: methodological issues and clinical applications. Eur Heart J 27: 2588-2605, 2006
15. Liu CS, Li CI, Shih CM, Lin WY, Lin CH, Lai SW, Li TC, Lin CC: Arterial Stiffness Measured as Pulse Wave Velocity is Highly Correlated with Coronary Atherosclerosis in Asymptomatic Patients. J Atheroscler Thromb 18: 652-658, 2011
16. Mazurek T, Zhang L, Zalewski A, Mannion JD, Diehl JT, Arafat H, Sarov-Blat L, O'Brien S, Keiper EA, Johnson AG, Martin J, Goldstein BJ, Shi Y: Human epicardial adipose tissue is a source of inflammatory mediators. Circulation 108: 2460-2466, 2003 17. McLeod AL, Uren NG, Wilkinson IB, Webb DJ, Maxwell SR, Northridge DB, Newby
DE: Non-invasive measures of pulse wave velocity correlate with coronary arterial plaque load in humans. J Hypertens 22: 363-368, 2004
18. Montagnani M, Quon MJ: Insulin action in vascular endothelium: potential mechanisms linking insulin resistance with hypertension. Diabetes Obes Metab 2: 285-292, 2000
19. Natale F, Tedesco MA, Mocerino R, de Simone V, Di Marco GM, Aronne L, Credendino M, Siniscalchi C, Calabro P, Cotrufo M, Calabro R: Visceral adiposity and
- 21 -
arterial stiffness: echocardiographic epicardial fat thickness reflects, better than waist circumference, carotid arterial stiffness in a large population of hypertensives. Eur J Echocardiogr 10: 549-555, 2009
20. O'Hare JA, Minaker KL, Meneilly GS, Rowe JW, Pallotta JA, Young JB: Effect of insulin on plasma norepinephrine and 3,4-dihydroxyphenylalanine in obese men. Metabolism 38: 322-329, 1989
21. O'Rourke MF, Staessen JA, Vlachopoulos C, Duprez D, Plante GE: Clinical applications of arterial stiffness; definitions and reference values. Am J Hypertens 15: 426-444, 2002
22. Rosito GA, Massaro JM, Hoffmann U, Ruberg FL, Mahabadi AA, Vasan RS, O'Donnell CJ, Fox CS: Pericardial fat, visceral abdominal fat, cardiovascular disease risk factors, and vascular calcification in a community-based sample: the Framingham Heart Study. Circulation 117: 605-613, 2008
23. Sarin S, Wenger C, Marwaha A, Qureshi A, Go BD, Woomert CA, Clark K, Nassef LA, Shirani J: Clinical significance of epicardial fat measured using cardiac multislice computed tomography. Am J Cardiol 102: 767-771, 2008
24. Singhal A, Farooqi IS, Cole TJ, O'Rahilly S, Fewtrell M, Kattenhorn M, Lucas A, Deanfield J: Influence of leptin on arterial distensibility: a novel link between obesity and cardiovascular disease? Circulation 106: 1919-1924, 2002
25. Sutton-Tyrrell K, Newman A, Simonsick EM, Havlik R, Pahor M, Lakatta E, Spurgeon H, Vaitkevicius P: Aortic stiffness is associated with visceral adiposity in older adults
- 22 -
enrolled in the study of health, aging, and body composition. Hypertension 38: 429-433, 2001
26. Taguchi R, Takasu J, Itani Y, Yamamoto R, Yokoyama K, Watanabe S, Masuda Y: Pericardial fat accumulation in men as a risk factor for coronary artery disease. Atherosclerosis 157: 203-209, 2001
27. Tavora F, Kutys R, Li L, Ripple M, Fowler D, Burke A: Adventitial lymphocytic inflammation in human coronary arteries with intimal atherosclerosis. Cardiovasc Pathol 19: e61-68, 2010
28. ter Maaten JC, Bakker SJ, Serne EH, ter Wee PM, Donker AJ, Gans RO: Insulin's acute effects on glomerular filtration rate correlate with insulin sensitivity whereas insulin's acute effects on proximal tubular sodium reabsorption correlation with salt sensitivity in normal subjects. Nephrol Dial Transplant 14: 2357-2363, 1999
29. Wang YX, Fitch RM: Vascular stiffness: measurements, mechanisms and implications. Curr Vasc Pharmacol 2: 379-384, 2004
30. Willum-Hansen T, Staessen JA, Torp-Pedersen C, Rasmussen S, Thijs L, Ibsen H, Jeppesen J: Prognostic value of aortic pulse wave velocity as index of arterial stiffness in the general population. Circulation 113: 664-670, 2006
31. Yudkin JS, Stehouwer CD, Emeis JJ, Coppack SW: C-reactive protein in healthy subjects: associations with obesity, insulin resistance, and endothelial dysfunction: a potential role for cytokines originating from adipose tissue? Arterioscler Thromb Vasc Biol 19: 972-978, 1999
- 23 - - 국문요약 -
대동맥
혈관 경직도와 64 채널 다중 검출기 심장 전산화
단층
촬영에서 측정된 심외막 및 심장막주변 지방 조직과의
연관성
아주대학교 대학원의학과 순환기내과 최 태 영 (지도교수: 탁 승 제) 목적: 증가된 대동맥 혈관 경직도는 죽상경화증의 조기 표지자로 심혈관 사건의 위험인자로 알려져 있으며, 관동맥 석회화 (coronary artery calcium, CAC) 및 지방 조직은 각각 관동맥 죽상경화 및 체내 대사성 상태를 반영할 수 있는 것으로 알려져 있다. 본 논문에서는 대동맥 혈관 경직도와 심외막 (epicardial adipose tissue, EAT) 및 심장막주변 지방 (pericardial adipose tissue, PAT)과의 연관성을 CAC 정도와 관련하여 알아보고자 하였다.
방법: 흉통을 주소로 내원하여 64채널 다중 검출기 심장 전산화 촬영 (multi-detector cardiac computed tomography, MDCT) 및 경동맥-요골동맥 맥파 속도 (pulse wave velocity, PWV)을 측정한 111명 (남성 87명, 평균 연령 59±11세)의 환자를 대상으로 MDCT에서 EAT 및 흉곽내 지방 (thoracic adipose tissue, TAT)을 측정하였고 TAT에서 EAT을 감한 값을 PAT로 정의하였다.
결과: PWV은 EAT (r=0.46, p<.001) 및 PAT (r=0.41, p<.001)와 중등도 연관성을 보였고, CAC이 증가할수록 PWV도 증가하는 양상을 보였다. 일반적 심혈관 위험 인자를 보정했을 때, 최고 삼분위의 EAT (≥ 111 ml) 및 PAT (≥ 103 ml), CAC 100+에서 최고 삼분위의 PWV을 보일 상대 위험도는 각각 3.03 (95% 신뢰구간 [CI] 1.22-7.51, p=0.01), 2.34 (95%CI 1.10-4.90, p=0.02), 2.46 (95% CI 1.13-3.14, p=0.01) 이었으며, 최고 삼분위의 EAT, PAT에 CAC 100+을 조합하였을 때 그 상대 위험도는 더욱 증가하였다.
- 24 - 결론: 대동맥 혈관 경직도의 증가는 EAT, PAT 및 관동맥 죽상경화와 관련이 있으며, 특히 EAT는 CAC에 비하여 대동맥 혈관 경직도에 대한 높은 상대 위험도를 보였다. 이는 심장 주위로 분포된 지방이 대동맥 혈관 경직도 관련하여 중요한 역할을 담당할 수 있음을 제시한다. 핵심어: 혈관 경직도, 심외막 지방, 심장막주변 지방, 관동맥 죽상경화증, 심장 전산화 단층 촬영