Tackling Privacy Paradox : Protecting Right to Self-determination of
Personal Information by Estimating the Economic Value of Personal
Information and Visualizing the Price
Sejoon Lim
Hankuk University of Foreign Studies, Department of English Linguistics and Language
Technology, Korea
[email protected]
Abstract
The economic value of personal information has its importance as an objective measure of valuation in commercial, legal, and policy areas. Until recently, however, personal information subjects have not properly recognized the economic value of personal information, which has led to the inability to exercise the right to self-determination of personal information by unconsciously agreeing to the terms and conditions of personal information service without recognizing the value of personal information provided to the service provider when subscribing to a specific service. Therefore, we will examine the methodologies for calculating the economic value of personal information and the practical guarantee of the right to self-determination of personal information and analyze the economic value of personal information through a survey. Also, we would like to propose various ways for the subject of personal information with limited cognitive resources to visually accept the economic value of personal information required by the terms and conditions and suggest the optimal visualization of personal information economic value to exercise the right to self-determination of personal information. To do so, in this paper, we have conducted two survey experiments to estimate the economic value of personal information. Based on the price of personal information by category retrieved from surveys, we have visualized the price of personal information in various forms and asked respondents to choose the optimal infographic that best represents the value of personal information visually. As a result, we have proposed an optimal usage of the infographic to ‘nudge’ information subjects about their right to self-determination of personal information, therefore opening the possibility of diminishing privacy paradox.
Keywords: Economics of Privacy, Privacy Paradox, Personal Information Protection, Infographics
1. Introduction
Understanding the economic value of personal information is important in that it grants objective valuation criteria in commercial, legal, and policy areas. First of all, the economic value of personal information in the commercial domain plays a role in predicting the opportunity cost between the degree to which customers consider privacy protection important and the economic benefits from the use of personal information. In the legal domain, the economic value of personal information can be used to
IJIBC 21-2-30
Manuscript Received: April. 28, 2021 / Revised: May. 3, 2021 / Accepted: May. 7, 2021 Email: [email protected]
Tel: +82-10-7190-1146
assess the value of the victim's personal information in cases of personal information infringement, in conjunction with cases of personal information infringement. Finally, the economic value of personal information in the policy domain can be utilized for cost-benefit analysis when conflicts arise between policy goals and privacy. For example, the EU's 2018 Privacy Act, General Data Privacy Regulation (GDPR), provided enhanced measures for privacy, but at the same time increased social costs [1].
As shown above, the economic value of personal information is important as an objective valuation measure. Until recently, however, individual users are not fully aware of the economic value of personal information, which causes them to be unable to exercise practical privacy rights by subconsciously agreeing to the terms and conditions of privacy without being aware of the value of personal information provided to sign up. A case in point is that service providers generate profits by selling personal information to third parties by taking advantage of the user's mechanical consent. For example, in 2019, AT&T, a U.S. telecommunications company, made profits by selling users' location data to third parties by exploiting the terms and conditions of location tracking in case of an emergency.
The reason for this inability to exercise the right to self-determination of personal information is believed to be caused by users who have to accept a lot of information, such as terms and conditions, normatively agreeing to the terms and conditions within insufficient time.
Therefore, this study will examine the methodology of calculating the economic value of personal information and the prior study of the actual guarantee of personal information self-determination and analyze the economic value of personal information through a survey. In addition, it is intended to propose a variety of ways for private entities with limited cognitive resources to visually accept the economic value of personal information required by the Terms of Use and to present optimal privacy economic value visualization measures to exercise their right to self-determination.
2. Prior research and theoretical background
2.1 The Economic Value Analysis Methodology of Personal Information
As shown above, the economic value of personal information is not representative of non-market material that does not exist in the objective exchange price in the market, and there is no unified basis for calculating the value. Thus, several prior studies on the economic value analysis of personal information quantified the value of personal information based on various conditional value measurement methods. Conditional value measurement is an economic methodology that sets a hypothetical price for non-market goods that are not traded in the market and asks how much they are willing to pay to enjoy the utility of the resource or how much acceptance they can tolerate if it disappears. Conditional value measurement methods are divided into open questions, bid games, payment card methods, and bi-selective questions according to the survey method.
An open questioning method is a method of directly inquiring the economic value of personal information in a subjective form and asking the respondent's willingness to pay or accept. The survey method does not have an established value measure because respondents do not have experience in purchasing personal information, which may result in a high rate of non-response or abnormal outliers, reducing the reliability of the response. A bidding game is a way of presenting respondents with an arbitrary price for the economic value of personal information and repeating the process of raising or downplaying it to derive the final payment/acceptance of respondents. The survey method also has the disadvantage that respondents are unfamiliar with non-market materials called personal information and may be biased by relying on the initial amount presented.
economic value of their personal information divided into sections and allows respondents to choose one card that is appropriate for their payment/acceptance. While bias may be reduced by the initially proposed dependence on the amount of money raised in successive auction methods, there may be a question of at what intervals a certain range of prices will be offered. This leads to the problem that the respondent's willingness to pay or accept exists within the price interval presented by the card and that the price interval presented by the respondent may cause misunderstanding that the value of the non-market good is implied.
Finally, a bi-selective question is a survey method that presents the economic value of personal information to respondents at an already selected price, asks whether they will accept it in a yes or no format, and examines whether the amount of payment/acceptance is reflected. The binary choice question is again divided into a single binary choice question and a double binary choice question depending on the number of trials. Respondents will likely express their preferences as they are similar to the way market goods are purchased and sold, given that single-quantity-selective questions are already determined and determined based on notified prices. However, there is a disadvantage of requiring a fairly large sample to produce reliable results. The multi-quantity analysis type complements this is a survey method that asks two-quantity-selective questions multiple times to increase the estimation efficiency of a single-quantity-selective question. This approach could lead to more information on the amount of payment/acceptance from one respondent, which would increase statistical efficiency, but could be exposed to starting point convenience where subsequent questions would be influenced by the initial price. In addition, single and multi-quantity-selective question types commonly require consideration of what range and interval to initially offer prices to respondents, so an open survey in advance requires setting up the initial payment/acceptance price [2].
2.2 Reasons for Lack of Justification for the Right to Self-determination of Personal Information and Consent System
In a modern information society, the right to self-determination of personal information refers to the authority of the information subject to the self-control of personal information and is equivalent to the basic rights derived from the secrets and freedoms of human dignity and privacy specified in Articles 10 and 17 of the Constitution. In addition, the legal system that implements the right to self-determination of personal information originates from the consent system of the terms and conditions of personal information. Therefore, the legitimacy of the consent system is deeply related to the legitimacy of the right to self-determination of personal information.
For such a consent system to be justified, the premise that the entity can recognize and exercise its right to personal information must be met. However, in reality, the entity is not aware of sufficient information about the relationship between rights to personal information. Accordingly, the consent system is in a formal form, and at the same time, it functions as a formality for the easy collection and utilization of personal information by personal information processors. The reason why the consent system fails to serve as a tool for realizing personal information self-determination can be divided into cognitive and structural problems.
2.2.1 A Cognitive Problem
Cognitive problems refer to the inability of information entities to predict and determine the consequences of agreeing to the terms and conditions of personal information that lack understanding of personal information. This attitude is also relevant to the Privacy Paradox, which values one's privacy but does not implement active behavior for privacy protection [3]. According to a survey of 119 CMU students on this matter, 89.2% of the respondents said they were very or very concerned about personal
information. However, 87.5 percent of respondents who said they were very concerned about their personal information found that they subscribed to supermarket loyalty cards that benefit from providing personal information, suggesting that there was a mismatch in their attitude and behavior. This paradox of privacy leads to information subjects having limited rationality, relying on simplified estimation strategies and heuristics [4]. Thus, information entities tend to make distorted decisions while believing they can control and manage personal information.
2.2.2 A Structural Problem
A structural problem means that due to the complex system of the information society, the information entity cannot properly evaluate the costs and benefits of agreeing to the terms and conditions of personal information and cannot exercise its right to self-determination. In a modern information society, many personal information processors want to collect and utilize personal information, and it takes unreasonable time and effort for individual information entities to reasonably review the terms and conditions of personal information. According to a study conducted by CMU, the terms and conditions of personal information are 2,518 words, which takes about 10 minutes to read, and there are 1,462 terms and conditions faced by ordinary Internet users every year, and it takes a total of 538 billion hours to read. Furthermore, the cost of reading the terms and conditions of personal information was estimated to be approximately KRW 880 trillion, measured on a national basis. This suggests that consent to the terms and conditions of personal information is difficult to achieve based on a clear understanding [5].
In addition, even if the information subjects agreed to the terms and conditions of each personal information, the management of personal information is almost impossible as the information entity if the personal information is combined and analyzed. This makes it impossible for the information entity to assess and cost measure the possible risk of misuse of information caused by the combination of personal information, making it impossible to analyze the cost-benefit analysis under the consent of the privacy terms and conditions. This combination of personal information is a long-term problem, but it is difficult to analyze the cost-benefit of decision-making on privacy terms and conditions, while the benefits of consent are immediately expressed, causing information entities to prefer unconscious consent.
2.3 Behavioral Economics for Improving the Efficiency of Right for Personal Information Self-determination
Prior research has continued in the field of behavioral economics to encourage information subjects to recognize the contents of personal information terms and conditions and make reasonable choices. These prior studies have presented ways to effectively exercise the right to self-determination of personal information through various concepts in behavioral economics. In particular, measures to enhance the efficiency of personal information self-determination, such as terms and conditions wiki, dynamic mark, certification mark, and rating system, have been studied in advance by creating a natural situation as one of the concepts of behavioral economics. Currently, the certification mark system in Korea is utilized by granting ePRIVACY to websites that have passed the certification screening criteria under the Act on Promotion of Information and Communication Network Use and Information Protection Act.
Therefore, in this study, the economic value of personal information required by the terms and conditions of personal information is directly presented in the form of price, and it is proposed to enhance the efficiency of personal information self-determination. This is based on the numerical preference effect, which means that marketing science prioritizes the recognition and judgment of numerical information over other information, and the loss avoidance effect, which means bias in behavioral economics.
First, when visualizing and presenting the value of personal information in the form of price, information entities recognize the price of personal information consisting of numbers faster and more intuitively than the personal information terms and conditions of letters. This is expected to help information entities exercise their right to self-determination by identifying the value of personal information required by service providers more efficiently than existing privacy terms and conditions, with limited time and cognitive resources.
Second, if the value of personal information is visualized and presented in the form of a price, the value of personal information that the entity potentially has to give up when it agrees to the terms and conditions of personal information can be perceived more intuitively in quantitative monetary units. This could stimulate the loss avoidance of information subjects to reconsider whether they should agree to the terms and conditions of use of the service, even after abandoning the economic value of the personal information. That is, it is expected to improve the exercise of privacy self-determination by inducing cost-benefit analysis between the economic value of personal information and the use of services.
To study this, this work first surveyed to estimate the economic value of personal information. Based on the economic value of this estimated privacy, we present various price visualization methods and then select the most intuitive price visualization methods. Through this series of investigations, we would like to propose ways to enable the information entity to exercise its right to self-determination efficiently.
3. Estimating the Economic Value of Personal Information
The survey for estimating the economic value of personal information is based on a single-quantity selection method, which is divided into an open-question-based pre-survey and a single-quantity selection-based main survey. Through this, the entity intends to estimate the economic value of personal information for application to various methods of personal information price visualization.
3.1 Pre-survey
The preliminary investigation is based on open questioning methods to calculate the initial range of personal information acceptance amounts to be presented in this investigation. This is due to the fact that there is no appropriate starting point criterion for the price of personal information due to the nature of the single-quantity selection method-based survey to be conducted in this survey. Therefore, the economic value of personal information that respondents subjectively judge was questioned through open questioning methods to derive the initial presentation of this survey based on the results. Due to the nature of the open-ended questionnaire and the amount of acceptance of the purchase offer in the preliminary survey, the response including extreme value can be measured high, but the survey results set up an intensive de-extreme rule to exclude the response value of 1 or higher(μ± 1σ).
3.1.1 Pre-survey Design
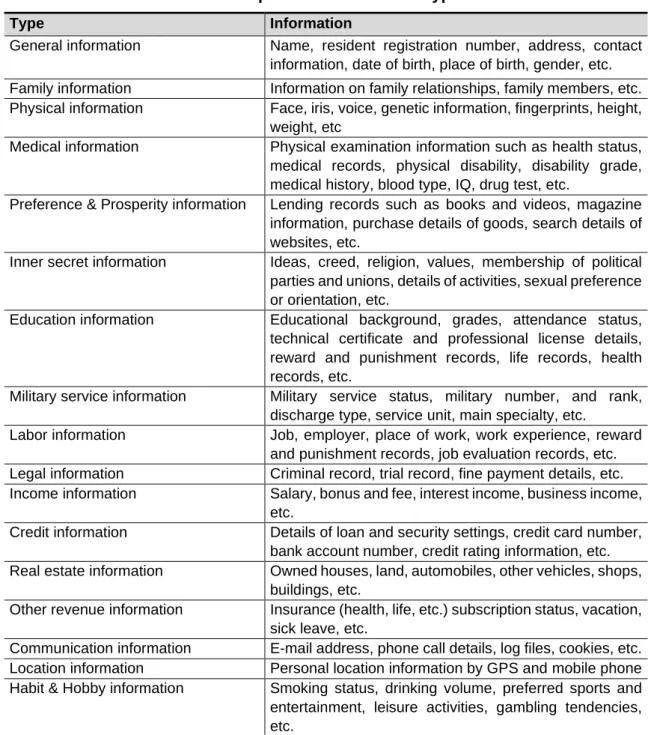
Based on the criteria suggested above, a preliminary survey surveyed the amount of personal information by type, and we have categorized personal information into a total of 17 types. Such categorization is referring to the personal information type table of the "Personal Information Protection Act Legal Manual" issued by the Korea Internet & Security Agency (KISA).
Table 1. KISA personal information type table
Type Information
General information Name, resident registration number, address, contact
information, date of birth, place of birth, gender, etc.
Family information Information on family relationships, family members, etc.
Physical information Face, iris, voice, genetic information, fingerprints, height,
weight, etc
Medical information Physical examination information such as health status,
medical records, physical disability, disability grade, medical history, blood type, IQ, drug test, etc.
Preference & Prosperity information Lending records such as books and videos, magazine
information, purchase details of goods, search details of websites, etc.
Inner secret information Ideas, creed, religion, values, membership of political
parties and unions, details of activities, sexual preference or orientation, etc.
Education information Educational background, grades, attendance status,
technical certificate and professional license details, reward and punishment records, life records, health records, etc.
Military service information Military service status, military number, and rank,
discharge type, service unit, main specialty, etc.
Labor information Job, employer, place of work, work experience, reward
and punishment records, job evaluation records, etc.
Legal information Criminal record, trial record, fine payment details, etc.
Income information Salary, bonus and fee, interest income, business income,
etc.
Credit information Details of loan and security settings, credit card number,
bank account number, credit rating information, etc.
Real estate information Owned houses, land, automobiles, other vehicles, shops,
buildings, etc.
Other revenue information Insurance (health, life, etc.) subscription status, vacation,
sick leave, etc.
Communication information E-mail address, phone call details, log files, cookies, etc.
Location information Personal location information by GPS and mobile phone
Habit & Hobby information Smoking status, drinking volume, preferred sports and
entertainment, leisure activities, gambling tendencies, etc.
The survey composition asked a company how much price it should offer to accept the transaction when purchasing respondents' personal information and asked 17 questions to subjectively write 17 acceptance amounts for each type of personal information. The survey was conducted on 50 adults in their 20s and 50s, of which 36 responses were analyzed, excluding extreme values and non-response. An overview of the pre-survey is shown in Table 2 below.
Table 2. Pre-survey outline Information
Survey period 2020. 9. 3
Content of survey Calculation of the range of initial offer of
the willingness to accept amount by type of personal information
Survey method Online survey(CAWI)
Number of responses 50 responses
The age range of responses
The 20s ~ 50s
Gender of respondents Male: 23 persons(46%)
Female: 27 persons(54%) Number of target samples Total of 36 samples
(Excluded extreme values and non-response samples)
3.1.2 Pre-survey Result
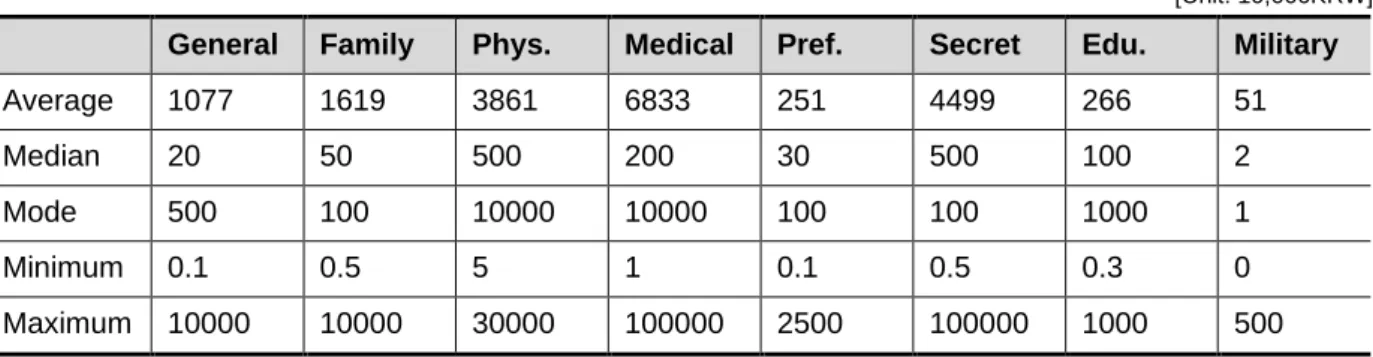
The preliminary survey showed that the range deviation between the minimum and maximum values was very large, depending on the 17 types of personal information. Based on these results, setting the lower and upper limits of the initial proposition to the minimum value of each type and the maximum value of each type could lead to an extreme initial proposition, thus establishing a range of initial proposition based on the frequency analysis of each amount according to the privacy type.
Accordingly, we set the lower bound of the initial solution to the minimum value of the most frequent value and set the upper bound to the lowest value of the maximum value of each type to prevent the extreme setting of the lower and upper bounds.
Table 3. Pre-survey result
General Family Phys. Medical Pref. Secret Edu. Military
Average 1077 1619 3861 6833 251 4499 266 51 Median 20 50 500 200 30 500 100 2 Mode 500 100 10000 10000 100 100 1000 1 Minimum 0.1 0.5 5 1 0.1 0.5 0.3 0 Maximum 10000 10000 30000 100000 2500 100000 1000 500 [Unit: 10,000KRW]
Labor Legal Credit Real estate
Other
income Income Credit Habit
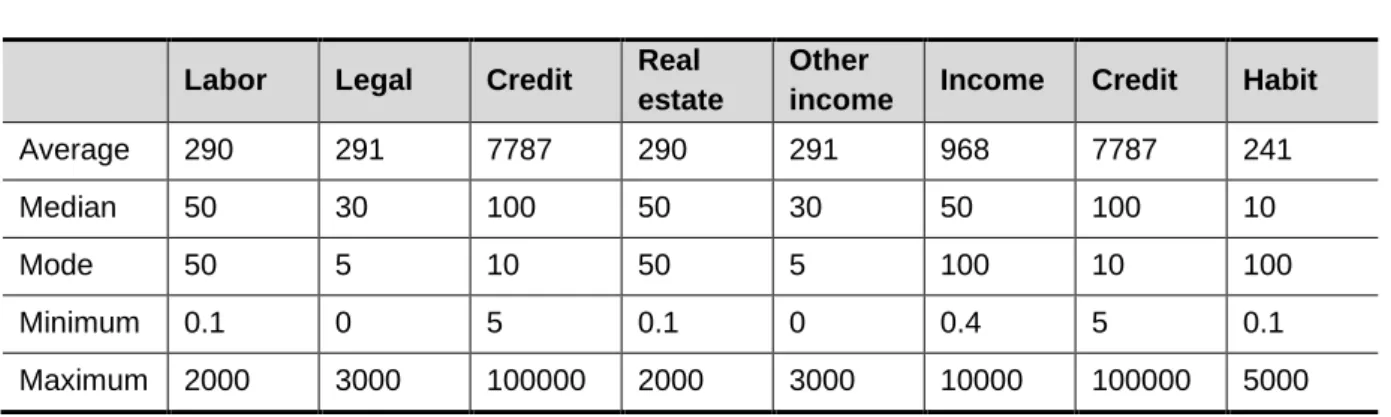
Average 290 291 7787 290 291 968 7787 241
Median 50 30 100 50 30 50 100 10
Mode 50 5 10 50 5 100 10 100
Minimum 0.1 0 5 0.1 0 0.4 5 0.1
Maximum 2000 3000 100000 2000 3000 10000 100000 5000
After setting the initial offer range between 5,000 won and 100 million won, it was divided into five sections again. Originally, the division of sections within the range of 18% to 82% was recommended (Song et al., 2014), but the method was chosen to divide into five sections by comprehensively considering the results of the preliminary survey and the difficulty of the survey.
There is also a question of whether to set the intervals of a total of five intervals to be equidistant or non-equivalent, but it seems to be divided into ways to reduce the convenience of conditional valuation methods according to individual studies. Therefore, in this survey, the section between KRW 10,000 and KRW 1 million, which shows the most frequent value according to the frequency of each amount, was set relatively narrow. The relatively narrowest interval is to prevent the overestimation of the acceptable amount by asking specifically. As a result of the preliminary investigation, the initial amount was set as shown in Table 4 below.
Table 4. Initial offer price by a group
Group #1 Group #2 Group #3 Group #4 Group #5
Initial
offer price 1 10 100 1000 10000
3.2 The Main Survey
This survey is based on a single-quantity method for estimating the economic value of personal information. Based on the single-quantity selection method, this survey is designed to provide initial presentation amounts for each of the 17 types of personal information and to respond only once in the form of yes or no. This means that a buyer of personal information asks whether they accept a particular price for personal information and estimates the value of the personal information according to the response. Single-quantity selection methods require relatively large samples for reliable results and have the disadvantage of the relatively complex quantitative analysis model. Nevertheless, the single-quantity selection method was chosen in that it compares and evaluates the prices initially quoted by the purchaser and the economic value of their personal information intuitively to determine the respondent's willingness to accept.
3.2.1 The Main Survey Design
Based on this, this survey surveyed whether they would accept the initial amount of personal information by type, and classified the types of personal information into 17 by referring to the Personal Information Protection Act Legal Manual issued by the Korea Internet & Security Agency (KISA). The survey configuration asked whether an entity would accept a transaction when it offered a specific price
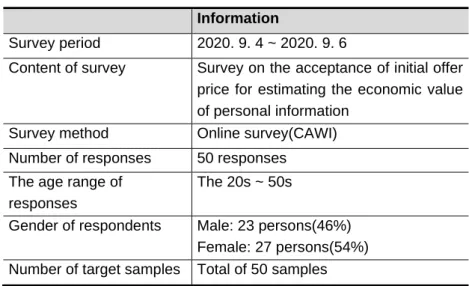
when it wanted to purchase respondents' personal information, and asked 17 questions to answer yes or no. The survey population was conducted by dividing 55 adults in their 20s and 50s into five groups, and the outline of this survey is as follows in Table 5.
Table 5. The main survey outline Information
Survey period 2020. 9. 4 ~ 2020. 9. 6
Content of survey Survey on the acceptance of initial offer
price for estimating the economic value of personal information
Survey method Online survey(CAWI)
Number of responses 50 responses
The age range of responses
The 20s ~ 50s
Gender of respondents Male: 23 persons(46%)
Female: 27 persons(54%) Number of target samples Total of 50 samples 3.2.2 The Main Survey Result
In this survey, we conducted a regression analysis using the utility difference function as an analytical model to estimate the acceptance value for each respondent. The acceptance of the offered price 𝑥 for α, one of the types of personal information, means that the benefits of accepting price 𝑥 by respondents are greater than or equal to those that do not. This suggests that respondents are willing to accept α even if it is offered a lower price than 𝑥, and that the value of the privacy type α translated into an economic value is less than or equal to 𝑥. Therefore, a maximum utility can be given if the prices presented match those acceptable to the respondent, and the utility difference function is an analytical model designed based on this.
The 17 types of personal information applied to the utility difference function model by regression of the underlying statistics of whether 50 individuals accept the initial amount presented are as follows.
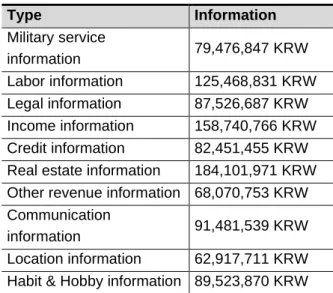
Table 6. Price willingness to accept by personal information type
Type Information
General information 134,282,125 KRW
Family information 155,823,578 KRW
Physical information 139,432,157 KRW
Medical information 104,198,095 KRW
Preference & Prosperity
information 134,282,125 KRW
Inner secret information 153,780,525 KRW
Type Information Military service information 79,476,847 KRW Labor information 125,468,831 KRW Legal information 87,526,687 KRW Income information 158,740,766 KRW Credit information 82,451,455 KRW
Real estate information 184,101,971 KRW
Other revenue information 68,070,753 KRW Communication
information 91,481,539 KRW
Location information 62,917,711 KRW
Habit & Hobby information 89,523,870 KRW
The amount of personal information received depends on the economic situation of the individual, the value of the type of personal information determined by the individual, and the degree of potential use, but the survey showed a high acceptance value, communication, real estate, and internal confidential information.
4. Selection of the Optimal Method of Visualizing the Price of Personal
Information for Enhancing the Right to Self-determination of Personal
Information
4.1 Visualization of Personal Information Pricing Through Various Infographics
Infographic is a visualization method of information that facilitates understanding of information by representing complex information consisting of numbers or writings in a graphical form. There are various types of infographics, and there are also many prior studies on how to classify them. In this work, we want to visualize the price of personal information based on the classification of infographics presented by the University of Arizona. In this study, the price information of personal information is intended to be visualized, and the following table shows how quantitative numerical information can be visualized [6].
Table 7. Types of an infographic for quantitative numerical information
Type Information
Bar Chart Visualization method for displaying quantitative information in
bars with height or length proportional to numerical values
Unit Visualization method of expressing numerical information with
graphics or images
Area-as-Quantity Visualization method for displaying information by indicating the
magnitude of the shape relative to the numerical value
Single Chart Visualization method in which the proportion of each part to the
Based on the classification method of the infographic presented above, four infographics were produced. The following are the drafts of the infographics, and the paper would like to select ways to improve the efficiency of personal information self-determination through a survey.
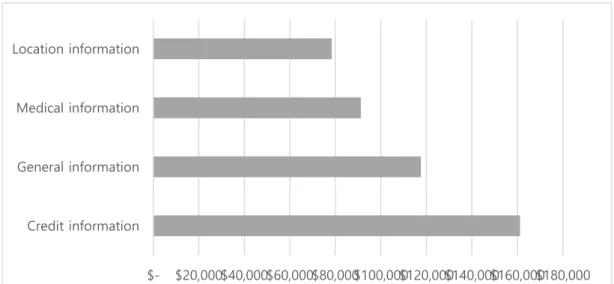
For the first infographic, we used a bar chart to visualize price information by category of personal information. Due to the characteristics of the bar chart, the price difference of personal information by category can be visually checked through the length of each bar. However, such a method has a critical drawdown in that it cannot visually represent the type of information using graphics or images, thus creating limitation invisibility.
Figure 1. Personal information price visualization infographic sample – Bar chart
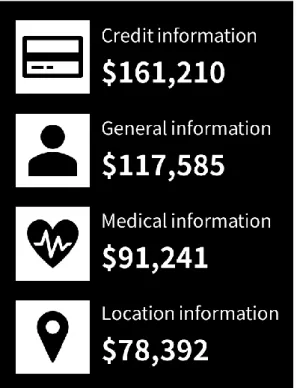
Figure 2. Personal information price visualization infographic sample – Unit
Secondly, we utilize an infographic class called units to visualize the privacy pricing data. A unit is an infographic that displays prices along with icons or images and has the advantage of having a
$- $20,000 $40,000 $60,000 $80,000 $100,000 $120,000 $140,000 $160,000 $180,000 Credit information
General information Medical information Location information
powerful visual effect. However, there is a disadvantage that the deviation between each privacy price is difficult to identify.
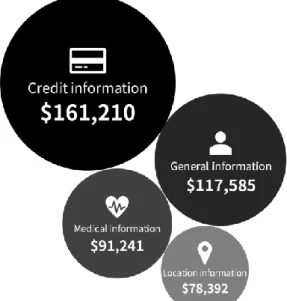
Area-as-quantity is a visualization method that maximizes the visualization effect by indicating the size or magnitude of the shape in accordance with the numeric value. We have created an area-as-quantity infographic based on the price of the personal information by category.
Figure 3. Personal information price visualization infographic sample – Area-as-quantity
Lastly, a single chart or so-called ‘donut chart’ is a variant of the pie chart which represents a portion of numeric value compared to the whole value. While single charts are known for vast use, it has a significant limitation in that it is difficult to compare different sections of a given chart.
Figure 4. Personal information price visualization infographic sample – Single chart 4.2 Optimal Infographic Selection Survey
help the information entity efficiently exercise its right to self-determination by recognizing the economic value of personal information that it gives up due to consent to the privacy terms and conditions.
4.2.1 Optimal Infographic Selection Survey Design
The questionnaire composition was asked in a multiple-choice format that selects one of the most visually superior infographics among the four infographics that visualized the price of each type of personal information. The survey was conducted on 50 adults in their 20s and 50s, and the overview of the optimal infographic selection survey is as follows in Table 8.
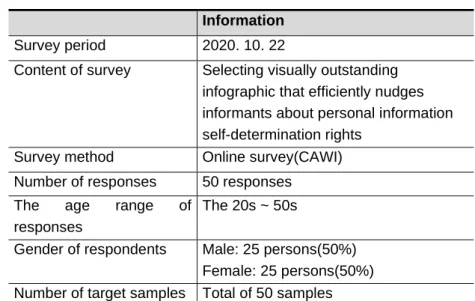
Table 8. The main survey outline Information
Survey period 2020. 10. 22
Content of survey Selecting visually outstanding
infographic that efficiently nudges informants about personal information self-determination rights
Survey method Online survey(CAWI)
Number of responses 50 responses
The age range of
responses
The 20s ~ 50s
Gender of respondents Male: 25 persons(50%)
Female: 25 persons(50%) Number of target samples Total of 50 samples
Table 9. Optimal infographic selection survey result
Bar Chart Unit Area-as-
Quantity
Single Chart
Selection 4(8%) 22(44%) 19(38%) 5(10%)
4.2.2 Optimal Infographic Selection Survey Result
Optimal infographic selection studies show that visualization methods of forms containing image information about quantitative regions (Area-as-quantity) or personal information (Units) have shown significantly higher preferences than traditional visualization methods such as bar charts or single charts. In particular, the type of personal information is implicit with explanation in the form of icons, and the preference of units, infographics with highly aligned price information, is the highest.
4.3 Proposal of an Infographic on the Best Price Visualization for Enhancing the Right to Self-determination of Personal Information
Figure 5. Optimal personal information price visualization infographic for improving personal information self-determination rights
To enhance the efficiency of personal information self-determination, we propose the following infographic as a result of estimating the economic value of personal information and selecting the optimal infographic among various infographics showing corresponding price information.
The infographic is a unit infographic that displays the type of personal information in the form of an icon to help the information subject visually understand the information required by the personal information terms and conditions he agrees with. In addition, the infographic is expected to enhance the efficiency of personal information self-determination by quickly visually recognizing the economic value of personal information that the entity gives up by agreeing to the terms and conditions.
4.4 Presentation on How to Use the Personal Information Price Visualization Infographic
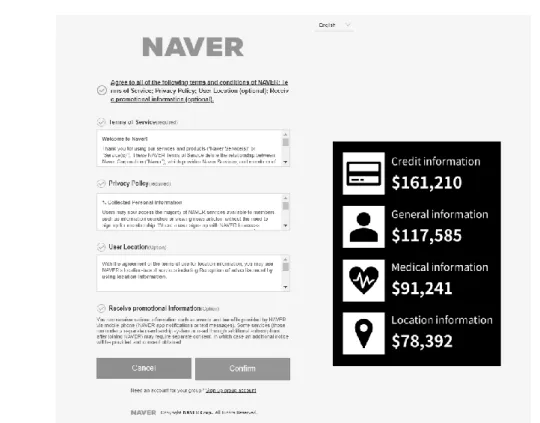
Such infographics can be useful in a way that when the information subject subscribes to a service through a particular website or app, the value of the personal information that the service requires is nudged to the user. For example, if a user encounters the terms and conditions of personal information when trying to subscribe to the Naver service through a website, a program can be produced in the form of a pop-up window to inform the economic value of personal information required by the personal information terms and conditions. Through these pop-ups, users can determine the economic opportunity costs that they will give up through joining Naver.
Figure 6. Examples of how to leverage personal information price visualization infographic
Thus, personal information price visualization infographics can be utilized in a way that allows users to perceive the value of their personal information to change the behavior of providing their personal information unconsciously.
4. Conclusion
Throughout the research, from calculating the price of personal information to visualizing the economic value of personal information, we have introduced a unique methodology to prevent information subjects from falling into the privacy paradox. While our work has presented a new way of using behavioral economics and heuristics to impact the decision-making process of information subjects, our work also has some important limitations. First, while we evaluated the economic value of personal information using the single-quantity method, the price willing to accept as an exchange for selling personal information widely varies from person to person. Such a problem can be identified at the pre-survey, where the difference between the minimum and maximum price of willingness to accept for general information marks 100,000 times. Also, there is a problem that privacy paradox may remain because even infographics can be considered as interrupting content for information subjects who are in a situation of agreeing to the terms and conditions of personal information. In sum, our proposal for utilizing the economic valuation of personal information and visualizing it as an infographic should be considered as pilot research for the resolution of privacy paradox phenomena.
References
[1] R. Layton, “The 10 Problems of the GDPR : The US can learn from the EU’s mistakes and leapfrog its policy,” United States Senate Committee on the Judiciary, 12-Mar-2019. Available:
https://www.judiciary.senate.gov/download/03/12/2019/layton-testimony
[2] H. E. Bae, E. Y. Lee, and H. I. Song, “A Study on the Economic Value Analysis of Personal Information Using CVM,” Internet & Security Focus, May 2014.
[3] Personal Information Protection Commission, Types of Personal Information. [Online]. Available: https://www.privacy.go.kr/nns/ntc/inf/personalInfo.do.
[4] Acquisti and J. Grossklags, “Privacy and rationality in individual decision making,” IEEE Security and Privacy Magazine, vol. 3, no. 1, pp. 26–33, 2005.
[5] A. Acquisti, L. Brandimarte, and G. Loewenstein, “Privacy and Human Behavior in the Information Age,” The Cambridge Handbook of Consumer Privacy, pp. 184–197.
[6] H. Purchase, K. Isaacs, T. Bueti, B. Hastings, A. Kassam, A. Kim, and S. van Hoesen, “A Classification of Infographics,” Diagrammatic Representation and Inference, pp. 210–218, 2018.
[7] A. Acquisti, “Nudging privacy: The behavioral economics of personal information,” IEEE Security & Privacy Magazine, vol. 7, no. 6, pp. 82–85, 2009.
[8] A. McDonald and L. Cranor, “The Cost of Reading Privacy Policies,” A Journal of Law and Policy for the Information Society, vol. 4, no. 3, pp. 543–568, 2008.
[9] G. B. Kwon, “A Study on the Scope of Personal Information and the Right to self-determination over Personal Information,” Public Law Journal, vol. 18, no. 3, pp. 199–224, 2017.
[10] H. J. Kim and J. Y. Rha, “An Exploratory Study on Consumer Privacy Paradox Experience: Grounded Theory Approach,” Family and Environment Research, vol. 55, no. 2, pp. 205–219, 2017.
[11] M. Lesk, “What Is Information Worth?,” IEEE Security & Privacy Magazine, vol. 9, no. 1, pp. 88–90, 2011. [12] S. B. Barnes, “A privacy paradox: Social networking in the United States,” First Monday, 2006.
[13] S. H. Han and S. C. Cho, “Study and Proposal for Practical Way of Privacy Self-Management Through Privacy Nudging,” The Journal of Korea Society of Internet Ethics, vol. 2, no. 2, pp. 115–120, 2018. [14] K. B. Min and J. M. Kang, “Rights to Control Information and Related Security Technologies on the
CyberSpace,” The Journal of the Institute of Internet, Broadcasting and Communication(JIIBC), vol. 10, no. 2, pp. 135–141, Apr. 2010.