저작자표시-비영리-변경금지 2.0 대한민국 이용자는 아래의 조건을 따르는 경우에 한하여 자유롭게 l 이 저작물을 복제, 배포, 전송, 전시, 공연 및 방송할 수 있습니다. 다음과 같은 조건을 따라야 합니다: l 귀하는, 이 저작물의 재이용이나 배포의 경우, 이 저작물에 적용된 이용허락조건 을 명확하게 나타내어야 합니다. l 저작권자로부터 별도의 허가를 받으면 이러한 조건들은 적용되지 않습니다. 저작권법에 따른 이용자의 권리는 위의 내용에 의하여 영향을 받지 않습니다. 이것은 이용허락규약(Legal Code)을 이해하기 쉽게 요약한 것입니다. Disclaimer 저작자표시. 귀하는 원저작자를 표시하여야 합니다. 비영리. 귀하는 이 저작물을 영리 목적으로 이용할 수 없습니다. 변경금지. 귀하는 이 저작물을 개작, 변형 또는 가공할 수 없습니다.
A Dissertation for the Degree of Doctor of Philosophy
Factors affecting flavor of dry-aged
beef and mechanism for the flavor
development
건식숙성 우육의 풍미 영향 인자 및
풍미 형성 기작 연구
August 2018
Department of Agricultural Biotechnology
Graduate School
Seoul National University
Hyun Jung Lee
Factors affecting flavor of dry-aged
beef and mechanism for the flavor
development
Advisor: Cheorun Jo, Ph.D
Submitting a Ph.D. Dissertation of Agriculture
June 2018
Department of Agricultural Biotechnology
Graduate School
Seoul National University
Hyun Jung Lee
Confirming the Ph.D. Dissertation written by
Hyun Jung Lee
건식숙성 우육의 풍미 영향 인자 및
풍미 형성 기작 연구
Factors affecting flavor of dry-aged beef and
mechanism for the flavor development
지도교수: 조철훈
이 논문을 농학박사 학위논문으로 제출함
2018년 6월
서울대학교 대학원
농생명공학부
이현정
이현정의 농학박사 학위논문을 인준함
2018년 7월
위 원 장 (인)
부위원장 (인)
위 원 (인)
위 원 (인)
위 원 (인)
i
Overall Summary
Aging improves tenderness, flavor, and juiciness of meat, especially beef. There are two commercial types of aging, dry and wet (vacuum). In recent years, dry-aged beef has obtained consumers’ interest from market due to its intense beefy/roasted flavor when compared to wet-aged one. However, the origin for the specific flavor of dry-aged beef and factors affecting its flavor are still unknown. Therefore, the objectives of this study were i) to investigate the factors affecting flavor of dry-aged beef, ii) to elucidate the mechanism for flavor development of dry-aged beef, and iii) to suggest optimal conditions for the application of dry aging process. The experiments were consisted of three different sections as follows:
Experiment I.
Role of moisture evaporation in the taste attributes of dry- and wet-aged beef determined by chemical and electronic tongue analyses
The role of moisture evaporation in the taste attributes of dry- and wet-aged beef was determined. A total of 30 sirloins (longissimus lumborum) were dry or wet aged for 28 days and analyzed for taste-active compounds (FAAs, IMP, and RS), moisture content, pH, and trimethylamine content, and an electronic tongue. The higher FAAs and RS and lower IMP contents were found in dry-aged beef, while a relatively higher taste of saltiness, sourness, and umami was detected than those in wet-aged one. Although moisture content was
ii
highly correlated with FAAs and RS in dry-aged beef (r2=-0.9 and -0.9, respectively), its amount was not proportionally decreased with the change in taste compounds. Meanwhile, dry-aged beef had approximately 2-3 folds higher trimethylamine content at day 28 (P<0.05), when compared to that in wet-aged one. Considering both moisture and trimethylamine contents in this study, the taste of dry-aged beef was mainly generated by the further proteolysis and IMP degradation with the growth of microorganisms on the crust and partially by the concentration effect on taste-active compounds from moisture evaporation.
Experiment II.
Effect of air flow velocity on microbial composition and sensory property in dry-aged beef
Twenty one beef rumps (middle gluteal) were dry aged for 28 days with different air flow velocities of 0, 2.5, and 5 m/s (Dry 0, Dry 2.5 and Dry 5, respectively) and the analyses of microbial composition, moisture content, pH, shear force, and flavor compounds (IMP, RS, FAAs, and FFAs) were conducted. The mold and yeast were not detected until day 14. However, the mold, Pilaira anomala, was dominated in Dry 0 at day 28, whereas Dry 2.5 and Dry 5 had the higher compositions of Debaryomyces hansenii when compared to that of Dry 0. The more Pseudomonas and Enterobacterium were found in Dry 0, while those in Dry 2.5 and Dry 5 had the higher compositions of Lactobacillus and Flavobacterium. The different compositions of P. anomala and D. hansenii may affect sensory property of dry-aged beef as
iii
most of the significant changes in physicochemical traits and flavor compounds were occurred between days 14 and 28, after the mold/yeast were observed on the crust.
Experiment III.
Role of P. anomala and D. hansenii in sensory property of dry-aged beef and their application for dry aging process
Two different experiments were designed in this study i) to determine the role of P. anomala and D. hansenii in sensory property of dry-aged beef and ii) to suggest their optimal conditions for the application of dry aging process. In the experiment i, a total of 24 beef sirloins (longissimus lumborum) were obtained and P. anomala or D. hansenii was inoculated onto each 12 sirloins. Then, all samples were dry aged for 28 days and analyzed for microbial growth, pH, shear force, ultrastructure, and flavor compounds (IMP, RS, FAAs, and FFAs). The inoculation of P. anomala and D. hansenii could influence sensory property of dry-aged beef as P. anomala had more impact on tenderness and lipolysis by its high proteolytic and lipolytic activity, whereas D. hansenii resulted in the higher amount of FAAs at day 28 (P<0.05). Also, both P. anomala and D. hansenii could be grown on the crust of dry-aged beef with a reliable numbers (6-8 log CFU/g), suggesting that their possible application for dry-aged beef. In the experiment ii, a total of 36 beef sirloins (longissimus lumborum) were obtained and each 12 sirloins inoculated with the combination of P. anomala and D. hansenii at the ratio of 1:1 or 4:1 (P1D1 or P4D1, respectively) and dry aged for 21 days. The
iv
analyses of shear force umami intensity, FAAs, and FFAs were conducted to select the test samples from each treatment, which had the best sensory property. The test samples were obtained from 15, 15, and 10 days for none-inoculated, P1D1, and P4D1 groups, respectively, for the preference and descriptive sensory analyses. As a result, there was no significant difference found in all sensory parameters tested (dry-aged aroma, flavor, tenderness, and overall acceptability). Therefore, it can be suggested that the combination of P. anomala and D. hansenii at the ratio of 4:1 can accelerate dry aging process at least 5 days without adverse effect on its sensory property.
Keyword: Dry-aged beef, Flavor, Moisture evaporation, Pilaira anomala,
Debaryomyces hansenii
v
Contents
Overall Summary ... i
Contents ... v
List of Tables ... x
List of Figures ... xiI List of Abbreviations ... xv
Chapter I. General introduction 1.1. Meat quality ... 1
1.1.1. Definition ... 1
1.1.2. Eating quality traits ... 2
1.1.3. Methods to improve eating quality traits ... 4
1.2. Aging ... 5
1.2.1. Definition ... 5
1.2.2. Aging methods ... 5
1.2.3. Flavor of dry-aged meat ... 6
Chapter II. Role of moisture evaporation in the taste attributes of dry-aged and wet-aged beef determined by chemical and electronic tongue analyses 2.1. Introduction ... 10
vi
2.2. Material and methods ... 13
2.2.1. Raw material and aging process. ... 13
2.2.2. Taste-active compounds ... 13 2.2.2.1. FAAs... 13 2.2.2.2. IMP and RS ... 14 2.2.3. Chemical traits ... 15 2.2.3.1. Moisture content ... 15 2.2.3.2. pH ... 15 2.2.3.2. TMA content ... 16 2.2.4. Electronic tongue... 16 2.2.5. Statistical analysis ... 17
2.3. Results and discussion ... 18
2.3.1. Taste-active compounds ... 18 2.3.1.1. FAAs... 18 2.3.1.2. IMP and RS ... 27 2.3.2. Chemical traits ... 31 2.3.2.1. Moisture content ... 31 2.3.2.2. pH ... 33 2.3.2.3. TMA content ... 35 2.3.3. Electronic tongue... 37 2.4. Conclusion ... 42 Chapter III.
vii
in dry-aged beef
3.1. Introduction ... 48
3.2. Material and methods ... 51
3.2.1. Raw material and aging process ... 51
3.2.2. Microbial analysis ... 51
3.2.2.1. Microbial isolation ... 51
3.2.2.2. Identification and pyrosequencing ... 52
3.2.3.Physicochemical traits ... 52 3.2.3.1. Moisture content ... 52 3.2.3.2. pH ... 52 3.2.3.3. Shear force... 53 3.2.4. Flavor compounds ... 53 3.2.4.1. FAAs... 53 3.2.4.2. IMP and RS ... 53 3.2.4.3. FFAs ... 54 3.2.5. Statistical analysis ... 55
3.3. Results and discussion ... 56
3.3.1. Microbial analysis ... 56
3.3.1.1. Mold and yeast composition ... 56
3.3.1.2. Bacterial composition ... 57
3.3.2.Physicochemical traits ... 62
3.3.2.1. Moisture content ... 62
3.3.2.2. pH ... 62
viii
3.3.3. Flavor compounds ... 66
3.3.3.1. Umami taste-related compounds and RS ... 66
3.3.3.2. FAAs... 69
3.3.3.3. FFAs ... 71
3.4. Conclusion ... 73
Chapter IV. Role of Pilaira anomala and Debaryomyces hansenii in flavor of dry-aged beef and their application for dry aging process 4.1. Introduction ... 78
4.2. Material and methods ... 82
4.2.1. Experiment I ... 82
4.2.1.1. Inoculum preparation ... 82
4.2.1.2. Raw material, inoculation, and aging process ... 82
4.2.1.3. Microbial analysis ... 83
4.2.1.4. Physicochemical traits ... 83
4.2.1.4.1. pH ... 83
4.2.1.4.2. Shear force and TEM ... 83
4.2.1.5. Flavor compounds ... 84 4.2.1.5.1. FAAs ... 84 4.2.1.5.2. IMP and RS ... 84 4.2.1.5.3. FFAs ... 84 4.2.1.6. Statistical analysis ... 84 4.2.2. Experiment II... 85
ix
4.2.2.1. Inoculum preparation ... 85
4.2.2.2. Raw material, inoculation, and aging process ... 85
4.2.2.3. Shear force... 86
4.2.2.4. Umami intensity, FAAs, and FFAs ... 86
4.2.2.5. Sensory analysis ... 86
4.2.2.6. Statistical analysis ... 87
4.3. Results and discussion ... 88
4.3.1. Experiment I ... 88
4.3.1.1. Microbial analysis ... 88
4.3.1.2. Physicochemical traits ... 90
4.3.1.2.1. pH ... 90
4.3.1.2.2. Shear force and TEM ... 93
4.3.1.3. Flavor compounds ... 97
4.3.1.3.1. Umami taste-related compounds and RS ... 97
4.3.1.3.2. FAAs ... 101
4.3.1.3.3. FFAs ... 104
4.3.2. Experiment II... 108
4.3.2.1. Shear force... 108
4.3.2.2. Umami intensity, FAAs, and FFAs ... 111
4.3.2.3. Sensory analysis ... 114
4.4. Conclusion ... 117
Chapter V. Overall conclusion... 122
x
List of Tables
Chapter I.
Table 1. Classification of meat quality ... 1 Table 2. Methods to improve eating quality traits during postmortem storage ... 4 Table 3. Comparison on the quality of dry- and wet-aged meat ... 6
Chapter II.
Table 4. Free amino acids content (mg/100 g) of beef sirloin aged with different aging methods during 28 days ... 22 Table 5. Inosine 5´-monophosphate (mg/100 g) and reducing sugar contents (mM) of beef sirloin aged with different aging methods during 28 days ... 29 Table 6. Comparison on the taste attributes of dry- and wet-aged beef by chemical and electronic tongue analyses during aging period ... 41
Chapter III.
Table 7. Differences in physicochemical traits and flavor compounds of beef rump dry aged for 28 days with different air flow velocities ... 60 Table 8. Physicochemical traits [moisture (%), pH, and shear force (N)] of beef rump dry aged for 28 days with different air flow velocities ... 65 Table 9. Umami taste-related compounds (mg/100 g) and reducing sugar (mM) of beef rump dry aged for 28 days with different air flow velocities ... 68 Table 10. free amino acids content (mg/100 g) of beef rump dry aged for 28
xi
days with different air flow velocities ... 70 Table 11. Free fatty acids content (mg/g) of beef rump dry aged for 28 days with different air flow velocities ... 72
Chapter IV.
Table 12. pH of beef sirloin inoculated with P. anomola or D. hansenii and dry aged for 28 days ... 92 Table 13. Shear force (N) of beef sirloin inoculated with P. anomola or D. hansenii and dry aged for 28 days ... 95 Table 14. Umami taste-related compounds (mg/100 g) and reducing sugar contents (mM) of beef sirloin inoculated with P. anomola or D. hansenii and dry aged for 28 days ... 100 Table 15. Free amino acids content (mg/100 g) of beef sirloin inoculated with P. anomola or D. hansenii and dry aged for 28 days ... 103 Table 16. Free fatty acids content (mg/g) of beef sirloin inoculated with P. anomola or D. hansenii and dry aged for 28 days ... 105 Table 17. Shear force (N) of beef sirloin inoculated with the different combinational ratios of P. anomola and D. hansenii and dry aged for 21 days . 109 Table 18. Umami intensity, free amino acids (mg/100 g), and free fatty acids (mg/g) of beef sirloin inoculated with the different combinational ratios of P. anomola and D. hansenii and dry aged for 21 days ... 112 Table 19. Appropriate time of dry aging process for each trait of beef sirloin inoculated with the different combinational ratios of P. anomola and D. hansenii and dry aged for 21 days ... 115
xii
List of Figures
Chapter I.
Figure 1. Flavor development of meat and meat products ... 3
Chapter II.
Figure 2. Change in total free amino acids content (mg/100 g) in dry- and wet-aged beef with the different aging periods ... 25 Figure 3. Correlation coefficient (r2) between moisture and total free amino acids content in dry- and wet-aged beef ... 26 Figure 4. Correlation coefficient (r2) between moisture and reducing sugar content in dry- and wet-aged beef ... 30 Figure 5. Moisture content (%) of beef sirloin aged with different aging methods after 28 days ... 32 Figure 6. pH of beef sirloin aged with different agings methods after 28 days ... 34 Figure 7. Trimethylamine content (area peak) of beef sirloin aged with different aging methods after 28 days ... 36 Figure 8. Pattern discrimination index (%) of beef sirloin aged with different aging methods during 28 days by an electronic tongue analysis... 39 Figure 9. Spider plot for taste attributes of beef sirloin dry or wet aged during 28 days by an electronic tongue analysis ... 40
xiii
Figure 10. Different appearance of mold/yeast on upper, front, and rear sides of the crust of beef sirloin after 28 days of dry aging process ... 50 Figure 11. The compositions (%) of mold/yeast and bacteria isolated from the crust of beef rump dry aged for 28 days with different air flow velocities ... 59
Chapter IV.
Figure 12. Activities of proteolysis and lipolysis of P. anomola and D. hansenii isolated from the crust of dry-aged beef determined by 3% skim milk and tributyrin agar, respectively ... 80 Figure 13. The mold or yeast counts (log CFU/g) of the crust of beef sirloin inoculated with P. anomola or D. hansenii and dry aged for 28 days ... 88 Figure 14. The amounts of aflatoxin B1, B2, G1, and G2 (μg/kg) produced by P. anomola ... 89 Figure 15. The ultrastructure of beef sirloin inoculated with P. anomola or D. hansenii after 28 days of dry aging process ... 96 Figure 16. Total change in free fatty acids content (mg/g) of beef sirloin inoculated with P. anomola or D. hansenii and dry aged for 28 days ... 107 Figure 17. Shear force (N) of beef sirloin inoculated with the different combinational ratios of P. anomola and D. hansenii and dry aged for 15 (None), 10 (P1D1), and 10 days (P4D1), respectively ... 110 Figure 18. The amounts of IMP (mg/100 g) and acid (mg/100 g) in beef sirloin inoculated the different combinational ratios of P. anomola and D. hansenii and dry aged for 15 (None), 15 (P1D1), and 10 days (P4D1), respectively ... 113
xiv
Figure 19. The preference and descriptive sensory analyses of beef sirloin inoculated with the different combinational ratios of P. anomola and D. hansenii and dry aged for 15 (None), 15 (P1D1), and 10 days (P4D1), respectively ... 116
xv
List of Abbreviations
CFU : Colony forming unit
CIE : International Commission on Illumination
DW : Distilled water
DDW : Deionized distilled water
FAAs : Free amino acids
FFAs : Free fatty acids
GC : Gas chromatography
HPLC : High performance liquid chromatography
IMP : Inosine 5´-monophosphate
NMR : Nuclear magnetic resonance
PBS : Phosphate buffered saline
PCR : Polymerase chain reaction
PDA : Potato dextrose agar
RH : Relative humidity
RS : Reducing sugar
SCB : Sodium cacodylate buffer
TEM : Transmission electron microscopy
TMA : Trimethylamine
TSA : Tryptic soy agar
TSP : 3-(trimethylsilyl)-propionate
1
Chapter I.
General introduction
1.1. Meat quality
1.1.1. Definition
Meat quality is defined as ‘the totality of features and characteristics of a product or service that bear on its ability to satisfy stated or implied needs’ (Becker, 2000). It can be categorized as appearance, eating, and reliance quality traits affecting consumers’ preference for meat and meat products (Joo, 2005; Troy and Kerry, 2010) (Table. 1).
Table 1. Classification of meat quality
Traits
Appearance quality
Meat color Drip and purge Texture and firmness Marbling Eating quality Tenderness Flavor Juiciness Reliance quality Safety Nutrition
Animal welfare and ethics
2
1.1.2. Eating quality traits
Among the meat quality, eating quality traits which indicate tenderness, flavor, and juiciness can influence the consumers’ purchasing decision in market (Troy and Kerry, 2010). Tenderness is considered as the most important eating quality traits for meat (Destefanis et al., 2008). However, when tenderness is achieved acceptance level (tender, less than 42.87 N of Warner–Bratzler shear force), flavor becomes more important.
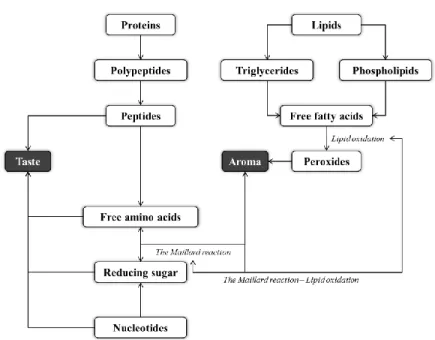
Flavor includes the sensations of taste and aroma (Lee et al., 2015). In general, raw meat has bloody-, metallic-, and salt-like taste with no or little aroma (Jayasena et al., 2013a; 2013b). During cooking, flavor compounds, such as IMP, RS, FAAs, and FFAs, in raw meat develop flavor through the Maillard reaction, lipid oxidation, and their interaction (Dashdorj et al., 2015; Toldra et al., 1998) (Fig. 1).
The flavor compounds can be divided into water- and lipid-soluble compounds (Mottram, 1998). IMP, RS, and FAAs are referred as the water-soluble compounds which can affect 5 different basic tastes: sweet (e.g. glucose, fructose, ribose, alanine, asparagine, glutamine, glycine, lysine, methionine, proline, serine, and threonine), sour (e.g. aspartic and glutamic acids), salt (e.g. the sodium salts from aspartic and glutamic acids), bitter (e.g. arginine, asparagine, glutamine, histidine, isoleucine, leucine, lysine, methionine, phenylalanine, tryptophane, tyrosine, and valine), and umami taste (e.g. IMP with aspartic and glutamic acids) (Dashdorj et al., 2015; Shahidi, 1994). The FFAs are the lipid-soluble compounds and generate aroma volatiles in meat and meat products as well as the Maillard reaction
3
resultants between RS and FAAs (Fig. 1). Such flavor compounds could be produced by endogenous enzymes mostly found in animal muscle (Toldra, 2006; Toldra et al., 1997; 1998) and/or microorganisms (Flores and Toldra, 2011).
Figure 1. Flavor development of meat and meat products (modified from Dashdorj et al., 2015; Toldra et al., 1998).
In addition, thiamin (vitamin B1) and minerals (e.g. Na, Mg, P, Cl, K, and Ca) can affect flavor of meat and meat products (Dashdorj et al., 2015). The thermal degradation of thiamin increased meat-like and roasted flavor, whereas minerals are related to bitter taste. Also, the amounts of myoglobin and iron influence undesirable changes in meat flavor (liver-like and/or warmed over) as both components promote lipid oxidation (Calkins and Hodgen, 2007; Faustman et al., 2010).
4
1.1.3. Methods to improve eating quality traits
During postmortem storage, there have been a lot of methods to improve eating quality traits of meat, especially tenderness and flavor (Joo, 2005). At pre-rigor state, electrical stimulation could be used to prevent cold shortening by the acceleration of anaerobic glycolysis, whereas the application of tender stretch (aitch-bone hanging) and tendercut (cutting bones and connective tissues at two positions in the mid loin and the sir loin junction) limit cold shortening by the physical stretching. Hydrodynamic pressure, high hydrostatic pressure, ultrasound, and tight-wrapping also promote meat tenderization at post-rigor state as well as marination/injection and aging. However, most of these methods improve tenderness only, except for marination/injection and aging (Table 2).
Table 2. Methods to improve eating quality traits during postmortem
Methods Improvements
Pre-rigor state
Electrical stimulation ▲ Tenderness
Tender stretch ▲ Tenderness
Tendercut ▲ Tenderness
Post-rigor state
Hydrodynamic pressure ▲ Tenderness
High hydrostatic pressure ▲ Tenderness
Ultrasound ▲Tenderness
Tight-wrapping ▲Tenderness
Marination/injection ▲Tenderness and flavor
Aging ▲Tenderness and flavor
5
1.2. Aging
1.2.1. Definition
Aging can be defined as raw meat stored for a certain time to improve its eating quality traits (Khan et al., 2016; Lee et al., 2017). This method is simple but effective as there are no additional processing step and material required for its manufacture. It can improve both tenderness and flavor of meat (Table 2) as it induces meat tenderization by several proteolytic enzymes (e.g. calpains, cathepsins, proteasome, and caspase) and changes the generation of flavor compounds in raw meat (Huff-Lonergan et al., 2010; Ouali et al., 2006; Toldra et al., 1997).
1.2.2. Aging methods
There are two different aging methods classified as dry and wet aging, mainly depending on the presence of vacuum packaging (Khan et al., 2016). During aging period, dry aging exposes raw meat to outside in a controlled condition (temperature, RH, and air flow velocity) without vacuum packaging, while wet aging stores meat in vacuumed-pack. Dry aging is the traditional aging method used prior to the introduction of vacuum packaging. However, market value of dry-aged beef was decreased since 1980’s due to its low efficiency in processing and reduced salable yield (Dashdorj et al., 2016). However, in recent years, the consumers’ demand for dry-aged beef has been increasing with a premium market value by its characteristic concentrated flavor (beefy and roasted), which is absent in wet-aged beef (Khan et al., 2016; Lee et al., 2018) (Table 3). In addition, dry aging can decrease negative
6
bloody/serumy and metallic flavor of meat (Campbell et al., 2001; Warren and Kastner, 1992).
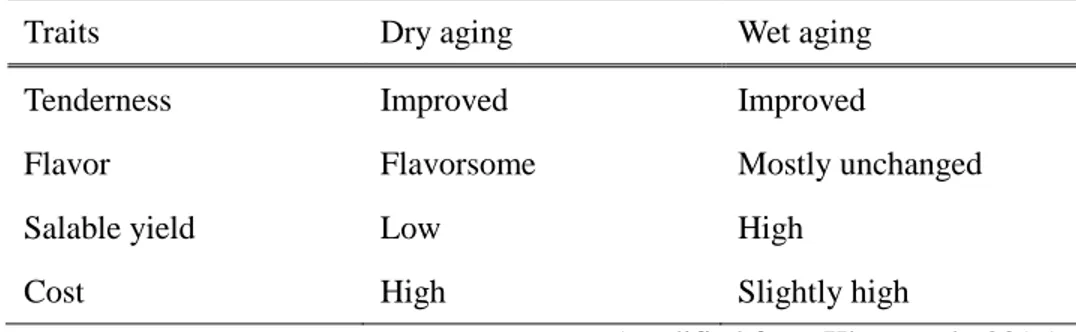
Table 3. Comparison on quality of dry- and wet-aged meat
Traits Dry aging Wet aging
Tenderness Improved Improved
Flavor Flavorsome Mostly unchanged
Salable yield Low High
Cost High Slightly high
(modified from Khan et al., 2016)
1.2.3. Flavor of dry-aged meat
Although there have been a lot of attempts to elucidate flavor of dry-aged meat, its development mechanism and affecting factors are not clearly established until now. The moisture evaporation and/or higher proteolysis in dry-aged beef are suggested as the main contributors (Kim et al., 2016; Lee et al., 2017). However, the scientific evidences for these factors are hardly found and limited comparison on the flavor compounds between dry- and wet-aged beef are provided. For this reason, the objective of this study was conducted to investigate factors affecting flavor of dry-aged beef and mechanism for the flavor development during dry aging process.
7
References
Becker, T. (2000). Consumer perception of fresh meat quality: A framework for analysis. British Food Journal, 102, 158-176.
Calkins, C. R., & Hodgen, J. M. (2007). A fresh look at meat flavor. Meat Science, 77, 63-80.
Campbell, R. E., Hunt, M. C., Levis, P., & Chambers IV, E. (2001). Dry-aging effects on palatability of beef longissimus muscle. Journal of Food Science, 66, 196-199.
Dashdorj, D., Amna, T., & Hwang I. (2015). Influence of specific taste-active components on meat flavor as affected by intrinsic and extrinsic factors: an overview. European Food Research and Technology, 241, 157-171. Destefanis, G., Brugiapaglia, A., Barge, M. T., Dal Molin, E. (2008).
Relationship between beef consumer tenderness perception and Warner-Bratzler shear force. Meat Science, 78, 153-156.
Faustman, C., Sun, Q., Mancini, R., & Suman, S. P. (2010). Myoglobin and lipid oxidation interactions: Mechanistic bases and control. Meat Science, 86, 86-94.
Flores, M., & Toldra, F. (2011). Microbial enzymatic activities for improved fermented meats. Trends in Food Science and Technology, 22, 81-90.
Huff-Loneran, E., Zhang, W., & Lonergan, S. M. (2010). Biochemistry of postmortem muscle - Lessons on mechanisms of meat tenderization. Meat Science, 86, 184-195.
8
of chicken meat: A review. Asian-Australasian Journal of Animal Sciences, 26, 732-742.
Jayasena, D. D., Ahn, D. U., Nam, K. C., & Jo, C. (2013b) Factors affecting cooked chicken meat flavour: A review. World's Poultry Science Journal, 69, 515-526.
Joo, S. T. (2005). Control of meat quality. Kerala: Research Signpost, (Chapters 1 and 4).
Khan, M. I., Jung, S., Nam, K. C., & Jo, C. (2016). Postmortem aging of beef with a special reference to the dry aging. Korean Journal for Food Science of Animal Resources 36, 160-170.
Kim, Y. H. B., Kempa, R., & Samuelsson, L. M. (2016). Effects of dry-aging on meat quality attributes and metabolite profiles of beef loins. Meat Science, 111, 168-176.
Lee, H. J., Choe, J., Kim, K. T., Oh, J., Lee, D. G., Kwon, K. M., Choi, Y. I., & Jo, C. (2017). Analysis of low-marbled Hanwoo cow meat aged with different dry-aging methods. Asian-Australasian Journal of Animal Sciences, 30, 1733-1738.
Lee, H. J., Choe, J., Yoon, J. W., Kim, S., Oh, H., Yoon, Y., & Jo, C. (2018). Determination of salable shelf-life for wrap-packaged dry-aged beef during cold storage. Korean Journal for Food Science of Animal Resources, 38, 251-258.
9
Assessment of breed- and sex-based variation in flavor-related compounds of duck meat in Korea. Korean Journal of Poultry Science, 42, 41-50.
Mottram, D. S. (1998). Flavour formation in meat and meat: A review. Food Chemistry, 62, 415-424.
Ouali, A., Herrera-Mendez, C. H., Coulis, G., Becila, S., Boudjellal, A., Aubry, L., & Sentandreu, M. A. (2006). Revisiting the conversion of muscle into meat and the underlying mechanisms. Meat Science, 74, 44-58.
Shahidi, F. (1994). Flavor of meat and meat products. New York: Springer, (Chapter 2).
Toldra, F. (1998). Proteolysis and lipolysis in flavour development of dry-cured meat products. Meat Science, 49, S101-S110.
Toldra, F., Flores, M., & Sanz, Y. (1997). Dry-cured ham flavor: Enzymatic generation and process influence. Food Chemistry, 59, 523-530.
Toldra, F. (2006). The role of muscle enzymes in dry-cured meat products with different drying conditions. Trends in Food Science and Technology, 17, 164-168.
Troy, D. J., & Kerry, J. P. (2010). Consumer perception and the role of science in the meat industry. Meat Science, 86, 214-226.
Warren, K. E., & Kastner, C. L. (1992). A comparison of dry‐aged and vacuum‐aged beef strip loins. Journal of Muscle Foods, 3, 151-157.
10
Chapter II.
Role of moisture evaporation in the taste
attributes of dry- and wet-aged beef determined
by chemical and electronic tongue analyses
2.1. Introduction
The definition of aging is storing meat for a certain period of time to improve eating quality attributes, including tenderness, flavor, and juiciness, of meat (Lee et al., 2017; Oh et al., 2017). In general, aging can be divided into two different methods: dry and wet aging. Dry aging exposes raw meat to ambient condition under the controlled temperature, RH, and air flow velocity during aging period. In contrast, wet aging stores meat in vacuum packaging at a designated temperature. Dry aging is the traditional aging method of meat. However, during dry aging process, the surface of dry-aged beef (called ‘crust’) is dried and hardened by moisture evaporation and becomes un-usable. Therefore, the crust should be trimmed off before the consumption, resulting in a very low salable yield of dry-aged beef followed by considerable economical loss (Khan et al., 2016). Due to this disadvantage, most of dry aging had been replaced with wet aging after the vacuum packaging became
11
available (Lee et al., 2018). In recent years, however, the demands for dry-aged beef have been increased due to its specific flavor (Dashdorj et al., 2016).
The flavor of dry-aged beef has been studied for years. There are conflicting results in flavor differences between dry- and wet-aged beef; however, most studies agreed that dry-aged beef had more intense beefy and roasted flavor (Campbell et al., 2001; Kim et al., 2016; Warren and Kastner, 1992). Khan et al. (2016) also indicated that flavor of dry-aged beef is flavorsome, while wet aging does not improve its flavor during the aging process. Besides, dry aging could also decrease negative bloody/serumy and metallic flavor of meat (Campbell et al., 2001; Warren and Kastner, 1992). Taken together, dry aging could produce meat with better flavor than wet aging; however, the flavor development of dry-aged beef and affecting factors are still unknown.
According to previous studies, the concentrated taste compounds, especially FAAs, of dry-aged beef are considered as the main contributor to its flavor (Kim et al., 2016; Lee et al., 2017). Kim et al. (2016) compared several FAAs components of dry- and wet-aged beef and found more abundant FAAs content in dry-aged beef (e.g. glutamic acid, isoleucine, leucine, phenylalanine, tryptophan, tyrosine, and valine). This phenomenon could be related to the moisture evaporation (Kim et al., 2016), which is a typical result of dry aging process by the exposure of meat to ambient condition (Dashdorj et al., 2016; Khan et al., 2016). In addition, Kim et al. (2016) suggested a relatively higher rate of proteolysis as another contributor
12
to FAAs contents in dry-aged beef in comparison to wet-aged beef (Koutsidis et al., 2008a; 2008b). However, the scientific evidences for the effects of moisture evaporation and/or higher proteolysis on the flavor development of dry-aged beef are limited. In addition, the changes in other important taste-active compounds, such as IMP and RS, and its effect on the taste attributes of dry-aged beef have not been clearly reported. Therefore, in this study, the taste attributes of dry- and wet-aged beef were compared by chemical and electronic tongue analyses to determine the role of moisture evaporation in the flavor of dry-aged beef.
13
2.2. Material and methods
2.2.1. Raw material and aging process
A total of 30 sirloins (longissimus lumborum) from both sides of 15 different beef carcasses (Holstein steer, quality grade 3) were obtained from a local slaughterhouse and transferred to a meat processing plant (Seoul, Korea). The initial pH of all samples (5.51±0.01) was measured prior to the aging process. The sirloins from the same sides of different carcass were randomly arranged for each dry- and aged group. Before the aging process, the wet-aged group was vacuum-packwet-aged (HFV-600L, Hankook Fujee Co., Ltd., Siheung, Korea) with a low density polyethylene/nylon bag (oxygen permeability of 22.5 mL/m2/24 h atm at 60% RH/ 25°C and water vapor
permeability of 4.7 g/m2/24 h at 100% RH/25°C). Both groups were aged for
0, 7, 14, 21, and 28 days under different conditions (dry aging at 4°C, 75% RH, and 2.5 m/s air flow velocity or wet aging at 4°C after the vacuum-packaging). At the sampling stage, the crust of dry-aged beef was trimmed off and both dry- and wet-aged samples were vacuum-packaged (HFV-600L, Hankook Fujee Co., Ltd.) and stored at -70°C until the analyses.
2.2.2. Taste-active compounds
2.2.2.1. FAAs
14
(2005) and injected into the HPLC system (Ultimate 3000, Thermo Fisher Scientific Inc., Waltham, MA, USA) with pre-column derivatization. The analytical conditions were as follows: mobile phase, 40 mM sodium phosphate dibasic buffer (pH 7.8) and DW/acetonitrile/methanol (10:45:45, v/v); flow rate and time, 1.5 mL/min for 35 min; column, VDSpher 100 C18-E (4.6×150 mm2, 3.5 μm particles, VDS optilab Chromatographie Technik GmbH, Berlin, Germany); and detector, UV/Vis detector at 266 and 340 nm. The standard (Agilent technologies, Santa Clara, CA, USA) was used to generate a standard curve for calculation of the peak area.
2.2.2.2. IMP and RS
IMP was extracted from both dry- and wet-aged samples based on the method of Lee et al. (2017).The extract was filtered through a membrane filter (0.2 μm; Whatman PLC., Kent, UK) into a glass vial and injected into the HPLC system (Ultimate 3000, Thermo Fisher Scientific Inc.). The analytical conditions were as follows: injection volume, 10 μL; mobile phase, 20 mM potassium phosphate monobasic (pH 5.5); flow rate and time, 1.0 mL/min for 25 min; column, Synergi Hydro-RP (250×4.6 mm2, 4 μm particles; Phenomenex Inc., Seoul, Korea) at 30°C; and detector, UV/Vis detector at 254 nm. The peak area was calculated from a standard curve obtained using a standard IMP (Sigma-Aldrich, St. Louis, MO, USA).
RS was obtained from the samples by the method of Jayasena et al. (2015). Each extract was dissolved with DDW (1 mL) and added to 2 mL of
15
dinitrosalicylic solution (0.5 g of dinitrosalicylic acid, 8.0 g of sodium hydroxide, and 150 g of rochelle salt in 500 mL of DDW) in a 15-mL test tube and heated at 90°C for 10 min. The mixture was cooled under running water and its absorbance was measured at 550 nm (X-ma 3100, Human Co., Ltd., Seoul, Korea). The amount of RS was calculated using a standard curve developed with glucose (Sigma-Aldrich).
2.2.3. Chemical traits
2.2.3.1. Moisture content
Moisture content of dry- and wet-aged beef was analyzed using the dry oven method (Lee et al., 2016) with a few modifications. The weight of ground meat (5 g) was measured before and after the drying process in a dry oven at 110°C for 16 h (DS-520L, Daewon, Gyeonggido, Korea). Moisture content was expressed as the ratio of weight from the samples before and after the drying process.
Moisture content (%) =(Weight before drying − Weight after drying)
Weight before aging × 100
2.2.3.2. pH
Meat samples (1 g) were homogenized with DDW (9 mL) at Lv. 6 for 30 s (T10 basic, Ika Works, Staufen, Germany). The homogenates were
16
centrifuged at 2,265 ×g for 10 min (Continent 512R, Hanil Co., Ltd., Incheon, Korea) and filtered (Whatman No. 4, Whatman PLC., Kent, UK) to obtain the supernatants. The pH of the supernatants was measured by a pH meter (SevenGo, Mettler-Toledo Inti., Inc., Schwerzenbach, Switzerland). Prior to the measurement, the pH meter was calibrated with the standard buffers at 4.01, 7.00, and 9.21 (Mettler-Toledo Inti., Inc.).
2.2.3.3. TMA content
For the analysis of TMA, ground meat (5 g) was place in a 20 mL vial and volatiles from the headspace were injected into the GC-type electronic nose (Heracles II, Alpha MOS, Toulouse, France) equipped with dual columns (MXT-5 and 1701, Restek, Bellefonte, PA, USA). The analytical conditions were as follows: 10 min headspace generation at 80°C; 5 mL injection volume; 40°C and 240°C the initial and final trap temperature, respectively; and flame ionization detector. The column oven temperature was 40°C for 5 s, increased to 150°C by 0.5°C/s, 260°C by 5°C/s, and held for 30 s. The peak area was integrated using the AlphaSoft program (Alpha MOS) and reported TMA content from the samples.
2.2.4. Electronic tongue
Taste attributes of dry- and wet-aged beef were detected using an electronic tongue (Astree, Alpha MOS) with seven sensors (AHS, PKS, CTS, NMS,
17
CPS, ANS, and SCS) and one reference electrode (Ag/AgCl). The ground meat samples (100 g) were homogenized (T25, Ika Works) with DW (200 mL) and centrifuged at 2,265 ×g for 10 min (Continent 512R, Hanil Co., Ltd.). Then, the supernatants were obtained from the samples and used for electronic tongue analysis. During the analysis, the sample vials were kept at 20C. The data was reported as the pattern discrimination index (%) and taste attributes of dry- and wet-aged beef based on the AlphaSoft program (Alpha MOS).
2.2.5. Statistical analysis
A completely randomized design was applied to compare taste-active compounds and electronic tongue analysis of dry- and wet-aged beef. Dry- (n=15) and wet-aged beef (n=15) were assigned for 0, 7, 14, 21, and 28 days of aging (n=3 for each aging period). The general linear model was analyzed for the effect of aging method and period. The results were reported as mean values with standard error of the means (SAS 9.4, SAS Institute Inc., Cary, NC, USA) and significant differences among the mean values were determined on the basis of the Tukey’s multiple range test at a level of P<0.05. Correlation coefficient (r2) between moisture content and taste-active compounds of dry- and wet-aged beef was calculated (SAS Institute Inc.).
18
2.3. Results and discussion
2.3.1. Taste-active compounds
2.3.1.1. FAAs
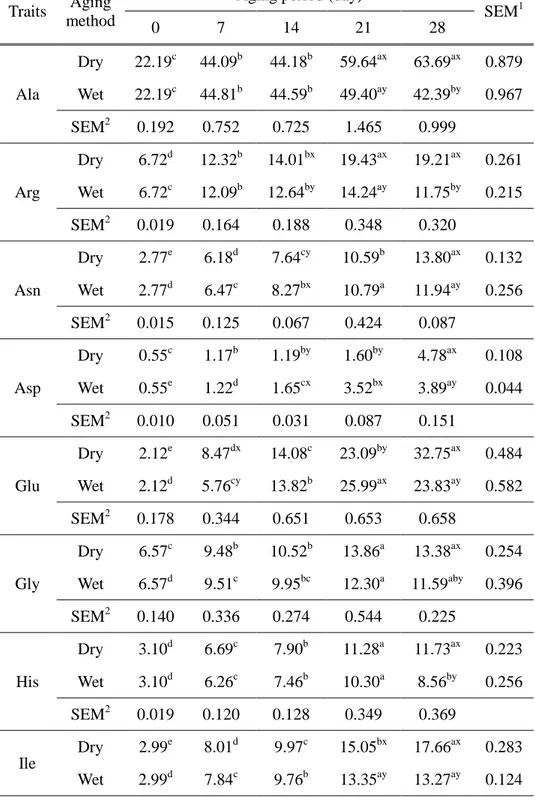
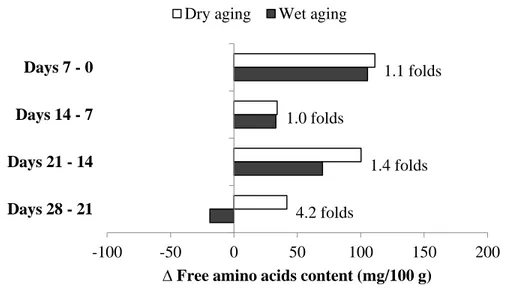
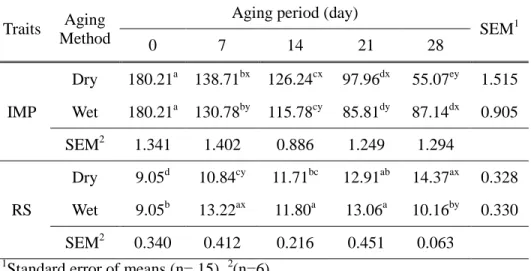
The significant increase in all FAAs components was shown during the first 7 days (2 folds in average) then slowly increased thereafter until 21 days of aging, regardless of aging method (P<0.05, Table 4). Then, the amount of FAAs in dry-aged beef was significantly higher at days 21 and 28 when compared to those in wet-aged one. This phenomenon was occurred as most of FAAs (17 out of 18 components) in wet-aged beef was maintained or decreased at the later stage of aging process, whereas FAAs (12 out of 18 components) in dry-aged beef were continually increased (P<0.05). Therefore, the change in total FAAs content from days 21 to 28 was 4.2 folds higher in dry-aged beef than wet-aged one (Fig. 2), showing that dry aging may promote further increase in FAAs content at the later stage of dry aging process. Similarly, the continuous increase in glutamic acid content of dry-aged beef was reported until 50 days of dry aging process by previous study (Iida et al., 2016). Kim et al. (2016) demonstrated that the amounts of FAAs were more abundant in dry-aged beef (e.g. glutamic acid, isoleucine, leucine, phenylalanine, tryptophan, tyrosine, and valine) when compared to those in wet-aged one, probably due to the relative concentration of protein composition by moisture evaporation and/or a higher rate of proteolysis during dry aging process. However, there was no clear evidence for them.
19
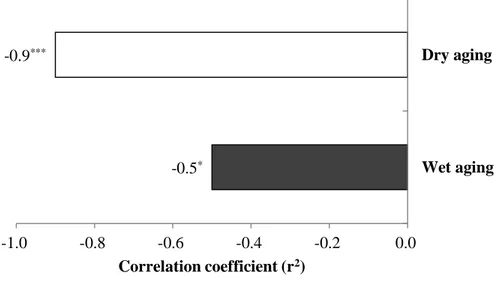
In this study, the role of moisture evaporation in the concentration of FAAs in dry-aged beef was determined using the Pearson’s correlation coefficient between moisture and total FAAs content (Fig. 3). All FAAs components in dry-aged beef had a significantly negative correlation to moisture content (r2=-0.9 in average), as a consequence, its total FAAs content (r2=-0.9, P<0.0001) was more affected by moisture content when compared to that of wet-aged one (r2=-0.5, P<0.05). It means that the moisture evaporation had a strong correlation to the concentration of FAAs in dry-aged beef. However, from days 21 to 28, not all FAAs components in dry-aged beef were proportionally increased by the decrease in moisture content (e.g. alanine, arginine, glycine, histidine, tryptophan, and tyrosine) (Table 4 and Fig. 5), which is consistent with the result from Kim et al. (2016). This result indicates that the changes in FAAs content of dry-aged beef could not be completely understood with the concentration effect by the moisture evaporation alone. There may be another factor affecting the further increase in FAAs content of dry-aged beef especially at the later stage of aging process and it may have a significant role in the flavor development of dry-aged beef.
Proteolysis has been referred as the candidate of another contributor to the higher FAAs content of dry-aged beef (Kim et al., 2016). In general, proteolysis in meat and meat products is occurred by two types of proteolytic enzymes, endo- (e.g. calpains and cathepsins) and exo-peptidases (e.g. peptidase and aminopeptidase) (Toldra and Flores, 1998). Among them, aminopeptidase is responsible for the generation of FAAs during the aging
20
process and is derived from muscle and/or microorganisms (Flores and Toldra, 2011; Iida et al., 2016; Toldra, 1998). In this study, it was postulated that the further proteolysis of dry-aged beef may be more related to microorganisms during dry aging process as muscle enzymes could lose its activity with increasing aging period (Iida et al., 2016; Toldra et al., 1997). The growth of microorganisms, especially mold and yeast, is one of the characteristic changes in dry-aged beef as well as the moisture evaporation (Dashdorj et al., 2016; Khan et al., 2016; Ryu et al., 2018). Ryu et al. (2018) investigated the microorganisms in dry-aged beef during 50-60 days of aging and found molds
and yeasts, such asRhodotorula, Penicillum camemberti, and Debaryomyces
hansenii. The growth of mold and yeast on the crust of dry-aged beef was also observed in this study with the increase of aging period (data not shown). The effect of mold and yeast could be varied with the conditions of dry aging process (e.g. low temperature and water activity). However, their role in dry-aged beef is certainly expected as the proteolysis and lipolysis microorganisms have been proven for decades in dry-cured/fermented meat products (Flores and Toldra, 2011). Besides, the microorganisms in dry-aged beef may influence the activity of muscle aminopeptidase indirectly in this study as its metabolites, including amine and ammonia, could increase the pH (Lee et al., 2018). Most of muscle aminopeptidases are active at neutral pH (Toldra et al., 1997). In this study, a significantly higher pH of dry-aged beef (5.72) was found than that of wet-aged one (5.44) (Fig. 6), possibly by the higher trimethylamine content in dry-aged beef (Fig. 7). Iida et al. (2016) also reported that the activity of muscle aminopeptidase C and H were maintained
21
until 60 days of dry aging process. It may suggest the possibility of microbial role in dry-aged beef with the higher pH. In other words, the growth of mold and yeast during dry aging process may induce the further proteolysis of dry-aged beef from days 21 to 28, directly by their proteolytic enzymes and/or indirectly through the activation of muscle aminopeptidase with the pH increase.
22
Table 4. Free amino acids content (mg/100 g) of beef sirloin aged with different aging methods during 28 days
Traits Aging
method
Aging period (day)
SEM1 0 7 14 21 28 Ala Dry 22.19c 44.09b 44.18b 59.64ax 63.69ax 0.879 Wet 22.19c 44.81b 44.59b 49.40ay 42.39by 0.967 SEM2 0.192 0.752 0.725 1.465 0.999 Arg Dry 6.72d 12.32b 14.01bx 19.43ax 19.21ax 0.261 Wet 6.72c 12.09b 12.64by 14.24ay 11.75by 0.215 SEM2 0.019 0.164 0.188 0.348 0.320 Asn Dry 2.77e 6.18d 7.64cy 10.59b 13.80ax 0.132 Wet 2.77d 6.47c 8.27bx 10.79a 11.94ay 0.256 SEM2 0.015 0.125 0.067 0.424 0.087 Asp Dry 0.55c 1.17b 1.19by 1.60by 4.78ax 0.108 Wet 0.55e 1.22d 1.65cx 3.52bx 3.89ay 0.044 SEM2 0.010 0.051 0.031 0.087 0.151 Glu Dry 2.12e 8.47dx 14.08c 23.09by 32.75ax 0.484 Wet 2.12d 5.76cy 13.82b 25.99ax 23.83ay 0.582 SEM2 0.178 0.344 0.651 0.653 0.658 Gly Dry 6.57c 9.48b 10.52b 13.86a 13.38ax 0.254 Wet 6.57d 9.51c 9.95bc 12.30a 11.59aby 0.396 SEM2 0.140 0.336 0.274 0.544 0.225 His Dry 3.10d 6.69c 7.90b 11.28a 11.73ax 0.223 Wet 3.10d 6.26c 7.46b 10.30a 8.56by 0.256 SEM2 0.019 0.120 0.128 0.349 0.369 Ile Dry 2.99e 8.01d 9.97c 15.05bx 17.66ax 0.283 Wet 2.99d 7.84c 9.76b 13.35ay 13.27ay 0.124
23 SEM2 0.010 0.081 0.103 0.304 0.360 Leu Dry 5.51e 14.95d 17.87c 26.54bx 29.26ax 0.422 Wet 5.51d 14.56c 17.53b 23.84ay 23.01ay 0.236 SEM2 0.010 0.132 0.178 0.510 0.523 Lys Dry 4.10d 11.84c 13.93c 24.93bx 20.40ax 0.573 Wet 4.10c 12.31b 14.20b 19.81ay 12.92by 0.446 SEM2 0.073 0.236 0.323 0.794 0.722 Met Dry 2.57e 6.44d 8.02c 11.50bx 12.58ax 0.206 Wet 2.57d 6.50c 7.91b 10.55ay 10.34ay 0.131 SEM2 0.015 0.079 0.111 0.182 0.312 Phe Dry 3.74e 8.72d 10.72c 15.60bx 17.35ax 0.231 Wet 3.74d 8.64c 10.57b 14.30ay 14.13ay 0.153 SEM2 0.006 0.077 0.135 0.251 0.325 Pro Dry 3.57d 7.08cd 10.47bcx 12.47b 18.56ax 0.971 Wet 3.57c 4.08bc 6.88abcy 10.29ab 13.15ay 1.442 SEM2 0.274 1.449 0.838 2.067 0.640 Ser Dry 6.36e 14.56d 16.98c 21.26b 25.98ax 0.316 Wet 6.36d 14.59c 16.72b 20.57a 22.33ay 0.390 SEM2 0.035 0.383 0.347 0.547 0.253 Thr Dry 4.25e 10.26d 12.08c 17.23b 20.24ax 0.195 Wet 4.25d 10.28c 12.37b 16.02a 15.85ay 0.270 SEM2 0.020 0.182 0.225 0.395 0.194 Try Dry 1.08d 2.60c 3.14b 4.07a 4.51ax 0.106 Wet 1.08d 2.64c 3.20b 3.78a 3.56aby 0.113 SEM2 0.020 0.060 0.111 0.080 0.194 Tyr Dry 3.49d 10.96c 12.17bx 18.19ax 18.89ax 0.221 Wet 3.49c 10.73b 10.08by 12.27ay 11.06by 0.243
24 SEM2 0.193 0.133 0.157 0.338 0.275 Val Dry 4.56e 13.56d 16.57c 25.29bx 28.67ax 0.373 Wet 4.56d 13.25c 17.08b 23.26ay 22.06ay 0.257 SEM2 0.019 0.204 0.225 0.342 0.551 Total Dry 86.23e 197.39d 231.44c 331.64bx 373.44ax 4.258 Wet 86.23e 191.54d 224.68c 294.59ay 275.62by 3.327 SEM2 0.172 3.327 4.210 5.942 5.758 1
Standard error of means (n= 15), 2(n=6). a-e
Means within the same row with different superscript differ significantly (P<0.05).
x,y
Means within the same column with different superscript differ significantly (P<0.05).
25
Figure 2. Change in total free amino acids content (mg/100 g) in dry- (□) and wet-aged beef (■) with the different aging periods.
The values were calculated as the subtraction of each result from different aging periods at 7 days interval.
Each number indicates the ratio of free amino acids content in dry-aged beef to that in wet-aged one.
4.2 folds 1.4 folds 1.0 folds 1.1 folds -100 -50 0 50 100 150 200 Days 28 - 21 Days 21 - 14 Days 14 - 7 Days 7 - 0
∆ Free amino acids content (mg/100 g)
26
Figure 3. Correlation coefficient (r2) between moisture and total free amino acids content in dry- (□) and wet-aged beef (■).
* , P<0.05; **, P<0.01; ***, P<0.0001 (n=30). -0.5* -0.9*** -1.0 -0.8 -0.6 -0.4 -0.2 0.0 Wet aging Dry aging Correlation coefficient (r2)
27
2.3.1.2. IMP and RS
IMP degradation is a well-known reaction during the aging process (Lee et al., 2017); however, there are only a few reports which present the changes in IMP of dry-aged beef and their comparison to wet-aged beef (Iida et al., 2016; Kim et al., 2016). In this study, IMP contents of dry- and wet-aged beef were significantly decreased with the increase of aging period, except for wet-aged one from days 21 to 28 (Table 5). During this period, the continuous decrease of IMP was found only in dry-aged beef. As a result, dry-aged beef had a significantly lower IMP content (55.07 mg/100 g) than that of wet-aged one (87.14 mg/100 g) after 28 days of aging (P<0.05), which is similar to the result from Kim et al. (2016) who reported 1.65 folds higher IMP content in wet-aged beef.
The lower IMP content of dry-aged beef at day 28, when compared to that of wet-aged one (P<0.05, Table 5), could be attributed to the activation of enzymes involved in IMP degradation (Koutsidis et al., 2008b). The hypoxanthine content of wet-aged beef was not significantly changed from days 21 to 28, whereas that of dry-aged beef was increased (P<0.05, data not shown). Consequently, dry-aged beef had higher hypoxanthine content after 28 days of aging than that in wet-aged one. This result indicates that IMP degradation was continued until the end of dry aging process, not like that in wet-aged beef. Similarly, Iida et al. (2016) demonstrated that dry aging could significantly decrease IMP content of beef longissimus thoracis up to day 50.
28
days of aging when compared to that of dry-aged beef (14.37 mM) (P<0.05, Table 5). Both aging methods had a significant negative correlation to moisture content (r2=-0.9, P<0.0001 and r2=-0.8, P<0.01 for dry- and wet-aged beef, respectively) (Fig. 4). However, as the correlation of dry-wet-aged beef was slightly stronger than that of wet-aged beef, a higher RS content of dry-aged beef may be more related to IMP degradation during the aging process. The enzymatic breakdown of IMP liberated ribose and ribose-5-phosphate (main RS components in animal muscle) through two different pathways after the slaughter: i) dephosphorylation of IMP to inosine and then breakdown inosine to hypoxanthine and ribose or ii) IMP itself degraded to hypoxanthine and ribose-5-phosphate (Lee and Newbold, 1963). In this study, the changes in IMP and RS also had similar tendencies in both aging methods. As a consequence, this result shows that dry aging could increase RS content indirectly through the IMP degradation and the concentration effect by the moisture evaporation during dry aging process may be partially responsible.
29
Table 5. Inosine 5
´
-monophosphate (mg/100 g) and reducing sugar contents (mM) of beef sirloin aged with different aging methods during 28 daysTraits Aging
Method
Aging period (day)
SEM1 0 7 14 21 28 IMP Dry 180.21a 138.71bx 126.24cx 97.96dx 55.07ey 1.515 Wet 180.21a 130.78by 115.78cy 85.81dy 87.14dx 0.905 SEM2 1.341 1.402 0.886 1.249 1.294 RS Dry 9.05d 10.84cy 11.71bc 12.91ab 14.37ax 0.328 Wet 9.05b 13.22ax 11.80a 13.06a 10.16by 0.330 SEM2 0.340 0.412 0.216 0.451 0.063 1
Standard error of means (n= 15), 2(n=6). a-e
Means within the same row with different superscript differ significantly (P<0.05).
x,y
Means within the same column with different superscript differ significantly (P<0.05).
30
Figure 4. Correlation coefficient (r2) between moisture and reducing sugar content in dry- (□) and wet-aged beef (■).
* , P<0.05; **, P<0.01; ***, P<0.0001 (n=30). -0.8** -0.9*** -1.0 -0.8 -0.6 -0.4 -0.2 0.0 Wet aging Dry aging Correlation coefficient (r2)
31
2.3.2. Chemical traits
2.3.2.1. Moisture content
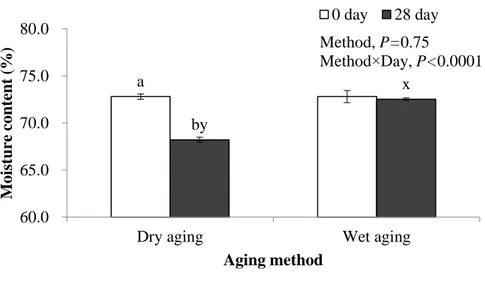
Based on this study, the changes in moisture content of dry- and wet-aged beef was attributed to the interaction effect of aging method and days (P<0.0001, Fig. 5). The moisture content of dry-aged beef was not lower than that of wet-aged one up to day 21 but lower only at day 28 (P<0.05), which is the point that the highest amounts of FAAs and RS was found in dry-aged beef (Tables 4 and 5). However, as mentioned earlier, the concentration effect of taste-active compounds in dry-aged beef by the moisture evaporation could not completely explain the flavor of dry-aged beef as it was not proportionally changed. In other words, the concentration effect by the moisture evaporation would be a partial reason for the higher amounts of taste-active compounds found in dry-aged beef than wet-aged counterpart.
32
Figure 5. Moisture content (%) of beef sirloin aged with different aging methods after 28 days (mean ± standard deviation).
a,b
Different letters indicate a significant difference within the same aging method (P<0.05, n=6).
x,y
Different letters indicate a significant difference within the same aging period (P<0.05, n=6). a by x 60.0 65.0 70.0 75.0 80.0
Dry aging Wet aging
Moi st ure cont ent ( % ) Aging method Method, P=0.75 Method×Day, P<0.0001 0 day 28 day
33
2.3.2.2. pH
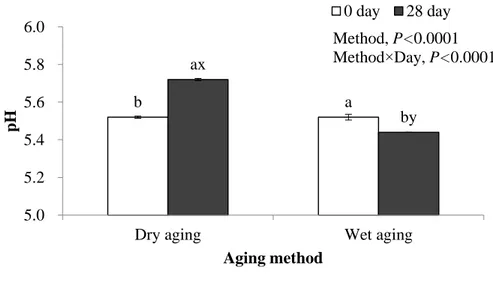
After 28 days of aging, dry-aged beef had a significantly higher pH when compared to that in wet-aged one (Fig. 6), similar to Dikeman et al. (2013) who reported pH increase in dry aging than that in wet aging (P<0.01). This phenomenon was occurred from day 21 and may be owing to i) the increase of pH in dry-aged beef by the high production of amine/ammonia contents (basic) in dry-aged beef (e.g. trimethylamine in Fig. 7) and/or ii) the decrease of pH possibly by the growth of lactic acid bacteria, increasing lactic acid content (acidic) in ‘vacuum-packed’ wet-aged beef. As the features of mold and yeast were also observed on the crust of dry-aged beef from day 14, it was assumed that such microorganisms could cause the increase in pH of dry-aged beef inside at the later stage of dry aging process.
The significantly different pH between dry- and wet-aged beef could change their enzyme activity and/or formation of aroma volatiles (e.g. pyrazines, pyridines, and sulfur containing compounds) during cooking as the Maillard reaction is pH dependent (Meynier and Mottram, 1995).
34
Figure 6. pH of beef sirloin aged with different aging methods after 28 days (mean ± standard deviation).
a,b
Different letters indicate a significant difference within the same aging method (P<0.05, n=6).
x,y
Different letters indicate a significant difference within the same aging period (P<0.05, n=6). b a ax by 5.0 5.2 5.4 5.6 5.8 6.0
Dry aging Wet aging
pH
Aging method
Method, P<0.0001 Method×Day, P<0.0001
35
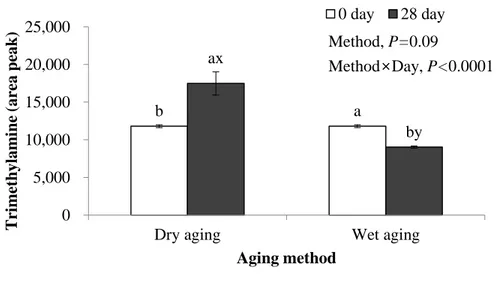
2.3.2.3. TMA content
As it was hypothesized that the further proteolysis of dry-aged beef may be highly related to microorganisms on the crust, the amount of TMA was determined to estimate the microbial metabolic activity on dry-aged beef (Fig. 7). At day 28, which showed the highest amounts of FAAs and RS, TMA content was significantly higher in dry-aged beef (approximately 2-3 folds) when compared to those in wet-aged one (P<0.05). Due to the fact that TMA production is proportional to the microbial activity (Flores et al., 1997; Pearson, 1968), the proteolytic activity by microorganisms in dry-aged beef could be a main reason for its specific flavor. Ryu et al. (2018) also suggested that microorganisms may play an important role in the flavor of dry-aged beef.
36
Figure 7. Trimethylamine content (area peak) of beef sirloin aged with different aging methods after 28 days (mean ± standard deviation).
a,b
Different letters indicate a significant difference within the same aging method (P<0.05, n=6).
x,y
Different letters indicate a significant difference within the same aging period (P<0.05, n=6). b a ax by 0 5,000 10,000 15,000 20,000 25,000
Dry aging Wet aging
T ri m et hylam ine ( are a peak) Aging method Method, P=0.09 Method×Day, P<0.0001 0 day 28 day
37
3.3. Electronic tongue
The difference in taste attributes of dry- and wet-aged beef was analyzed using the electronic tongue (Figs. 8 and 9). The pattern discrimination index of dry- and wet-aged beef was increased with the increase of aging period, and it became discriminable from day 14 (> 73.17%) and it reached to > 92.29% after 28 days of aging (Fig. 8). The increase in the distances between taste attributes of dry- and wet-aged beef may be related to the difference in saltiness, sourness, and umami taste detected by the sensors of ANS, CTS, and NMS, respectively (Fig. 9). These were gradually increased during 28 days of dry aging process, resulting in a relatively higher score in dry-aged beef than wet-aged one at day 28.
The differences in taste-active compounds (FAAs, IMP, and RS) between dry- and wet-aged beef (Tables 4 and 5) could cause significant differences in their flavor. FAAs itself could contribute to sweet and bitter taste and also influence saltiness and sourness together with acids and inorganic/sodium salts, respectively (Shahidi, 1994). In addition, glutamic acid is one of the most important components for umami taste in meat (Zhao et al., 2016). In this study, the sum of FAAs components which can be attributed to each taste (sweet, bitter, and umami) were significantly higher in dry-aged beef after 28 days of aging when compared to wet-aged one (data not shown). Besides, aroma volatiles can be formed by FAAs with RS during cooking (Koutsidis et al., 2008b; Mottram, 1998). Aroma volatiles were not analyzed in this study. However, based on previous study, it was assumed that significant differences
38
in FAAs may cause different aroma development of dry- and wet-aged beef. For example, methionine could generate cooked beef aroma with a low threshold value, whereas isoleucine, leucine, phenylalanine, serine, threonine, and valine produce Strecker aldehydes and heterocyclic compounds, which possess the characteristic aroma in meat (Mottram, 1998; Toldra et al., 2000).
Meanwhile, different IMP degradation/RS accumulation between dry- and wet-aged beef could contribute to different flavor of dry- and wet-aged beef. IMP and RS possess umami and sweet taste, respectively (Koutsidis et al., 2008b). In addition, RS can generate aroma volatiles in meat through the Maillard reaction with amino acid (Mottram, 1998). However, further degradation of IMP in dry-aged beef may increase the accumulation of hypoxanthine, which has none or bitter taste in meat and meat products (Shahidi, 1994; Tikk et al., 2006).
Table 6 summarizes the comparison on taste-active compounds and electronic tongue analysis between dry- and wet-aged beef based on the results from the present study.
39
Figure 8. Pattern discrimination index (%) of beef sirloin aged with different aging methods during 28 days by an electronic tongue analysis.
The data was analyzed using the AlphaSoft program (n=30). 0.0 22.4 73.2 78.9 92.3 0 20 40 60 80 100 0 7 14 21 28 P at ter n dis cr im inat ion ind ex (% )
40
Figure 9. Spider plot for taste attributes from electronic tongue analysis of (a) dry- or (b) wet-aged beef sirloin during 28 days by an electronic tongue analysis.
The data was analyzed using the AlphaSoft program (n=30). 4 5 6 7 8AHS PKS CTS NMS CPS ANS SCS
(a) Dry aging
0 day 7 day 14 day 21 day 28 day 4 5 6 7 8AHS PKS CTS NMS CPS ANS SCS (b) Wet aging 0 day 7 day 14 day 21 day 28 day
41
Table 6. Comparison on the taste attributes of dry- and wet-aged beef by chemical and electronic tongue analyses during aging period
Taste
attributes1 Aging method
FAAs Dry > Wet
IMP Dry < Wet
RS Dry > Wet
Saltiness Dry > Wet
Sourness Dry > Wet
Umami Dry > Wet
This table was summarized based on the results from the present study. FAAs, free amino acids; IMP, inosine 5
´
-monophosphate; RS, reducing sugar.42
2.4. Conclusion
Dry aging can produce meat with more abundant taste and/or aroma by the presence of higher taste-active compounds than wet aging. The differences in taste attributes between dry- and wet-aged beef could be caused by 2 different reasons: i) mainly the further metabolic activities such as proteolysis and IMP degradation in dry-aged beef possibly by microorganisms on the crust and ii) partially the concentration effect by the moisture evaporation during dry aging process. The results of further study in role of microorganisms in dry-aged beef are presented in Chapters III and IV to confirm this hypothetic mechanism.
43
References
Campbell, R. E., Hunt, M. C., Levis, P., & Chambers IV, E. (2001). Dry-aging effects on palatability of beef longissimus muscle. Journal of Food Science, 66, 196-199.
Dikeman, M. E., Obuz, E., Gok, V., Akkaya, L., & Stroda, S. (2013). Effects of dry, vacuum, and special bag aging; USDA quality grade; and end-point temperature on yields and eating quality of beef longissimus lumborum steaks. Meat Science, 94, 228-233.
Dashdorj, D., Tripathi, V. K., Cho, S., Kim, Y., & Hwang, I. (2016). Dry aging of beef; Review. Journal of Animal Science and Technology, 58, 1-11.
Flores, J., Marcus, J. R., Nieto, P., Navarro, J. L., & Lorenzo, P. (1997). Effect of processing conditions on proteolysis and taste of dry-cured sausages. Zeitschrift Fur Lebensmittel-Untersuchung Und -Forschung, 204, 168-172.
Flores, M., & Toldra, F. (2011). Microbial enzymatic activities for improved fermented meats. Trends in Food Science and Technology, 22, 81-90.
Iida, F., Miyazaki, Y., Tsuyuki, R., Kato, K., Egusa, A., Ogoshi, H., & Nishimura, T. (2016). Changes in taste compounds, breaking properties, and sensory attributes during dry aging of beef from Japanese black cattle. Meat Science, 122, 46-51.
44
Taste-active compound levels in Korean native chicken meat: The effects of bird age and the cooking process. Poultry Science, 94, 1964-1972.
Khan, M. I., Jung, S., Nam, K. C., & Jo, C. (2016). Postmortem aging of beef with a special reference to the dry aging. Korean Journal for Food Science of Animal Resources, 36, 160-170.
Kim, Y. H. B., Kempa, R., & Samuelsson, L. M. (2016). Effects of dry-aging on meat quality attributes and metabolite profiles of beef loins. Meat Science, 111, 168-176.
Koutsidis, G., Elmore, J. S., Oruna-Concha, M. J., Campo, M. M., Wood, J. D., & Mottram, D. S. (2008a). Water-soluble precursors of beef flavour: I. Effect of diet and breed. Meat Science, 79, 124-130.
Koutsidis, G., Elmore, J. S., Oruna-Concha, M. J., Campo, M. M., Wood, J. D., & Mottram, D. S. (2008b). Water-soluble precursors of beef flavour. Part II: Effect of post-mortem conditioning. Meat Science, 79, 270-277.
Lee, C. A., & Newbold, R. P. (1963). The pathway of degradation of inosinic acid in bovine skeletal muscle. Biochimica et Biophysica Acta, 72, 349-352.
Lee, H. J., Choe, J., Kim, K. T., Oh, J., Lee, D. G., Kwon, K. M., Choi, Y. I., & Jo, C. (2017). Analysis of low-marbled Hanwoo cow meat aged with different dry-aging methods. Asian-Australasian Journal of Animal Sciences, 30, 1733-1738.