International Journal of Rock Mechanics & Mining Sciences 134 (2020) 104438
Available online 17 August 2020
1365-1609/© 2020 The Author(s). Published by Elsevier Ltd. This is an open access article under the CC BY license (http://creativecommons.org/licenses/by/4.0/).
Photoelastic observation of toughness-dominant hydraulic fracture
propagation across an orthogonal discontinuity in soft, viscoelastic
layered formations
Soo-Min Ham, Tae-Hyuk Kwon
*Department of Civil and Environmental Engineering, Korea Advanced Institute of Science and Technology (KAIST), Daejeon, 34141, South Korea
A R T I C L E I N F O Keywords:
Hydraulic fracture Fracture visualization Photoelasticity Stress intensity factor Fracture containment Discontinuity
A B S T R A C T
Hydraulic fracture (HF) unavoidably encounters natural pre-existing discontinuities in geologic formations, which complicates the propagation and containment behavior across a discontinuity. This study explored the HF propagation across an orthogonal discontinuity in layered formations by exploiting the photoelastic, transparent, soft (or deformable), and viscoelastic characteristics of gelatin. First, photoelastic HF experiments in homoge-neous gelatin media were carried out while monitoring the fluid pressure and stress intensity factor (SIF). The SIF was observed to stay constant during steady-state HF propagation. Second, photoelastic HF experiments in layered gelatin media were conducted, in which biwing-type fractures encountered the bounding layers with different levels of stiffness. Two contrasting containment behaviors — crossing or dilation/arrested — were observed. The fracture crossed the discontinuity when it encountered the bounding layer with a lower toughness. By contrast, the fracture was arrested by the bounding layer and/or dilated the discontinuity, propagating along the discontinuity when the bounding layer had a greater toughness. In addition, competition between debonding of the layer interface and creating a fresh fracture in the bounding layer was found to play a significant role in fracture containment behavior. This study provides unique experimental data with photoelastic images that are comparable to analytical or numerical models. Furthermore, the results contribute to a better understanding of HF propagation and containment behaviors across a discontinuity in viscoelastic media.
1. Introduction
Generation of fractures by fluid injection, also referred to as “hy-draulic fracturing”, enhances fluid transport in geologic formations, and thus it is widely implemented in geo-engineering practices, including enhanced hydrocarbon recovery,1,2 enhanced geothermal heat recov-ery,3,4 and isolation of hazardous waste.5 Natural geologic formations contain innate discontinuity, such as stratification (layering), natural faults and fractures, and tiny fissures and cracks. Previous mine-back experiments and microseismic fracture mapping studies at a field scale have reported the complex patterns of hydraulic fracture (HF) propa-gation in fractured rocks or layered formations.6,7 Prediction of the generated HF geometry in natural geologic formations with layering and discontinuity is one of the important issues in safe and economic design of hydraulic fracturing practices.
One of the intriguing questions concerns the containment behavior of a propagating fracture when it encounters a pre-existing natural
discontinuity (or interface) — whether it will cross the interface (crossing or passing), be arrested by the interface (arrested or confined), or propagate along while dilating the interface (dilation).8,9 Various efforts using physical experimentation have attempted to answer this question and to identify the factors affecting such containment behavior at a discontinuity. These include material properties, in situ stress con-ditions, discontinuity condition, and injecting-fluid properties. The salient findings from previous experimental studies are summarized in Table 1. However, physical experimental results on HF propagation and containment behavior in layered formations with discontinuity are still scarce, and experimental data that are interpretable and comparable to analytical and numerical models are particularly limited. Moreover, because the rock materials are opaque and the fracture propagation is a fairly fast and dynamic process, observation of HF propagation patterns at a discontinuity in physical experimentation still poses challenges. This hampers further advancement in the fundamental understanding of HF containment behavior at a discontinuity.
* Corresponding author.
E-mail addresses: soomin.ham@kaist.ac.kr (S.-M. Ham), t.kwon@kaist.ac.kr (T.-H. Kwon). Contents lists available at ScienceDirect
International Journal of Rock Mechanics and Mining Sciences
journal homepage: http://www.elsevier.com/locate/ijrmmshttps://doi.org/10.1016/j.ijrmms.2020.104438
“Photoelasticity” refers to the optomechanical characteristics of materials that become doubly refractive (or birefringent) when sub-jected to stress. The resulting fringe pattern in a photoelastic material under stress makes possible the analysis of the stress distribution near a fracture tip and, hence, computation of the stress intensity factor (SIF) (linear elastic fracture mechanics, or LEFM).10–12 Hence, the photo-elasticity often has been used to calculate the SIF during fracture propagation in homogeneous media,13–16 although the majority of previous studies investigated the fractures driven by external mechani-cal loads. However, no photoelastic investigation on fluid-driven frac-ture propagation in homogeneous media or with the discontinuity has been reported to date.
Furthermore, HF propagation behavior significantly differs with the material plasticity or viscosity with respect to, but not limited to, the fluid injection pressure response, fracture geometry, and propagation veloc-ity.17–19 For instance, the pressure significantly drops in hard and brittle media with no or extremely low viscosity. However, in soft (or deform-able) and viscous media, it gradually decreases as the fracture is initiated and propagates. The fracture tip is sharp in brittle media, whereas it is comet-shaped in deformable and viscous media. In brittle media, the HF propagation velocity decreases with time, while it is kept at a steady state in deformable, viscous media.19,20 There have been a few experimental studies on HF propagation in viscoelastic media19,21–23; however, no attempt has been made to investigate the HF propagation across the discontinuity in viscoelastic media.
Therefore, in this study, the HF propagation across discontinuities in viscoelastic and layered plate media were investigated by employing a photoelastic experiment method. Previously, the steady-state HF prop-agation in two-dimensional plate media made of transparent, visco-elastic gelatin samples has been successfully visualized and characterized.19 First, as a follow-up to that previous study, photoelastic investigation in HF propagation in homogeneous, viscoelastic gelatin media was carried out, in which the fracture geometry and photoelastic fringe patterns were visualized while monitoring the fluid injection pressure. Second, the effect of the bounding-layer stiffness on the HF and pre-existing fracture interactions was examined, because the elastic modulus of the bounding-layer formation plays a significant role in determining the fracture containment and fracture geometry.24 Four cases with different bounding-layer stiffnesses were tested, in which a fracture was from a medium-stiffness material and propagated to a low-, medium-, high-, or very-high-stiffness material. Furthermore, the frac-ture geometry and the SIF variation at the fracfrac-ture tip were analyzed and compared with the medium toughness and injection pressure. In this study, unique experimental test data on the HF propagation in visco-elastic media and the HF containment behavior across a discontinuity are presented.
2. Materials and methods
2.1. Materials
Gelatin was chosen as an analog to a rocklike medium because of the following advantages. (a) The gelatin is characterized with its visco- elasticity and it shows a remarkably wide elastic range, up to a verti-cal strain of ~30–50%.25,26 Therefore, the gelain can be a good analogy to soft rocks, such as shale.27,28 (b) The gelatin is optically transparent, such that the fracture can be visualized during propagation. (c) Because gelatin is known to become doubly refractive (or birefringent) when subjected to stress, this photoelasticity of gelatin makes possible the analysis of the SIF and the stress distribution near a fracture tip.12 (d) Finally, the specimen can be remolded into various shapes, and the stiffness can be readily controlled with the gelatin concentration, which provides a good control for physical experimentation.
In this study, the gelatin stiffness was controlled to four different levels by varying the gelatin concentration in solution prior to gelation, following previous work.19 The gelatin concentration varied as follows: 7.41 wt% for low stiffness (L), 12.28 wt% for medium stiffness (M), 13.79 wt% for high stiffness (H), and 16.7 wt% for very high stiffness (VH). Hereafter, the gelatin samples are named after their stiffness level: L-gelatin, M-gelatin, H-gelatin, and VH-gelatin. The Young’s modules and fracture toughness of these gelatin samples were determined using the indentation tests29 and the wire cutting method,30 and summarized in Table 2. Given the unique soft characteristics of gelatin, the values obtained herein provide good estimates on the elastic moduli and toughness of gelatin, though the values may differ slightly from the ones from the ISRM-suggested standard methods, such as uniaxial compres-sion test and Brazilian tensile test. The Poisson’s ratio was assumed to be 0.5 as the gelatin is an incompressible material.31–33
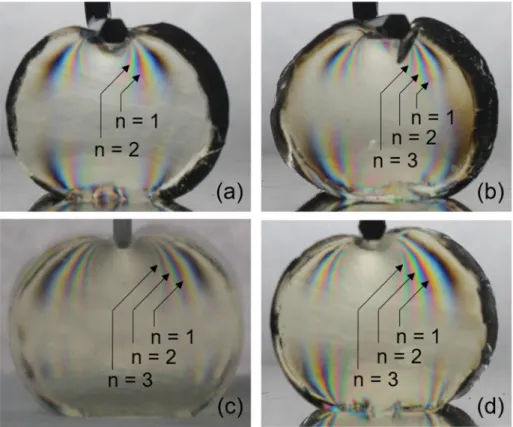
The photoelastic constant was determined by applying the loads onto the disk-shaped gelatin samples with a thickness of 10 mm and a radius of 9.3 mm. Fig. 1 shows the photoelastic images of L-, M − , H-, and VH- gelatin samples under a load. The photoelastic constant was calculated using the followed equation34
Table 1
Previous observations on the factors affecting fracture containment behavior at discontinuity.
Factors Finding Material
Medium property From a stiff to a soft material: crossing
From a soft to a stiff material: arrested or dilated Sand stone and shale zone
70; Plaster (soft for Talc, stiff for
hydrostone)73
In-situ stress HF crossed with a high normal stress orthogonal to interface: crossing
Low horizontal stress difference: dilation
Cement and fine sand;36
Sichuan shale;37
Raw coal block;38
Stacks of sandstone39
Interface
condition Incident angle Close to 90 ◦: crossing
Less than 60◦: dilation Colton sandstone;
74
Concrete block;75
Eidsvold siltstone76
Discontinuity
thickness Thin discontinuity: crossing Thick discontinuity: dilation Cement block
36; Gypsum plaster and hydrostone;77
Marcellus shale78
Strength Strong bonding: crossing
Weak bonding: dilation Sichuan shale
79
Injecting fluid Injection rate High flow rate: crossing
Low flow rate: arrested or dilated Raw coal block;
38
Sichuan shale;79
Natural shale block80
Fluid viscosity High viscosity: crossing
Low viscosity: arrested or dilated Stacks of sandstone
39; Concrete block75
Table 2
Material properties of gelatin samples.
Stiffness w% E (kPa) Kc (kPa⋅m0.5) fσ (N/m)
L 7.4 38 0.40 33
M 12.3 90 1.33 44
H 13.8 110 1.53 54
fσ=4 πr ( heff h )( P N ) , (1)
where r is the disk radius, P is the applied load, N is the number of generated fringes (or fringe order), h is the specimen thickness, and heff is
the effective specimen thickness. In the transmission mode, the effective specimen thickness heff is identical to the specimen thickness h.
Accordingly, the fringe constants of L-, M − , H-, and VH-gelatin samples were determined as 33, 44, 54, and 65 N m0.5, as listed in Table 2.
A sucrose solution with a viscosity of 10 cp was used as the fracturing fluid. Because the fluid viscosity can be controlled with the sucrose concentration, a sucrose concentration of 50 wt% produced a fluid with a viscosity of 10 cp, i.e., 100 g of distilled water and 100 g of sugar.35 To capture visually the fracture propagation behavior in the transparent gelatin, the sucrose solution was dyed with blue ink.
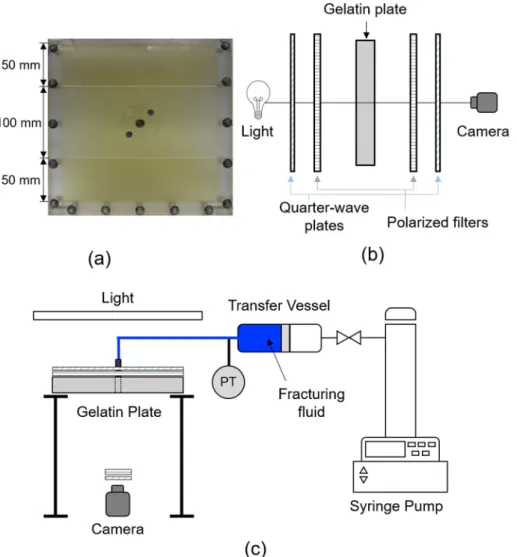
2.2. Experimental setup and procedure
Sample preparation. Fig. 2 shows the HF experimental setup, which used gelatin plate samples with a size of 200 × 200 × 10 mm (width × length × thickness). For the homogeneous medium cases, gelatin plate samples with three stiffness levels were prepared: L-, M − , and H- gelatin. Dry gelatin powder was thoroughly mixed with warm deionized water at 55 ◦C at a predetermined mass ratio, and the solution was
poured into the acrylic mold and cured at 4 ◦C for 20 h.
For the layered-medium cases, the gelatin plate sample was designed to contain three layers and, hence, two discontinuities (or two in-terfaces, as in Fig. 2a). Once a warm gelatin solution was prepared, the gelatin solution was poured into the mold to a depth of 50 mm to form a bottom layer, and, immediately, it was cured at 4 ◦C for 2 h. A gelatin
solution was again poured onto the bottom layer to form a 100-mm-high middle layer, and, in the same manner, cured at 4 ◦C for 2 h. Thereafter,
the gelatin solution was poured to form a 50-mm-high top layer and then kept at 4 ◦C for 18 h. When each layer was prepared, the layer stiffness
was controlled to examine the effect of bounding-layer stiffness. In all layered samples, the middle layer was formed with the M-gelatin. Meanwhile, the gelatin stiffness of the top and bottom layers (or the bounding layers) varied from L-to VH-stiffness gelatin. From a stiffness perspective, it was carefully designed that the initiated HF propagated from M to L, M to M, M to H, and M to VH; these cases are referred to as M2L, M2M, M2H, and M2VH, respectively. In total, seven gelatin plate samples — three homogeneous samples and four layered samples — were prepared and tested in this study, as tabulated in Table 3.
Test setup and procedure. Upon preparation of a gelatin plate sample,
the plate sample was placed horizontally. A copper tube with an outer diameter of 6.4 mm and an inner diameter of 3.8 mm was vertically inserted into the middle layer as a wellbore. At the tip of the copper tube, two perforation holes with a diameter of 1.5 mm were made to inject the fracturing fluid. The perforation holes faced the layer interfaces at a right angle to induce the HF propagation orthogonal to the layer in-terfaces. In addition, two initial cracks with a length of 5 mm were created by scratching the gelatin and aligned with the perforation holes. These initial cracks facilitated the HF propagation in an orthogonal di-rection to the layer interfaces. In this study, the incident angle was strictly controlled to stay in the range of 80◦–100◦to minimize the effect
of the incident angle.
The HF experiments were performed in a plain-strain condition with no leak-off. Note that fractures were generated within the horizontally placed gelatin plate samples cured in the mold while this rigid-wall acrylic mold was not removed. Thereby, the vertical deformation was not allowed by the rigid-wall mold, and the fracture height was constraint to 10 mm during horizontal HF propagation. In addition, the gelatin itself is nearly impermeable for a given short time frame of fracture propagation, which lasted less than ~20 s. The discontinuity was perfectly closed with no aperture and no fluid left within the in-terfaces upon complete curing. The fracture fluids were invaded only to an open space when the fracture propagated and dilated the interface. Thus, all the experiments were under no leak-off and no seepage
Fig. 1. Digital image obtained from photoelastic constant measurement experiment for (a) L gelatin (loaded by 0.49 N), (b) M gelatin (loaded by 0.98 N), (c) H gelatin (loaded by 1.18 N), and (d) VH gelatin (loaded by 1.47 N): the images were taken using the transmission mode.
condition. Meanwhile, the stress condition also plays a significant role in fracture containment behaviors at an interface.36–39 It is worth pointing out that our gelatin samples were not subjected to any external stress, which indicates zero external stress condition. Note that our study only considers the effect of stiffness contrast between layers.
The fracturing fluid was injected through the copper tube, which was connected to the transfer vessel and the syringe pump (Fig. 2c). In all HF experiments, the flow rate was kept constant at 10 mL/min using the syringe pump (500HP, ISCO Teledyne, Lincoln, NE, USA). The injection pressure was logged at 0.1 s intervals using a pressure transducer (PX309-050A5V, Omega, Norwalk, CT, USA) and a data logger (34972A, Agilent, Santa Rosa, CA, USA).
The photoelastic imaging required an additional setup to produce and analyze a polarized light. Therefore, two polarized filters (ESM-647,
Intech-Optic) and two quarter-wave plates (λ/4 Retarder Film, Edmund Optics) were placed between the digital camera lens and the LED light for the transmission mode, as shown in Fig. 2b. The axes of the two polarized filters were aligned parallel for the maximum brightness. Upon the fluid injection, time-lapsed photoelastic images were acquired at every 0.1 s (10 frames per second) using a digital camera (UI–3360CP–C-HQ, IDS Corp.).
2.3. Photoelastic analysis: calculation of the SIF value
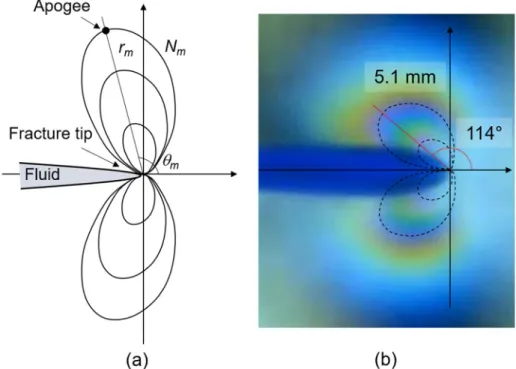
The isochromatic fringes at the fracture tip allows the photoelastic analysis of the SIF of the propagating HF. Fig. 3 shows a representative photoelastic fringe shape at an HF tip. In our HF tests, the generated fracture width ranges less than 10 mm and the fringe size is less than 20 mm. Given the plate size of 200 mm, it appears that the deformational strain level is maintained in the elastic range, less than 30%, during fracture propagation. Furthermore, when the fluid injection was stopped, the fractures were completely closed as the fluid pressure became zero, without leaving any permanent/plastic deformation but a crack. This elastic characteristics of the gelatin enables to use of the apogee method based on LEFM.40 The apogee is selected as the point where the radius from the crack tip becomes the maximum (Fig. 3), and the SIF can be calculated as follows,41
Fig. 2. Experimental setup: (a) the acrylic mold filled with layered medium, (b) a diagram of the polarizers and photoelastic material, and (c) a schematic drawing of the experimental setup.
Table 3
Experimental cases.
Case Stiffness Symbol
Homogeneous Low stiffness L
Medium stiffness M
High stiffness H
Layered Medium to low stiffness M2L
Medium to medium stiffness M2M
Medium to high stiffness M2H
SIF = Nmfσ ̅̅̅̅̅̅̅̅̅̅ 2πrm √ [ 1 +2 tan(3θm/2) 3 tan θm ] t sin θm ̅̅̅̅̅̅̅̅̅̅̅̅̅̅̅̅̅̅̅̅̅̅̅̅̅̅̅̅̅ 1 + ( 2 3 tan θm )2 √ , (2)
where rm is the maximum radius from the crack tip to the outermost
fringe, θm is the angle of inclination corresponding to the maximum
radius, Nm is the fringe order, fσ is the fringe constant, and t is the specimen thickness.
The symmetric fringes at a tip and biwing fracture generation enabled the calculation of four SIF values in each HF test. Because the propagation behaviors of the upper and lower fractures were similar, the average SIF values were computed with the variance bar in the homogeneous-medium cases. However, the SIF values of the upper and lower fractures were plotted separately for the layered-medium cases. At the early stage of HF propagation, the fringe was not sufficiently developed, which prevented reliable calculation of the SIF. Also, severe distortion in the fringe patterns by the interface prevented SIF calcula-tion near the interface. For the same reason, the SIF value could not be acquired when the fracture dilated along the interface. Only the cases where the fracture crossed the interface were analyzed.
2.4. Gelatin as an analog to rock-like materials
Our laboratory, scaled HF experiment setup and the gelatin media used in this study can be upscaled and compared to the field scale by using the scaling relations suggested by de Pater et al.42 The detailed scaling procedure can be also found in Ham and Kwon.19 The scaling principle is based on the basic assumption that the ratio between the elastic energy rate in medium deformation and the frictional dissipation rate in fluid flows is kept constant at any scale, including the laboratory and field scales. A scaling factor is defined as the ratio between a field-scale parameter and a lab-scale parameter, S = Xfield/Xlab.
Accordingly, the scaling factors for injection flow rate SQ, wellbore
radius Sr, elastic modulus SE, and fluid viscosity Sμ can be defined, respectively. By using the elastic deformation energy rate of the rock, fluid frictional dissipation energy rate, and energy rate of crack
formation, the scaling factors can be mutually related, as follows:19,42
SE= SQ×Sμ
S3
r
. (3)
Given general reservoir-scale hydraulic fracturing practices, a vis-cosity of 500 cp, a flow rate of 5 m3/min, and a wellbore radius of 40 mm
are chosen as the representative field-scale values.43,44 Accordingly, the scaling factors of the wellbore radius, flow rate, and fluid viscosity are Sr
=12.5, SQ =500,000, and Sμ =50, respectively. According to Eq (3), the scaling factor of the elastic modulus is determined to be SE =12,800. Therefore, it is estimated that the gelatin media (L-, M − , H-, and VH-gelatin) represent the model rocks having the elastic stiffness Erock = 0.48–3.6 GPa when up-scaled to a reservoir scale. This corresponds typical soft reservoir rocks, such as highly porous sandstones and shales (E < 1 GPa, KIC <1 MPa m0.5).
The dimensionless toughness κ determines the regime of HF propa-gation — viscosity-dominated or toughness-dominated hydraulic frac-turing, and it is defined for HF in a plane strain condition, as follows45:
κ = K ′ ( E′3μ′ Q0 )1/4, (4) where K′ = 4 ( 2 π )1/2 KIC, E′ = 1− νE2, and μ ′ = 12μ. Herein, KIC is the
fracture toughness, E is Young’s modulus, ν is Poisson ratio, μ is fluid viscosity, and Q is the fluid injection rate divided by the fracture height as HF is developed in a plane strain condition, as in Kristianovic–Geerstma–de Klerk model (“KGD model”).45 When the dimensionless toughness κ is less than 1, the majority of energy con-sumption is associated with viscous drags in fluid flows during hydraulic fracturing, which is referred to as the viscosity-dominated hydraulic fracture. On the other hand, when the dimensionless toughness κ is greater than 4, the most of energy is used to create new fracture surfaces in the medium, which is called the toughness-dominated hydraulic fracture. In this study, as the dimensionless fracture toughness κ ranges 10–18, our HF experiments belong to the conditions where the tough-ness is dominant over the fluid viscosity, i.e., the toughtough-ness-dominant HF behaviors.46,47
Fig. 3. General shape of fringes at the crack tip with the maximum radius from the crack tip to fringe, rm, and the angle of inclination corresponding to maximum
A fluid lag is expected during the HF propagation, associated with a tip cavity which is filled with inviscid vapors from the fracturing fluid. Meanwhile, the fluid lag is exponentially small for large enough dimensionless toughness.48 Therefore, the lag is assumed to be insig-nificant in our HF conditions, less than 0.1% of the crack length, as the dimensionless toughness κ is much greater than 4.
3. Results (I): homogeneous medium cases
3.1. HF test results
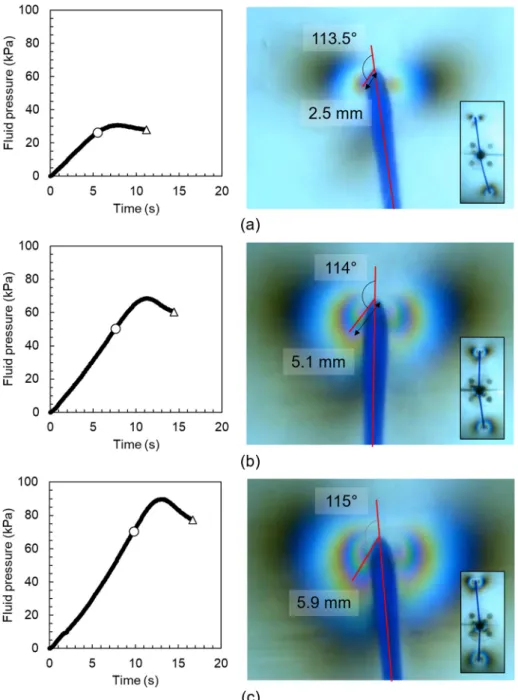
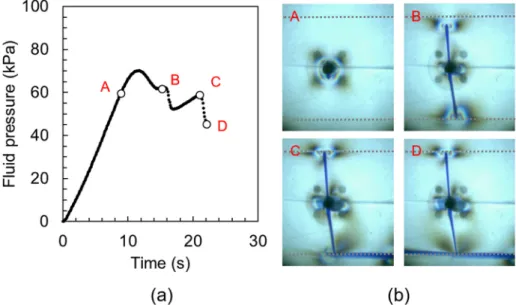
Fig. 4 shows the acquired digital images of the fracture tips with the photoelastic fringes and the pressure responses during fluid injection. In all the cases with the homogeneous gelatin samples, two biwing-type fractures were initiated along the direction of the perforation hole and
propagated with the photoelastic fringes through a homogeneous gelatin sample. The generated fractures were observed to be comet- shaped, composed of a fracture head and a fracture body, because of the viscoelastic characteristics of the gelatin. Generation of these comet- shaped fractures has been consistently reported in previous studies.19,49,50
From the commencing of the fluid injection, the pressure gradually increased until the initiation and propagation of fractures. The pressure where a fracture was initiated was defined as the initiation pressure, as denoted by the circle symbols in the pressure curves of Fig. 4. Even after the fracture initiation, the pressure continued to increase further, but at a reduced rate for a while, as the initiated fracture opened wider and extended farther. Soon, once the fracture began to propagate steadily, the pressure reached the peak value and thereafter decreased in a fairly slow and steady manner. This smooth pressure drop during the steady-
Fig. 4. Pressure responses and digital images of photoelastic fringe pattern denoting the maximum radius and the corresponding angle: (a) L gelatin, (b) M gelatin, and (c) H gelatin samples — the circle and triangle symbols in the pressure curves indicate the time when the fracture initiated and the test ended, respectively, and the digital images on the right side show the fracture tips with the photoelastic fringes at the end of the test, corresponding to the triangle symbol in the pres-sure curves.
state fracture propagation was reported by Ham and Kwon,19 and it is possibly associated with the viscosity of the gelatin materials. By contrast, upon reaching the peak pressure, a sudden pressure drop has been widely observed in non-viscous materials.18,51 The HF test was halted when the fracture almost reached the sample boundary, as denoted by the triangle symbols in the pressure curves (Fig. 4). It was also found that the initiation pressure increased with an increase in the gelatin stiffness. The high-resolution, time-lapsed images of all the HF tests of the homogeneous medium cases are available in the Supporting Information (Movies S1-S3).
3.2. Photoelastic analysis results
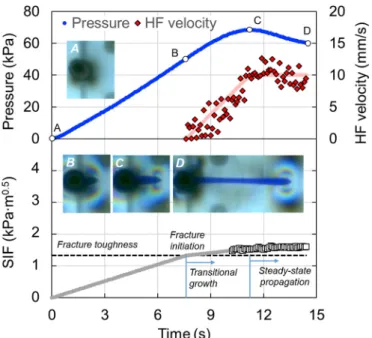
The isochromatic fringe in the photoelastic images captured the stress field created at the fracture tip, as shown in Fig. 4. The SIF was obtained by using the apogee method40 — Equation (2) — in which a fringe order was assigned for each fringe in accordance with the Michel-Levy birefringence.52 As an example, for H-gelatin in Fig. 4c, the maximum radius was estimated as 5.9 mm, the corresponding angle as 115◦, and the fringe order as 2, which yields an SIF of 2 kPa m0.5. Fig. 5
shows the SIF values during HF propagation, superimposed with the pressure response and fracture propagation velocity.
For the L-, M − , and H-gelatin samples, the SIF values were approximately 0.42, 1.5, and 2 kPa m0.5, respectively. The SIF values
stayed remarkably consistent, with only a small variation of less than ~0.3 kPa m0.5 during HF propagation. This also corroborates the steady-
state fracture propagation observed in viscoelastic media.19 An increase in the medium stiffness caused an increase in the fluid pressure and an increase in the fringe size and radius, which led to an increase in the SIF values as well. There was a slight difference between the SIF values and the medium toughness values obtained from the wire-cutting method at the rate of 50 mm/s (see Table 2) though the values are comparable. This can be attributable to the different ways of creating fractures and the different strain rate and fracture propagation velocity, associated with the energy loss of the viscoelastic gelatin media.
4. Results (II): layered medium
Fig. 6 through 11 show the results of HF propagation in the layered samples, where the pressure responses, time-lapsed images, and varia-tions in the SIF values are shown. The high-resolution, time-lapsed im-ages of all the HF experiments of the layered-medium cases are available in the Supporting Information (Movies S4–S9). In the same manner as in the homogeneous-medium cases, biwing fractures were initiated and propagated with the photoelastic fringes at the tips. The middle layer where the fracture was initiated was formed with the M-gelatin; there-fore, the early HF propagation was similar to that observed in the ho-mogeneous M case until the fracture approached the interfaces. The fracture initiation pressure and the initial SIF values were 55–70 kPa and ~1.5 kPa m0.5, respectively, and this was consistent with the
homoge-nous M case (Fig. 4b). However, the HF propagation behaviors, including the pressure and SIF responses, differed with the bounding- layer stiffness as the HF approached the interface and interacted with the bounding layers. Herein, the main observations are described with respect to the bounding-layer stiffness: (a) M2L case, (b) M2M case, and (c) M2H case and M2VH case.
4.1. M2L case: when the bounding layer has less stiffness than the propagating layer
In the M2L case, two fractures were initiated, and the upper fracture reached the interface faster than the lower fracture. Then, the upper fracture crossed the interface from the M-gelatin layer to the L-gelatin layer and continued to propagate in the L-gelatin (see Fig. 6b). A considerable pressure drop was noted immediately after the crossing of the interface, because the stiffness of the L-gelatin was less than that of the M-gelatin (Points B to C in Fig. 6a and c). Owing to this pressure drop, the propagation of the lower fracture in the M-gelatin almost stopped during the propagation of the upper fracture in the L-gelatin. Therefore, a stiffness contrast between geologic formation layers often caused preferential HF propagation in the less stiff medium. In addition, the reduced stiffness changed the fracture head geometry after crossing to a bigger fracture tip head with a wider width.
As expected, the initial SIF values were consistent with the homo-geneous M case, ~1.5–1.6 kPa m0.5, as shown in Fig. 6c. After crossing
the interface, the SIF of the upper fracture was significantly reduced from ~1.6 to ~0.5 kPa m0.5. The SIF values after the crossing became
close to the values obtained in the homogenous L case (i.e., 0.42 kPa m0.5, as in Fig. 5a). However, because the lower fracture stayed only in
the M-gelatin, its SIF values were fairly constant.
Fig. 6d details the photoelastic fringe patterns near the layer inter-face. A fringe change around the fracture head was observed across the layer interface. Because of the stiffness difference between the L-gelatin and M-gelatin, the fringe order and size in the L-gelatin layer were less and smaller than those in the M-gelatin layer (13.3 s in Fig. 6d). This indicates that the strain field around one fracture differed with the Fig. 5. SIF values, fluid pressure responses, and HF velocity from the
experi-mental cases of (a) L, (b) M, and (c) H: the upper and lower SIF values obtained from the fracture image are denoted with the variance bars.
medium stiffness, although the fluid pressure within the fracture applies the same level of stress in every direction. After crossing the interface, the lower fringe order and the smaller fringe size were observed in the bounding L-gelatin layer (13.62 s in Fig. 6d).
4.2. M2M case: when the bounding layer and propagating layer have the same stiffness
For the M2M case, the fracture behavior differed with the interfacial bonding condition. Figs. 7 through 9 present the results from three identical M2M samples (M2Ma, M2Mb, and M2Mc, respectively), but with different HF propagation behaviors.
In the M2Ma case, the upper fracture dilated, and the lower fracture crossed the interface, as shown in Fig. 7. The upper one first dilated along the interface before the lower one reached the interface. This caused the pressure drop (Points B to C in Fig. 7a). The lower fracture froze until the dilation of the upper one stopped, and then it propagated to the interface and crossed the interface. At this moment, the pressure slightly increased for fresh opening of the fracture in the bounding layer (Points C to D in Fig. 7a). From the SIF perspectives, when the lower fracture crossed the interface from the M-gelatin to the M-gelatin, the SIF value hardly changed, remaining ~1.5–1.7 kPa m0.5 before and after
crossing the interface (Fig. 7c).
In the M2Mb case, both fractures crossed the interfaces, as shown in Fig. 8. Only a minor pressure drop was observed, in a similar manner to
the homogeneous M case; thus, it was difficult to conclude whether this pressure drop was caused by the interface. In this case, no or minimal change in the fringe patterns was observed before and after crossing the interface, which resulted in the consistent SIF values of ~1.5–1.7 kPa m0.5, as in the homogeneous M case.
In the M2Mc case, both fractures dilated along the interface, as shown in Fig. 9. The upper fracture reached the interface faster than the lower one. Thereafter, the upper fracture was dilated first to the left direction and then to the right direction. During this dilation, the pres-sure significantly dropped (Points B to D in Fig. 9a). As the lower frac-ture reached and was arrested by the interface, the pressure increased (Points D to E in Fig. 9a). In a sudden moment (Point E in Fig. 9a), the lower fracture began to dilate the interface, resulting in the pressure drop (Points E to F in Fig. 9a).
The cases above clearly demonstrate that the bonding condition of the interfaces plays a critical role in determining the HF propagation behavior across the interface when the stiffness between the layers is in a similar range.
4.3. M2L case: M2H and M2VH cases: when the bounding layer has a greater stiffness than the propagating layer
In the M2H and M2VH cases, a fracture was arrested for a while at the interface and then propagated along the interface with dilation, as shown in Figs. 10 and 11. In particular, for the moment when the Fig. 6. Result of M2L case: (a) pressure response, (b) time-lapsed digital images of the fractures, (c) SIF values and pressure responses, and (d) fringe shape passing the interface — the fracture images in (b) correspond to the circle symbols in (a), the initiation pressure is denoted with Point A, and the gap in the SIF value of the upper fracture is due to the severe distortion in the fringe pattern at the fracture tip by the interface.
Fig. 7. Result of M2Ma case: (a) pressure response, (b) time-lapsed digital images of the fractures, and (c) SIF values and pressure responses — the fracture images in (b) correspond to the circle symbols in (a), the initiation pressure is denoted with Point A, and the gap in the SIF value of the upper fracture is due to the severe distortion in the fringe pattern at the fracture tip by the interface.
Fig. 8. Result of M2Mb case: (a) pressure response, (b) time-lapsed digital images of the fractures, and (c) SIF values and pressure responses — the fracture images in (b) correspond to the circle symbols in (a), the initiation pressure is denoted with Point A, and the gap in the SIF value of the upper fracture is due to the severe distortion in the fringe pattern at the fracture tip by the interface.
fracture was arrested, a pressure build-up was observed before the dilation took place. Thereafter, the subsequent dilation caused a sig-nificant pressure drop.
In the M2H case, the lower fracture dilated along the interface to the right direction (Point B in Fig. 10a), and the pressure dropped instantly. Thereafter, the fracture confinement took place with a gradual pressure increase, and then the lower fracture again dilated toward the left di-rection with a pressure drop (Points C to D in Fig. 10a). In the M2VH case, the fracture confinement was more clearly observed in association with pressure accumulation, which is possibly attributable to the greater stiffness of the bounding layer (Points B to C in Fig. 11a). In fact, the upper and lower fractures in the M2VH case were arrested at the interface by the bounding layer for more than 7 s, which was accom-panied by a significant increase in the pressure from ~70 to ~100 kPa. Thereafter, dilation of the lower fracture took place and caused a pres-sure decrease (Points C to D in Fig. 11a).
Fig. 11c captures the changes of the fringe pattern when HF was arrested and dilated in the M2VH case. During the period where the HF was arrested, the pressure accumulated. Therefore, the fringe pattern and size became tighter and larger, indicating the stress accumulation at
the fracture tip, while the HF was arrested for a few seconds at the interface (from 16.1 to 22.1 s in Fig. 11c). This elevated stress at the fracture tip caused the interfacial debonding and, consequently, facili-tated the dilation of the layer interface and the propagation along the interface. During the propagation along the discontinuity with interface dilation, the fringe formed at the HF tip; however, the fringe shape was no longer symmetric and differed because of the stiffness contrast (from 24.9 to 25.1 s in Fig. 11c).
5. Discussions
5.1. SIF analysis in a homogeneous medium
The SIF represents the overall intensity of the stress distribution at the fracture tip, and the critical SIF, the minimum SIF value required for spontaneous growth, is defined as the fracture toughness of a material. Thus, the material fracture toughness can be considered as the resistance to crack growth. Based on the fracture energy balance,53 a fracture grows when the SIF exceeds the fracture toughness. In the following, three salient observations are discussed in relation to the SIF. Fig. 9. Result of M2Mc case: (a) pressure response and (b) time-lapsed digital images of the fractures — the fracture images in (b) correspond to the circle symbols in (a) and the initiation pressure is denoted with Point A.
Fig. 10. Result of M2H case: (a) pressure response and (b) time-lapsed digital images of the fractures — the fracture images in (b) correspond to the circle symbols in (a) and the initiation pressure is denoted with Point A.
First, no or only a minimal variation in SIF was observed during the steady-state propagation of HF in all the homogeneous-medium cases (see Fig. 5). During quasi-static growth of hydraulic fracture, the steady- state SIF is a feature that can be found in a toughness-dominant HF case.46,54 This also has relevance to the steady-state HF propagation velocity.
Initiation and propagation of a HF in viscoelastic media can be conceptualized, as shown in Fig. 12, although very weak fringe patterns during the fracture initiation stage and the early propagation stage prevented the SIF computation. Before the fracture initiation, the SIF increases with increasing fluid injection pressure. When the SIF exceeds the material fracture toughness, a fracture is initiated and the propa-gation velocity gradually increases. When the velocity becomes stable after the peak pressure, the SIF is kept consistent during the steady-state
propagation.
Second, the photoelastic fringe analysis enabled the real-time monitoring of SIF values during fracture propagation in the gelatin media. It is worth noting that the SIF values were slightly greater than the fracture toughness measured from the wire cutting method, and such difference became greater with an increase in the gelatin stiffness. Although the both are in similar ranges, the wire cutting method appeared to have limited applicability to our HF propagation conditions. This is mainly attributable to different strain rate and fracture propa-gation velocity, associated with the material viscosity, as the fracture toughness of viscoelastic materials show strain rate-dependent characteristics.55–57
Third, the SIF increased with an increase in the fluid pressure as the medium stiffness increased (see Fig. 5). This is corroborated by previous Fig. 11. Result of M2VH case: (a) pressure response, (b) time-lapsed digital images of the fractures, and (c) fringe shape passing the interface — the fracture images in (b) correspond to the circle symbols in (a) and the initiation pressure is denoted with Point A.
studies.19,58 For instance, the average fluid pressures during the steady-state propagation were 29 kPa for L-gelatin, 65 kPa for M-gelatin, and 84 kPa for H-gelatin. According to the fluid pressure, the SIF value also increased to 0.42 kPa m0.5 for L-gelatin, 1.5 kPa m0.5 for M-gelatin,
and 2 kPa m0.5 for H-gelatin. The SIF is proportional to the stress level near the fracture tip, and the fluid pressure can be interpreted as an internal stress. Therefore, the SIF is expected to have a linear correlation with the fluid pressure. To examine this, an additional experiment was conducted with a greater injection rate of 40 mL/min for the M-gelatin sample (Fig. S1 in the Supporting Information). The fluid pressure during the steady-state propagation was approximately 100 kPa, greater than that with a flow rate of 10 mL/min. As a result, the SIF also increased to 2.5 kPa m0.5. As shown in Fig. 13, a linear correlation
be-tween the SIF and the fluid pressure was confirmed.
5.2. Effect of the contrasts in stiffness/fracture toughness on fracture containment behavior
The experiment results clearly demonstrate that the stiffness contrast and the resulting toughness contrast between the propagating layer and the bounding layer have a profound effect on interactions between HF and the pre-existing interface. Note that the fracture toughness increases with an increase in elastic stiffness of rocks, thus the stiffer rocks generally have the higher toughness.59 Two contrasting fracture containment behaviors — crossing versus dilating/arrested — were observed, depending on the toughness contrast from the propagating layer to the bounding layer across the interface. These behaviors can be predicted by comparing the SIF of the bounding layer required for fracture growth and the concurrent SIF of the propagating layer. Herein, the steady-state SIF values estimated in the homogeneous L-, M − , and H-gelatin cases are considered as the SIF values required for fracture growth.
The fracture crosses the interface between the layers when the fracture toughness decreases from the propagating layer to the bounding layer across the interface. It fulfills the fracture growth condition, because the concurrent SIF is greater than the required SIF of the bounding layer. For instance, in the M2L case, the SIF in the propagating
M-gelatin layer near the interface was ~1.6 kPa m0.5. The required SIF of
the bounding L-gelatin layer was ~0.42 kPa m0.5, less than that in the
propagating layer. Thus, the HF passed the interface and propagated in the bounding layer. After the crossing, the injection pressure and the SIF value decrease while the fracture width becomes wider because of the reduced stiffness. In the M2L case, where two fractures (bi-wing frac-tures) were initially generated, one fracture was contained in the propagating medium while the other fracture crossed the interface to the softer bounding layer. This is mainly due to the reduced fluid pressure and SIF. Furthermore, we observed a reduction in the photoelastic fringe size at the contained fracture tip though it was little, while the other fracture crossing (Movie S4 in Supplementary Information). Therefore, in the cases with multiple fracture growth, decreases in medium stiffness or fracture toughness across a discontinuity can cause preferential HF propagation in the softer medium owing to the reduced SIF and fluid pressure.
In addition, the lower toughness implies the faster fracture growth.60 As the HF propagation regime is toughness-dominant, the M2L case confirms a rapid growth of the HF during the early stage of crossing, attributable to the reduced toughness (see Movie S4 in Supplementary Information). Thereafter, as HF propagation reaches a steady state, the HF propagation velocity is mostly controlled by the fracture geometry and injection flow rate. On the other hand, the reduced stiffness of the bounding layer plays a predominant role for the increased fracture width and the enlarged fracture tip size.61,62
By contrast, the fracture is arrested by the bounding layer and/or dilating the discontinuity (or interface) while propagating along the interface when the fracture toughness increases from the propagating layer to the bounding layer. For example, in the M2H case, the fracture could not pass the interface, because the required SIF of the bounding H- gelatin layer was 2 kPa m0.5, greater than the concurrent SIF in the
propagating M-gelatin layer. At the moment at which HF is arrested, the fluid pressure increases owing to the constant flow rate applied. Given the positive correlation between the SIF and fluid pressure, it is expected that the SIF also increases with the pressure increase. As soon as the HF propagates along the interface, dilating the interface, the fluid pressure drops. These trends are consistent with the previous researches.63–65
It is worth pointing out that in less-viscous, brittle materials, the effect of medium stiffness on fracture propagation and containment behaviors across a discontinuity is consistent with our observations with viscoelastic gelatin media.66–68 Similar to the viscoelastic media, as shown in our study, when HF propagates from a low-stiffness brittle medium to a high-stiffness brittle medium, the HF is either arrested or dilates the interface. When HF propagates from a high-stiffness to a low-stiffness brittle medium, the HF crosses the interface.
Fig. 12. Conceptual figure for the fluid pressure, HF velocity, and SIF values from the experimental case of M: the fracture images in the figure correspond to the point in the pressure curve.
However, it is found that the main differences of viscoelastic mate-rials from brittle matemate-rials are the pressure response after breakdown (creating new fracture in a bounding layer) and the fracture width change. When HF crosses the interface from a stiff layer to a soft layer, it can be considered as creation of a new fracture, which is associated with a pressure drop after the breakdown pressure. Tan et al.68 present the sudden and abrupt multiple pressure drops after breakdown pressures as the HF crosses the interfaces from tight sandstone layers to coal layers in the sandstone-coal interbedded formation. By contrast, in spite of the large stiffness contrast in our study, the pressure drop is relatively gentle when crossing a discontinuity in viscoelastic media (see Fig. 6c), compared to brittle materials, such as tight sandstones.
On the other hand, Athavale and Miskimins66 and Afsar67 observed no significant changes in fracture width in brittle materials when the fracture crossed from a stiff layer to a soft layer, and this is consistent with the numerical simulation results by Guo et al.63 and Shan et al.64 By contrast, we observed an increase in fracture width when the fracture crosses from a stiff layer to a soft layer, mainly attributable to the greater stiffness contrast. However, caution is required here because it is not clear whether this width difference is attributable to the viscoelastic characteristic, different from brittle materials, or due to the large stiff-ness contrast.
5.3. Debonding between the layers or creating a fresh fracture?
The layered-medium cases with no stiffness contrast show that the interfacial bonding condition plays a significant role in determining the HF propagation behavior across the interface. Although the bounding and propagating layers have the same stiffness and toughness, a fracture can either dilate the interface (e.g., the M2Mc case) or cross the interface (e.g., the M2Mb case). It is presumed that the relative easiness of debonding the layer interface against creating a fresh fracture in the bounding layer determines the fracture containment behavior.
HF causes uneven deformation at the interface when approaching the interface, as can be seen in the distorted photoelastic fringe patterns near the interface. When the interfacial bonding between the layers is weak, HF can readily debond the layer interface and, therefore, generate a dilated, open space along which the fluid can preferentially flow. At the moment when this dilation occurs, the pressure significantly de-creases, because the debonded and dilated interface facilitates the fluid flow.
By contrast, let us assume that the interfacial bonding is sufficiently strong, such that debonding is not achievable with a given fluid pres-sure. If the concurrent SIF is less than the fracture toughness of the bounding layer, HF is expected to be arrested by the interface for the moment. However, the fluid pressure soon builds up, and the current SIF becomes greater than the fracture toughness of the bounding layer; therefore, HF is expected to cross the interface, creating a fresh fracture in the bounding layer. In such a case, the pressure and SIF hardly change upon the crossing.
Therefore, two competing factors are the debonding of the layer interface and the creating of a fresh fracture in the bounding layer across the interface. The relative easiness between them determines the frac-ture behavior — whether it dilates or crosses. This is consistent with the results by Fu et al.,69 which shows that the bonding state affects the HF propagation across the discontinuity. Furthermore, crossing and dilation can take place simultaneously under a certain condition; particularly, Fu et al.69 showed that HF crosses a partially bounded interface but with some dilation while HF crosses a fully bonded interface with little dilation. Meanwhile, in some cases, it has been reported that the HFs can cross the interface and propagate to a stiffer bounding layer.70–72 This is because other factors can also have an effect on the behavior, such as the bonding strength of the interface, incident angle of the propagating HF to the interface, and in situ stress.
6. Conclusions
This study explored the HF propagation across discontinuities in viscoelastic layered media with the photoelastic analysis.
• The SIF was observed to be constant during the steady-state HF propagation, which is a unique feature in viscoelastic media. Also, the fracture toughness of gelatin was directly computed from the real- time SIF values by using photoelastic fringes. In addition, a linear correlation between the SIF and the fluid pressure was confirmed. • The contrast of fracture toughness from the propagating layer to the
bounding or encountering layer determined the HF containment behavior across a discontinuity. The fracture crossed the disconti-nuity when an HF encountered a bounding layer with a lower toughness. By contrast, the fracture was arrested by the bounding layer and/or dilating the discontinuity when an HF encountered a bounding layer with a higher toughness.
• The relative easiness between the debonding of a layer interface and creating a fresh fracture in the bounding layer determined the frac-ture containment behavior — whether HF dilated or crossed. When the interfacial bonding was weak, the debonding between the layers was achieved, which caused the dilation. However, when the inter-facial bonding was sufficiently strong, the fracture tended to cross the interface.
This study provided unique experimental data with high-quality photoelastic fringe images, and the data are comparable to analytical or numerical models. Furthermore, the results contribute to a better understanding of the HF propagation behaviors in viscoelastic media and the HF containment behaviors across a discontinuity.
Declaration of competing interest
The authors declare that they have no known competing financial interests or personal relationships that could have appeared to influence the work reported in this paper.
Acknowledgement
All of the video data, fluid pressure, SIF, and HF velocity values ac-quired during the experiment are archived in the website (kwon.kaist. ac.kr) and Mendeley Data (https://data.mendeley.com/) with the proj-ect name ‘Data of the hydraulic fracturing propagation across a discontinuity in layered formations’ (https://doi.org/10.17632/rhf 44kpmbn.1). These data can be also requested by e-mail (t.kwon@ka ist.ac.kr). This research was supported by the Basic Research Labora-tory Program through the National Research Foundation of Korea (NRF) funded by the MSIT (NRF-2018R1A4A1025765) and by a grant (19CTAP-C151917-01) from Technology Advancement Research Pro-gram (TARP) funded by Ministry of Land, Infrastructure and Transport of Korean government.
Appendix A. Supplementary data
Supplementary data to this article can be found online at https://doi. org/10.1016/j.ijrmms.2020.104438.
References
1 Dusterhoft R, Chapman B. Fracturing high-permeability reservoirs increases productivity. Oil Gas J. 1994;92(25).
2 Li Q, Xing H, Liu J, Liu X. A review on hydraulic fracturing of unconventional reservoir. Petrol Times. 2015;1(1):8–15.
3 Rummel F, Kappelmeyer O. The Falkenberg geothermal frac project: concepts and experimental results. In: Nemat-Nasser S, Abe H, Hirakawa S, eds. Hydraulic
Fracturing and Geothermal Energy. Dordrecht: Springer; 1983:59–74.
4 Li M, Lior N. Analysis of hydraulic fracturing and reservoir performance in enhanced geothermal systems. J Energy Resour Technol. 2015;137(4), 041203.
5 Stow SH, Haase CS, Weeren H. Waste Disposal by Hydrofracture and Application of the Technology to the Management of Hazardous Wastes. Tennesse: University of North Texas Ligraries; 1985.
6 Warpinski NR, Teufel LW. Influence of geologic discontinuities on hydraulic fracture propagation. J Petrol Technol (JPT). 1987;39(2):209–220.
7 Jeffrey G, Bunger A, LeCampion B, et al. Measuring hydraulic fracture growth in naturally fractured rock. Soc Petrol Eng. 2009:SPE124919.
8 Thiercelin J, Roegiers C, Boone J, Ingraffea R. An investigation of the material parameters that govern the behavior of fractures approaching rock interfaces. In: 6th
ISRM Congress. Montreal, Canada; 30 August-3 September. 1987. 1987, January.
9 Chuprakov D, Melchaeva O, Prioul R. Hydraulic fracture propagation across a weak discontinuity controlled by fluid injection. In ISRM International Conference for Effective and Sustainable Hydraulic Fracturing. Brisbane, Australia; 20-22 May. 2013.
10 Sih GC. Methods of Analysis and Solution of Crack Problems: Recent Developments in
Fracture Mechanics, Theory and Methods of Solving Crack Problems. Springer; 1973.
11 Murakami Y, Keer L. Stress intensity factors handbook. J Appl Mech. 1993;60(4): 1063.
12 Taisne B, Tait S. Effect of solidification on a propagating dike. J Geophys Res Solid
Earth. 2011;116(1).
13 Gerberich W. Stress distribution about a slowly growing crack determined by photoelastic-coating method. Exp Mech. 1962;2(12):359–365.
14 Smith C. Use of three dimensional photoelasticity and progress in related areas. Exp
Tech FR. 1975;2:3–58.
15 Shukla A. High-speed fracture studies on bimaterial interfaces using photoelasticity—a review. JSA. 2001;36(2):119–142.
16 Ju Y, Xie H, Zhao X, et al. Visualization method for stress-field evolution during rapid crack propagation using 3D printing and photoelastic testing techniques. Sci Rep. 2018;8(1):4353.
17 Sone H, Zoback M. Mechanical properties of shale-gas reservoir rocks—Part 2: ductile creep, brittle strength, and their relation to the elastic modulus. Geophysics. 2013;78(5):D393–D402.
18 Bai M. Why are brittleness and fracability not equivalent in designing hydraulic fracturing in tight shale gas reservoirs. Petroleum. 2016;2(1):1–19.
19 Ham SM, Kwon TH. Characteristics of steady-state propagation of hydraulic fractures in ductile elastic and two-dimensionally confined plate media. Int J Rock Mech Min. 2019;114:164–174.
20 Niordson C. Analysis of steady-state ductile crack growth along a laser weld. Int J
Fract. 2001;111(1):53–69.
21 Lai Y, Zheng Z, Dressaire E, Wexler S, StoneA. Experimental study on penny-shaped fluid-driven cracks in an elastic matrix. Proc Math Phys Eng Sci. 2015;471(2182): 20150255.
22 Xu T, Ranjith P, Au A, et al. Numerical and experimental investigation of hydraulic fracturing in Kaolin clay. J Petrol Sci Eng. 2015;134:223–236.
23 Konno Y, Jin Y, Yoneda J, Uchiumi T, Shinjou K, Nagao J. Hydraulic fracturing in methane-hydrate-bearing sand. RSC Adv. 2016;6(77):73148–73155.
24 Teufel LW, Clark JA. Hydraulic fracture propagation in layered rock: experimental studies of fracture containment. Soc Petrol Eng J. 1984;24:19–32, 01.
25 Chang KH, Liao HT, Chen JP. Preparation and characterization of gelatin/hyaluronic acid cryogels for adipose tissue engineering: in vitro and in vivo studies. Acta
Biomater. 2013;9(11):9012–9026.
26 Ge S, Li, , et alXiong L. Enhanced mechanical properties and gelling ability of gelatin hydrogels reinforced with chitin whiskers. Food Hydrocolloids. 2018;75:1–12. 27 Pollard DD. Derivation and evaluation of a mechanical model for sheet intrusions.
Tectonophysics. 1973;19(3):233–269.
28 Kervyn M, Ernst GGJ, Van Wyk De Vries B, Mathieu L, Jacobs P. Volcano load control on dyke propagation and vent distribution: insights from analogue modeling.
J Geophys Res Solid Earth. 2009;114(3).
29 Kavanagh J, Menand T, Daniels KA. Gelatine as a crustal analogue: determining elastic properties for modelling magmatic intrusions. Tectonophysics. 2016;582: 101–111.
30 Goh SM, Charalambides MN, Williams JG. On the mechanics of wire cutting of cheese. Eng Fract Mech. 2005;72(6):931–946.
31 Farquharson FB, Hennes RG. Gelatin models for photoelastic analysis of stress in earth masses. Civ Eng. 1940;10(4):211–214.
32 Crisp JD. The use of gelatin models in structural analysis. Proc Inst Mech Eng. 1953; 167(1b):580–604.
33 Righetti R, Ophir J, Srinivasan S, Krouskop TA. The feasibility of using elastography for imaging the Poisson’s ratio in porous media. Ultrasound Med Biol. 2004;30(2): 215–228.
34 Irwin G. Discussion of the dynamic stress distribution surrounding a running crack-A photoelastic analysis. SESA Proc. 1958;16:93–96.
35 Lide DR. CRC Handbook of Chemistry and Physics. Boca Raton: CRC Boca Raton; 2012. 36 Zhou J, Chen M, Jin Y, Zhang GQ. Analysis of fracture propagation behavior and
fracture geometry using a tri-axial fracturing system in naturally fractured reservoirs.
Int J Rock Mech Min. 2008;45(7):1143–1152.
37 Zhang Z, Ghassemi A. Simulation of hydraulic fracture propagation near a natural fracture using virtual multidimensional internal bonds. Int J Numer Anal Methods
GeoMech. 2011;35(4):480–495.
38 Jiang T, Zhang J, Wu H. Experimental and numerical study on hydraulic fracture propagation in coalbed methane reservoir. J Nat Gas Sci Eng. 2016;35:455–467. 39 Llanos EM, Jeffrey RG, Hillis R, Zhang X. Hydraulic fracture propagation through an
orthogonal discontinuity: a laboratory, analytical and numerical study. Rock Mech
Rock Eng. 2017;50(8):2101–2118.
40 Sanford RJ, Dally JW. A general method for determining mixed-mode stress intensity factors from isochromatic fringe patterns. Eng Fract Mech. 1979;11(4):621–633.
41 Limtrakarn W, Dechaumphai P. Adaptive finite element method to determine KI and KII of crack plate with different E inclusion/E plate ratio. Trans Can Soc Mech Eng. 2011;35(3):355–368.
42 De Pater C, Cleary M, Quinn T, Barr D, Johnson D, Weijers L. Experimental verification of dimensional analysis for hydraulic fracturing. SPE Prod Facil. 1994;9 (4):230–238.
43 Soulsby D. Technical Review: Borehole Drilling and Rehabilitation under Field Conditions.
Tech Geneva. Switzerland: ICRC; 2010.
44 Gallegos TJ, Varela BA. Trends in Hydraulic Fracturing Distributions and Treatment Fluids, Additives, Proppants, and Water Volumes Applied to Wells Drilled in the United States from 1947 through 2010: Data Analysis and Comparison to the Literature. US: USGS; 2015.
45 Detournay E. Propagation regimes of fluid-driven fractures in impermeable rocks. Int
J GeoMech. 2004;4(1):35–45.
46 Detournay E. Mechanics of hydraulic fractures. Annu Rev Fluid Mech. 2016;48: 311–339.
47 Shovkun I, Espinoza E. Propagation of toughness-dominated fluid-driven fractures in reactive porous media. Int J Rock Mech Min. 2019;118:42–51.
48 Garagash DI. Propagation of a plane-strain hydraulic fracture with a fluid lag: early- time solution. Int J Solid Struct. 2006;43(18-19):5811–5835.
49 Spacapan JB, Galland O, Leanza HA, Planke S. Control of strike-slip fault on dyke emplacement and morphology. J Geol Soc. 2016;173(4):573–576.
50 Bertelsen HS, Rogers BD, Galland O, Dumazer G, Benanni AA. Laboratory modeling of coeval brittle and ductile deformation during magma emplacement into viscoelastic rocks. Front Earth Sci. 2018;6:199.
51 Ha SJ, Choo J, Yun TS. Liquid CO2 fracturing: effect of fluid permeation on the breakdown pressure and cracking behavior. Rock Mech Rock Eng. 2018;51(11): 3407–3420.
52 Shelley D. Optical Mineralogy. Elsvier; 1985.
53 Griffith AA. The phenomena of rupture and flow in solids. Philos Trans R Soc Lond -
Ser A Contain Pap a Math or Phys Character. 1921:163–198.
54 Lecampion B, Desroches J, Jeffrey RG, Bunger AP. Experiments versus theory for the initiation and propagation of radial hydraulic fractures in low-permeability materials. J Geophys Res Solid Earth. 2017;122(2):1239–1263.
55 Lefranc M, Bouchaud E. Mode I fracture of a biopolymer gel: rate-dependent dissipation and large deformations disentangled. Extrem Mech Lett. 2014;1:97–103. 56 Bayoumi MR, Bassim MN. Strain rate dependence of fracture toughness (JIC) and
ductility. In: Modelling Problems in Crack Tip Mechanics. 1984:173–181.
57 Landis CM, Pardoen T, Hutchinson JW. Crack velocity dependent toughness in rate dependent materials. Mech Mater. 2000;32(11):663–678.
58 Hubbert MK, Willis DG. Mechanics of hydraulic fracturing. In: Underground Waste
Management and Environmental Implications. AAPG; 1972:239–257.
59 Anderson TL. Fracture Mechanics: Fundamentals and Applications. CRC press; 2017. 60 Kanaun S. Discrete model of hydraulic fracture crack propagation in homogeneous
isotropic elastic media. Int J Eng Sci. 2017;110:1–14.
61 Perkins T, Kern L. Widths of hydraulic fractures. J Petrol Technol. 1961;13:937–949, 09.
62 Nordgren R. Propagation of a vertical hydraulic fracture. Soc Petrol Eng J. 1972;12: 306–314, 04.
63 Guo J, Luo B, Lu C, Lai J, Ren J. Numerical investigation of hydraulic fracture propagation in a layered reservoir using the cohesive zone method. Eng Fract Mech. 2017;186:195–207.
64 Shan Q, Jin Y, Tan P, Zhang R. Experimental and numerical investigations on the vertical propagation of hydraulic fractures in laminated shales. J Geophys Eng. 2018; 15(4):1729–1742.
65 Huanqiang Y, Hui Z. Investigation of the behavior of vertical fracture penetration/ deflection at the interface between coal seam and mudstone layers. Strength Fract
Complex. 2018;12(1):1–13.
66 Athavale AS, Miskimins JL. Laboratory hydraulic fracturing tests on small homogeneous and laminated blocks. In: The 42nd US Rock Mechanics Symposium. San
Francisco, California; 29 June-2 July. 2008. 2008, January.
67 Afsar F. Fracture Propagation and Reservoir Permeability in Limestone-Marl Alternations of the Jurassic Blue Lias Formation (Bristol Channel Basin, UK) [dissertation]. G¨ottingen, Germany: Georg-August-Universit¨at G¨ottingen; 2015.
68 Tan P, Jin Y, Yuan L, et al. Understanding hydraulic fracture propagation behavior in tight sandstone–coal interbedded formations: an experimental investigation. Petrol
Sci. 2019;16(1):148–160.
69 Fu W, Ames BC, Bunger AP, Savitski AA. Impact of partially cemented and non- persistent natural fractures on hydraulic fracture propagation. Rock Mech Rock Eng. 2016;49(11):4519–4526.
70 Warpinski NR, Schmidt RA, Northrop DA. In-situ stresses: the predominant influence on hydraulic fracture containment. J Petrol Technol. 1982;34(3):653–664. 71 Fung R, Vilayakumar S, Cormack DE. Calculation of vertical fracture containment in
layered formations. SPE Form Eval. 1987;2:518–522, 04.
72 Zhao H, Chen M. Extending behavior of hydraulic fracture when reaching formation interface. J Petrol Sci Eng. 2010;74(1-2):26–30.
73 Al Tammar MJ. Experimental Studies in Hydraulic Fracture Growth: Fundamental Insights and Validation Experiments for Geomechanical Models. Doctoral dissertation in the University of Texas at Austin; 2019.
74 Gu H, Weng X, Lund JB, Mack MG, Ganguly U, Suarez-Rivera R. Hydraulic fracture crossing natural fracture at nonorthogonal angles: a criterion and its validation. SPE
Prod Oper. 2012;27(1):20–26.
75 Cheng W, Jin Y, Chen Y, Zhang Y, Diao C, Wang Y. Experimental investigation about influence of natural fracture on hydraulic fracture propagation under different fracturing parameters. In: ISRM International Symposium-8th Asian Rock Mechanics
76 Kear J, Kasperczyk D, Zhang X, Jeffrey RG, Chuprakov D, Prioul R. 2D experimental and numerical results for hydraulic fractures interacting with orthogonal and inclined discontinuities. In: 51st US Rock Mechanics/Geomechanics Symposium. San
Francisco, California, USA. 25-28 June. 2017.
77 Olson JE, Bahorich B, Holder J. Examining hydraulic fracture: natural fracture interaction in hydrostone block experiments. In: SPE Hydraulic Fracturing Technology
Conference. Texas, USA: The Woodlands; 6-8 February. 2012.
78 Lee HP, Olson JE, Holder J, Gale JF, Myers RD. The interaction of propagating opening mode fractures with preexisting discontinuities in shale. J Geophys Res Solid
Earth. 2015;120(1):169–181.
79 Guo T, Zhang S, Qu Z, Zhou T, Xiao Y, Gao J. Experimental study of hydraulic fracturing for shale by stimulated reservoir volume. Fuel. 2014;128:373–380. 80 Ning L, Shicheng Z, Yushi Z, Xinfang M, Shan W, Yinuo Z. Experimental analysis of
hydraulic fracture growth and acoustic emission response in a layered formation.