저작자표시-비영리-변경금지 2.0 대한민국 이용자는 아래의 조건을 따르는 경우에 한하여 자유롭게 l 이 저작물을 복제, 배포, 전송, 전시, 공연 및 방송할 수 있습니다. 다음과 같은 조건을 따라야 합니다: l 귀하는, 이 저작물의 재이용이나 배포의 경우, 이 저작물에 적용된 이용허락조건 을 명확하게 나타내어야 합니다. l 저작권자로부터 별도의 허가를 받으면 이러한 조건들은 적용되지 않습니다. 저작권법에 따른 이용자의 권리는 위의 내용에 의하여 영향을 받지 않습니다. 이것은 이용허락규약(Legal Code)을 이해하기 쉽게 요약한 것입니다. Disclaimer 저작자표시. 귀하는 원저작자를 표시하여야 합니다. 비영리. 귀하는 이 저작물을 영리 목적으로 이용할 수 없습니다. 변경금지. 귀하는 이 저작물을 개작, 변형 또는 가공할 수 없습니다.
Iron overload by transferrin receptor protein 1 regulation
plays an important role in palmitate-induced insulin
resistance in human skeletal muscle cells
by
CUIRIHUA
Major in Medicine
Department of endocrinology and cell metabolism
The Graduate School, Ajou University
Iron overload by transferrin receptor protein 1 regulation
plays an important role in palmitate-induced insulin
resistance in human skeletal muscle cells
by
CUIRIHUA
A Dissertation Submitted to The Graduate School of Ajou University in Partial
Fulfillment of the Requirements for the Degree of Ph.D. in Endocrinology and
cell metabolism
Supervised by
Kwan Woo Lee, M.D., Ph.D.
Major in Medicine
Department of Endocrinology and cell metabolism
The Graduate School, Ajou University
The doctoral thesis of CUIRIHUA
in Medicine is hereby approved.
Thesis Defense Committee President
Yup Kang
Member Choon-Hee Chung
Member Hae Jin Kim
Member Sung-E Choi
Member Kwan-Woo Lee
The Graduate School, Ajou University
November, 23th, 2018
i - ABSTRACT –
Iron overload by transferrin receptor protein 1 regulation plays an
important role in palmitate-induced insulin resistance in human
skeletal muscle cells
Free fatty acid is considered one of the major pathogenic factors inducing insulin resistance. The association between iron disturbances and insulin resistance has recently begun to receive a lot of attention. Although skeletal muscle is a major tissue for iron utilization and storage, the role of iron in palmitate (PA)-induced insulin resistance is unknown. We investigated the molecular mechanism underlying iron dysregulation in PA-induced insulin resistance. Intracellular iron was measured using calcein AM and transferrin-GFP. Iron and calcium chelator or siRNA were used to investigate the effects of iron metabolism on insulin sensitivity. Intracellular calcium was detected using Fluo-3 AM. PA induced insulin resistance and simultaneously increased intracellular iron. The iron chelator, deferoxamine dramatically inhibited PA-induced insulin resistance, and iron donors impaired insulin sensitivity by activating JNK. PA upregulated tfR1 through IRP2. Knockdown of tfR1 and IRP2 prevented PA-induced iron uptake and insulin resistance. PA also translocated the tfR1-GFP protein complex by stimulating calcium influx, but the BAPTA-AM dramatically reduced iron overload by inhibiting transferrin translocation and subsequent insulin resistance. PA induces insulin resistance through iron overload, reducing intracellular iron protected cells against insulin resistance. Therefore, blocking iron overload may be a useful strategy for preventing insulin resistance and diabetes.
Key words: Iron overload, Insulin resistance, Transferrin receptor, calcium, Human
ii
CONTENTS
ABSTRACT ··· ⅰ CONTECTS ··· ⅱ LIST OF TABLES ··· Ⅳ
Iron overload by transferrin receptor protein 1 regulation plays an important role in palmitate-induced insulin resistance in human skeletal muscle cells
ⅠINTRODUCTION ··· 2
ⅠI METERIALS AND METHODS ··· 27
A.METERIALS ··· 28 B.METHODS ··· 29 Preparation of PA ··· 29 Cell culture ··· 29 Myotube staining ··· 29 Immunoblot analysis ··· 30
RNA isolation, quantitative real-time PCR, and semi-quantitative reverse transcriptase-PCR ··· 30
Transfection of siRNA ··· 31
Uptake of 2-NBDG by HSMMs ··· 31
Measurement of intracellular labile iron pool ··· 31
Animal model and insulin tolerance tests ··· 32
iii
Study subjects and skeletal muscle biopsy ··· 33
Measurement of intracellular calcium levels ··· 33
Analysis of GFP-labeled iron and Tf complex uptake ··· 34
Statistical analyse ··· 34
Table 1. Nucleotide sequences of sets for real-time PCR ··· 35
Table 2. Nucleotide sequences of sets and reaction condition for semi-quantitative PCR · 36 Table 3. Nucleotide wequence of siRNA ··· 37
Ⅲ.RESULTS ··· 38
A. Human skeletal muscle myoblasts differentiation ··· 39
B. PA treatment induces insulin resistance in HSMMs ··· 41
C. PA increases intracellular iron levels ··· 43
D. Excess iron induces insulin resistance ··· 45
E. Knockdown of tfR1 protects cells from excess iron-induced insulin resistance ··· 50
F. TfR1 is overexpressed in diabetic muscle ··· 52
G. IRP2 is essential for tfR1 induction by PA stimulation ··· 54
H. Calcium flux regulates tfR1-mediated iron overload to induce insulin resistance ··· 58
I. Excess intracellular iron stimulates JNK activation, which is inhibited by DFO ··· 67
Ⅳ.DISCUSSION ··· 70
Ⅴ.CONCLUSION ··· 76
Ⅵ.REFERENCES ··· 78
iv
List of Abbreviations
BSA
Bovine serum albumin
PA
Palmitate
HSMMs
Human skeletal muscle myoblasts
LIP
Labile iron pool
TfR1
Transferrin receptor
FTH
Heavy chain of ferritin
IRP1
Iron regulatory protein 1
IRP2
Iron regulatory protein 2
IRE
Iron-responsive element
UTR
Untranslated region
TF
Transferrin
DMT1
Divalent metal transporter
FPN
Ferroportin
DS
Deferasirox
DFO
Deferoxamine
FeSO4
Ferrous sulfate, FS
FeCl3
Ferric chloride, FC
SOC
Store-operated channels
ITT
Insulin tolerant test
2-NBDG
2-[N-(7-nitrobenz-2-oxa-1,3-diazol-4-yl)amino]2-deoxyglucose
ER
Endoplasmic reticulum
FFA
Free fatty acid
SiRNA
Small interference RNA
qPCR
Quantitative PCR;
IR
Insulin receptor
BM
Bitter melon
v
NAFLD
Nonalcoholic fatty liver disease
BME
Bitter melon extract
PA
Palmitate
HF/HFr
High-fat/high-fructose
ER
Endoplasmic reticulum
TG
Triglyceride
ALT
Alanine aminotransferase
NASH
Nonalcoholic steatohepatitis
FFA
Free fatty acids
UPR
Unfolded protein response
BiP
Binding immunoglobulin protein
HSP70
heat-shock protein-70
IRE1
Inositol requiring enzyme-1
PERK
Protein kinase ribonucleic acid-like
endoplasmic reticulum kinase
ATF6
activating transcription factor 6
CHOP
C/EBP homologous protein
TUNEL
Terminal deoxynucleotidyl
1
Iron overload by transferrin receptor protein 1 regulation plays an
important role in palmitate-induced insulin resistance in human
2
3
1. Pathogenesis of Diabetes Millitus
Type 2 diabetes is reaching epidemic proportions worldwide. According to the World Health Organization, about 8% of the world’s population suffered from type 2 diabetes in 2014, and already causes 5 million deaths per year, mostly from cardiovascular diseases ( L. Guariguata, et al., 2014). The longer diabetes duration, the higher the risk of complications, which may disable or even life-threaten. Possible complications include: cardiovascular disease, nerve damage (neuropathy), kidney damage (nephropathy), eye damage (retinopathy), foot damage, skin conditions, hearing impairment, Alzheimer's disease. (Aastha Chawla, et al., 2016) Generally, behavioral and environmental factors exert complimentary role for modulating the genetic susceptibility and diabetes risk. Although the exact mechanism underlying pathogenesis remain largely unknown, type 2 diabetes mellitus is believed to be caused by relative insulin deficiency and subsequent insufficient compensation, which results partly from pancreatic β cells failure, against insulin resistance.
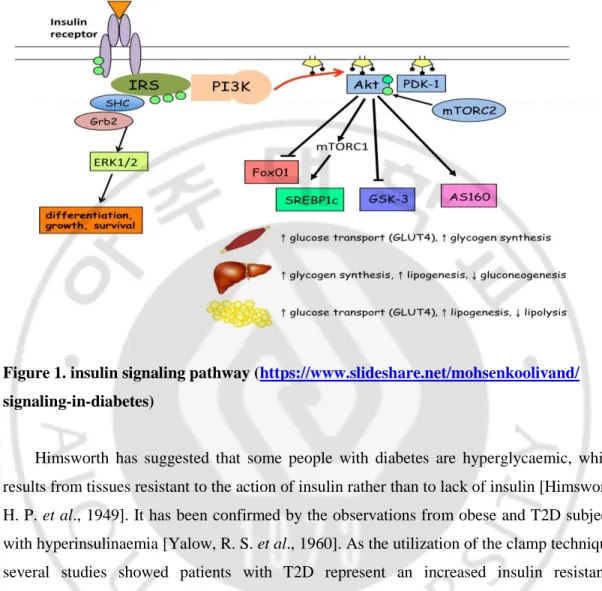
Most of the food we eat is broken down into glucose, the main energy source of our body. After digestion, high blood glucose stimulate pancreas to produce appropriate amount of insulin to transport glucose from blood into cells. Insulin mainly worked on the liver, muscle and adipose tissue to trigger those tissues to uptake glucose through glucose transporter. Excess glucose in the bloodstream stimulates glucose stores as glycogen in the liver, muscle and fat cells via activation of the hexokinase, phosphofructokinase and glycogen synthase and inhibition of glucose-6-phosphatase. These stores can then be utilized when energy requirements are higher or fasting conditions. When glucose is saturated with glycogen in the liver, the additional glucose is stores as fat in liver, muscle and fat cells via
de novo fat synthesis. Since there is high amount of blood glucose, gluconeogenesis in the
liver is prohibited in the physical condition and amino acids were saved [Victoria L et al., 2018]. On the other hand, insulin, as a powerful anabolic signal stimulates amino acids uptake and protein synthesis. It activates mTOR pathway and inhibits autophagy, including lysosomal degradation of proteins and organelles. Furthermore, insulin could also reduce hunger through hypothalamic regulation. [Kaushik S et al., 2010]
4
Figure 1. insulin signaling pathway (https://www.slideshare.net/mohsenkoolivand/
signaling-in-diabetes)
Himsworth has suggested that some people with diabetes are hyperglycaemic, which results from tissues resistant to the action of insulin rather than to lack of insulin [Himsworth, H. P. et al., 1949]. It has been confirmed by the observations from obese and T2D subjects with hyperinsulinaemia [Yalow, R. S. et al., 1960]. As the utilization of the clamp technique, several studies showed patients with T2D represent an increased insulin resistance [DeFronzo, R. A et al., 1979]. Nowadays, insulin resistance is recognized as an initiation factor for diabetes development. When skeletal muscle and adipocytes represent insulin resistance, insulin mediated glucose transport and metabolism will decrease. Moreover, insulin resistance failed to suppress hepatic glucose output and release glucose into blood. Except for these manifests, insulin resistance in fat cells influenced normal insulin action on lipids and leaded to reduced circulating lipids uptake and increased fat lipolysis, ultimately elevated free fatty acid in the blood plasma. It together with reduced glucose uptake and hepatic glucose production contribute to high plasma glucose levels [Weyer, C et al., 1999].
5
Elevated plasma saturated free fatty acids (FFA) and muscle fat levels are often observed in patients with type 2 diabetes and insulin resistance. Previously, increased levels of both FFA and fat were suspected the causative factors of insulin resistance. However, the skeletal muscle tissue of endurance-trained athletes has remarkable insulin sensitivity despite having elevated triacylglycerol (TG) levels [Goodpaster BH et al., 2001]. Thus, the role of TG in the pathogenesis of insulin resistance is controversial. A well-sustained balance between fatty acid intake and synthesis and fatty acid oxidation seems more critical in inducing insulin resistance than TG levels alone [Amati F et al., 2011]. However, it is well accepted that elevated FFA is a major pathogenic factor in whole body insulin resistance [Brons C et al., 2009]. Palmitate (PA), as the most abundant saturated fatty acid in plasma, accounts for ~20% of plasma FFA. It is often used to establish insulin resistance models. [Jeon JY, et al.,2016] Therefore, we used PA as an insulin resistance inducer in this study.
In skeletal muscle, plasma triglycerides (TG) lipolysis increases FFAs through lipoprotein lipase (LPL), then FFAs are taken up by fatty acid transporters (Fatp1/CD36) and synthesize fatty acyl-CoA (FA-CoA). Substrate competition speculates that lipid oxidation in the tricarboxylic acid (TCA) cycle enhances the NADH/NADH+ and acetyl-CoA/CoA ratios, which sequentially inhibits pyruvate dehydrogenase (PDH), phosphofructokinase (PFK) and hexokinase Ⅱ (HKⅡ). Glucose uptake and feed glycogen synthesis were inhibited by glucose-6-phosphate (G6P) and glycogen synthase (GSK) respectively. Substrate signaling involves the lipid intermediate DAG arising from triglyceride synthesis or lipolysis. Glycerol phosphate synthase (GPAT) and DAG acyltransferase (DGAT) catalyze triglycerides synthesis, while triglyceride lipase (ATGL) and hormone-sensitive lipase (HSL) involve in lipolysis. Excess palmitate results in accumulation of lipid intermediates, such as ceramide, diacylglycerol, and lysophosphatidic acid, these together with oxidative stress and endoplasmic reticulum stress [Boden G et al., 1998, Peter A et al., 2009, Ragheb R et al., 2009, Ye J, 2007] activate serine kinases such as protein kinase C (PKC), IκB kinase (IKK), and c-Jun N-terminal kinase (JNK) [Lee MS et al., 2012]. Those serine kinases inhibit insulin receptor substrate-1 (IRS1) and Akt signaling, subsequently impaires insulin-stimulated glucose uptake. [Michael Roden, 2012]
6
Figure 2. mechanisms of lipid-induced insulin resistance in skeletal muscle. (Michael roden, diabetes, vol 61, 10, 2012)
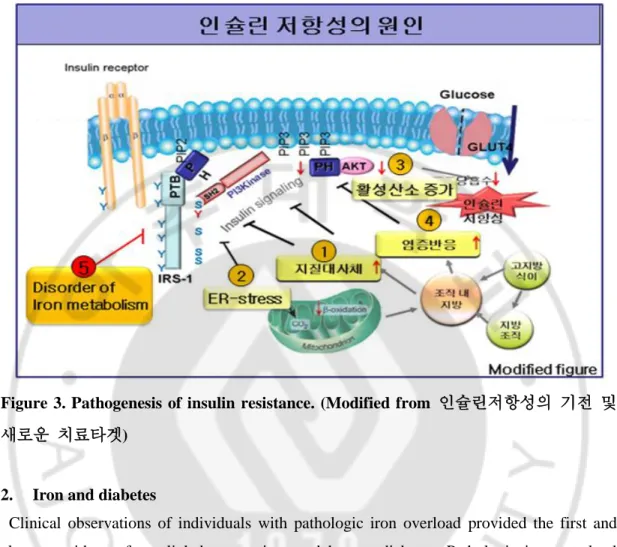
Generally, inflammatory and hormonal factors, oxidative stress, mitochondrial stress, endoplasmic reticulum stress and the accumulation of nutritional overload are believed to decrease insulin sensitivity [Muoio DM et al., 2008].Recently, adipose tissue has been gained attention as a major endocrine organ, secreting multiple metabolically active proteins called adipokines [Chandran, M et al., 2003]. Altered secretion of adipokines such as adiponectin, leptin, resistin, visfatin, apelin, ghrelin and omentin is associated with insulin resistance. [Ravindran Jaganathan et al., 2017] Several studies have also shown that insulin resistance could also associate with myokines such as FGF21 [Ja Young Jeon et al., 2016] and irisin [Mohamed Omer Mahgoub et al., 2018]. In addition, the association between iron homeostatic disturbances and insulin resistance or metabolic disease has begun to receive great attention. There is mounting evidence have shown thatalterations in iron homeostasis, either deficiency [Jung IR et al., 2015, Simcox JA et al., 2013] or overload [Simcox JA et al., 2013], are associated with diabetes, both in humans and in animal models.
7
Figure 3. Pathogenesis of insulin resistance. (Modified from 인슐린저항성의 기전 및
새로운 치료타겟)
2. Iron and diabetes
Clinical observations of individuals with pathologic iron overload provided the first and clearest evidence for a link between iron and human diabetes. Pathologic iron overload included cases of hereditary hemochromatosis (HH) [Buysschaert M et al., 1997] and transfusional iron overload [Dmochowski K et al., 1993], which include beta thalassemia major, frequent or long-term transfusion such as bone marrow transplantation [Baker KS et
al., 2007] Some rare causes of diabetes such as Friedreich ataxia are also represented
blockage of iron balance and existence of mutations in iron metabolism regulating proteins. [Radisky DC et al., 1999]
Hemochromatosis is mostly homozygous for a mutation in the HFE gene [Feder JN et al., 1996], whereas mutations in TfR2, HJV, and hepcidin are could also rarely be found in hemochromatosis [Pietrangelo A. 2010]. Although the signaling process is remain largely unknown Transferrin-bound iron interacts with the hepatocyte TfR2 and the protein HFE,
8
and requires hemojuvelin (HJV), bone morphogenic protein (BMP)-6, and the SMAD (human homolog of Drosophila mad) pathway to promote hepcidin production [Judith A et
al., 2013]. Hepcidin enters the systemic circulation and negatively regulates ferroportin.
Majority of ferroportin regulated by hepcidin is distributed in enterocyte and macrophages. [Nemeth E et al., 2004]. The human mutations of TfR2, HJV, HFE, and hepcidin are all demonstrated to result in iron overload. Recent studies show the prevalence of diabetes in hemochromatosis to be 13–22% and impaired glucose tolerance 18–30% [Hatunic M et al., 2010].
Figure 4. The causes of hereditary hemochromatosis. (Martina U. Muckenthaler. Blood 2014 124:1212-1213)
Thalassemia is a group of disorders characterized by deficient production of the β-globin subunit of hemoglobin [Weatherall DJ et al., 1998] Patients with thalassemia suffer from iron overloaded which caused by the numerous transfusions as well as from increased iron
9
absorption [Weatherall DJ et al., 1998]. Patients with thalassemia had a 6–14% prevalence of diabetes. [Vogiatzi MG et al., 2009] Some other transfusions are also associated with increase in diabetes risk. For instance, a relatively young cohort survived from pediatric bone marrow transplantation revealed a 5% prevalence of type 2 diabetes [Hoffmeister PA et al., 2004].
In relatively small and short-term studies of with or without known type 2 diabetes, phlebotomy improves insulin sensitivity, insulin secretion, and glycemia [Fernandez-Real JM et al., 2002]. Increased insulin sensitivity and secretion are also exhibited in blood donors [Fernandez-Real JM et al., 2005]. Beneficial effects of phlebotomy have also been reported in the Otsuka Long-Evans Tokushima Fatty (OLETF) rats. [Minamiyama Y et al., 2010]. Similar result was demonstrated from iron chelator therapy in non-transfusion-dependent thalassaemia (NTDT) patients with iron excess [Chuansumrit A et al., 2017] and
Ob/Ob mice model. (Cooksey RC et al., 2010). Phlebotomy is also beneficial for other
metabolic syndrome including hypertriglyceridemia (Bofill et al., 1994), vascular reactivity (Fernandez-Real et al., 2002c), and markers of non-alcoholic steatohepatitis (NASH) [Facchini FS et al., 2002], to decrease blood pressure, fasting glucose, HbA1c, and the ratio of LDL to HDL[Houschyar KS et al., 2012]. To evaluate both of the beneficial and potential adverse effects of iron depletion, and individual dose responsiveness and longevity, more large and long-term studies are required.
3. Iron metabolism
In mammalian organisms, most iron is recycled at a rate of 20–25 mg/day via endocytosis of senescent erythrocytes by macrophages.Majority of the body iron is stored in the erythroid compartment of bone marrow and in mature erythrocytes. Senescent red blood cells are endocytosed by splenic reticuloendothelial macrophages and released iron to provide iron for the new red blood cell synthesis. Some iron is stored in the ferritin shells of liver hepatocytes [Pantopoulos K et al., 2012]. Skeletal muscle as a major iron storage and utilization tissue, it contains roughly 10-15% of the total body iron.
10
Figure 5. Mechanisms of Mammalian Iron Homeostasis. (Kostas Pantopoulos, Suheel Kumar Porwal, Alan Tartakoff, and L. Devireddy)
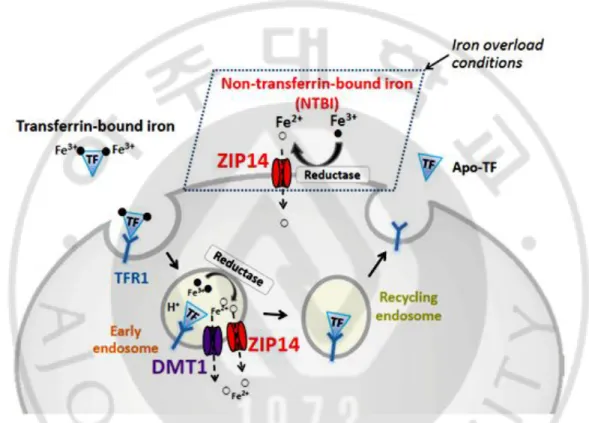
About 5–10% of recycling iron is taken up from the intestine. Dietary ferric iron (3+) reduced to ferrous iron (2+) by ferrireductase duodenal cytochrome b (DCTB) and enters into cells through DMT1 [McKie AT et al., 2008]. Dietary heme is directly up-taken by some unknown pathways and releases iron by heme oxygenase (HMOX) [Ryter SW et al., 2006]. Enterocyte exported the whole iron via ferroportin (FPN) to whole body circulation in ferrous iron state (2+) [Wang J et al. 2011, Hentze MW et al., 2010]. Hephaestin (HEPH) oxidized iron and majority of iron is delivered into tissues or organs via tfR1-mediated endocytosis after binding to transferrin in most cells. [Wang J et al. 2011, Hentze MW et al., 2010, West AR et al., 2008] When endosome becomes acidified, transferrin-bound iron is released and reduced by STEAP family [Ohgami RS et al., 2006], finally entering into the cytoplasm from the endosome through DMT1 [Gunshin H et al., 2005] or ZIP14 [Liuzzi JP
11
DMT1, ZIP14 or calcium channels, while it is always occurred when transferrin was saturated, in condition of iron overload. Intracellular iron can be stored in ferritin or used to maintain cellular physical function or exported from cells by FPN. When iron deficiency, ferritin could be degraded by lysosomal pathway to release and provide cells iron [Zhang Y
et al., 2010].
Figure 6. Model of ZIP14 function in iron assimilation by hepatocytes. (Ningning Zhao
et al., JBC, 285:42, 32141–32150, 2010)
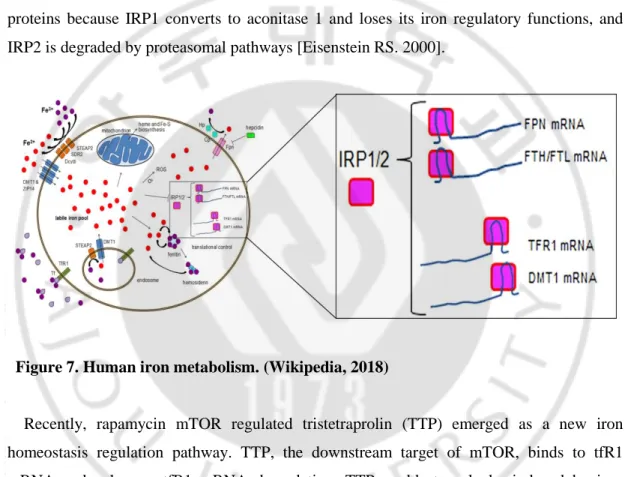
However, when iron is excessive, it may generate reactive oxygen species (ROS) by fenton reaction to damage cells or even cell death. Therefore, cellular iron availability must be tightly modulated. Hepcidin, a negative regulator of ferroportin, is the master modulator of both dietary iron absorption and systemic iron homeostasis as mentioned above [figure 4]. In addition, iron homeostasis could also be fine-tuned by additional regulator system. To maintain iron homeostasis, iron metabolism-related proteins are optimally modulated by interactions between iron-responsive element-binding proteins (IRP1/2) and iron-responsive
12
elements (IRE) influenced by cytosolic iron levels [Eisenstein RS. 2000]. Under normal conditions, when IRPs sense iron deficiency, they bind to the 3′ untranslated region (UTR) IRE of target iron uptake genes such as tfR1 and DMT1 to stabilize their mRNA and subsequently increase iron uptake. On the other hand, IRPs can bind to the 5′ UTR IRE of target genes such as ferritin H, ferritin L, and FPN to inhibit translation and decrease iron storage and efflux. Under iron repletion, IRPs cannot play their role as iron regulatory proteins because IRP1 converts to aconitase 1 and loses its iron regulatory functions, and IRP2 is degraded by proteasomal pathways [Eisenstein RS. 2000].
Figure 7. Human iron metabolism. (Wikipedia, 2018)
Recently, rapamycin mTOR regulated tristetraprolin (TTP) emerged as a new iron homeostasis regulation pathway. TTP, the downstream target of mTOR, binds to tfR1 mRNA and enhances tfR1 mRNA degradation. TTP could strongly be induced by iron chelation to down-regulate iron-requiring genes. [Marina Bayeva., 2012]
4. Physical roles of iron
Body iron exists in hemoprotein and non-heme iron compound. Heme compounds (hemoglobin or myoglobin), heme enzymes (cytochromes, heme thiolates), or nonheme compounds (flavin-iron enzymes, iron sulfur clusters, transferrin, and ferritin) (Finch et al.,
13
1982). The synthesis of heme and iron-sulfur cluster is often accomplished in the mitochondria, even though the mechanism is unclear. Heme iron not only participates in oxygen transport (in particular hemoglobin and myoglobin), but also involves in electron transportation through mitochondrial complex Ⅱ,Ⅲ and Ⅳ. Iron sulfur cluster, one of the non heme iron, plays a role in electron transportation via incorporated into mitochondria complexⅠ,Ⅱ and Ⅲ. In addition, Heme iron and non-heme iron involve cellular metabolism as cofactors for critical enzymes such as citric acid dehydrase, isocitrate dehydrogenase, α-Ketoglutarate dehydrogenase. [Y. Kohgo et al., 2008, S. Srai, A et al., 2002, J. Sripetchwandee et al., 2014, G. Weiss et al., 1994, N. T. V. Le et al., 2002,]
Recently, it is reported that iron involved in DNA metabolism, either DNA synthesis or repair, through being utilized as indispensable cofactor for critical enzymes for DNA metabolism. These enzymes include ribonucleotide reductase and multiple DNA repair enzymes such as helicases, nucleases, glycosylases, demethylases. Striking evidences recently have suggested that the binding of catalytic subunits of DNA polymerases to iron-sulfur clusters through conserved cysteine-rich motifs is essential for forming stable and active DNA complexes. Consistently, either deficiency of iron sulfur cluster biogenesis and insertion into nucleic iron-requiring enzymes, which are participated DNA synthesis and repair, result in DNA impair and genome instability. Some other studies have demonstrated that ribonucleotide reductase function was regulated by multiple mechanisms in yeast cells. This function is dependent on maintenance of optimal deoxyribonucleotide concentrations-caused iron bioavailability fluctuations. Moreover, iron sulfur centers present in DNA charge transport protein which exerts critical role for detecting and repairing DNA mismatches. However, a physical role for DNA charge transport protein has not yet been clearly established. [sergi Puig et al., 2017]
With all these functions, iron plays a fundamental role in cellular gene regulation, steroid synthesis, growth and differentiation, and drug metabolism.
14
Figure 8. The role of iron in mitochondrial function.
Figure 9. list of the iron-containing enzymes dedicated to DNA metabolism. (Sergi Puig et al., metallomics, 2017,9, 1483-1500)
15
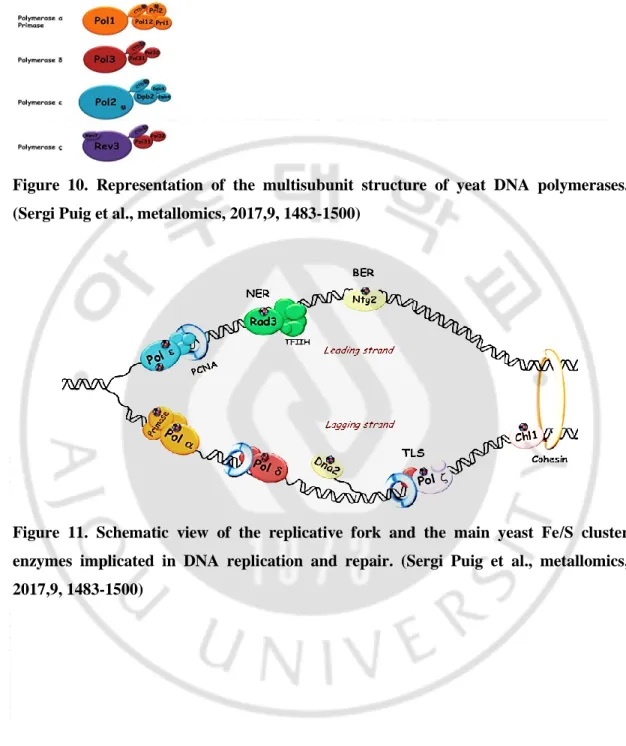
Figure 10. Representation of the multisubunit structure of yeat DNA polymerases. (Sergi Puig et al., metallomics, 2017,9, 1483-1500)
Figure 11. Schematic view of the replicative fork and the main yeast Fe/S cluster enzymes implicated in DNA replication and repair. (Sergi Puig et al., metallomics, 2017,9, 1483-1500)
16
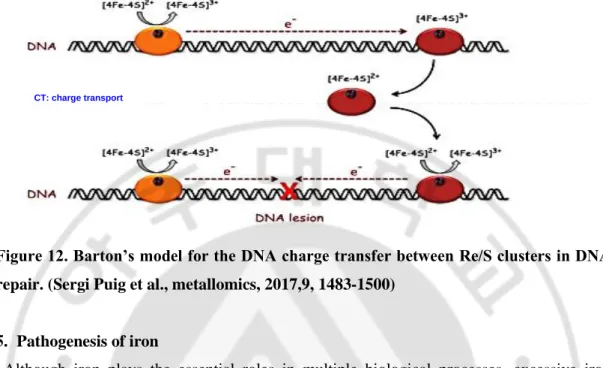
Figure 12. Barton’s model for the DNA charge transfer between Re/S clusters in DNA repair. (Sergi Puig et al., metallomics, 2017,9, 1483-1500)
5. Pathogenesis of iron
Although iron plays the essential roles in multiple biological processes, excessive iron produces highly deleterious radicals such as hydroxyl radicals, mostly generated from Fenton reaction [Branco, MR et al., 2004]. Hydroxyl radicals reacts with all kinds of biological molecular including cellular DNA, protein, carbohydrates and lipid, mediating many detrimental manifestations of tissue damage, disease and organ failure, and ultimately death. Hydroxyl radicals lead to DNA damage through breaking double strand or inducing chemical changes in deoxyribose, purines and pyrimidines. It can modify guanine through attaching onto c-8 of guanine. 8-hydroxyldeoxyguanosine is an important iron-mediated Fenton reaction caused DNA damage indicator. These radicals impair many protein enzymes, affecting critical cellular functions such as ATP generation. In the presence of H2O2, ferrous iron (Ⅱ) could also react with polyunsaturated fatty acids to initiate lipid peroxidation cascade in membrane and lipoproteins via producing Fenton reaction-mediated hydroxyl radicals, the process called ferroptosis [Fardy et al., 1995, Casanueva, E et al., 2003, Kell, DB. 2009, De la Rosa, LC et al., 2008], the term of which was coined in 2012 [S.J. Dixon, K.M. et al., 2012]. Ferroptosis could be triggered during development or normal homeostatic tissue turn over by the accumulation of glutamate, iron, or polyunsaturated fatty
17
phospholipids, or by depletion of endogenous inhibitors of ferroptosis, such as GSH, NADPH, GPX4, or vitamin E [Stockwell BR et al., 2017]. Lipid peroxidation results in membrane fragility of plasma membrane or membrane of cell organelles such as mitochondrial, lysosomes and ER, ultimately leading to cell function impairment.
Through these pathologic mechanisms, excessive iron associated with many metabolic syndromes. In the liver, iron overload induces insulin resistance and elevates hepatic glucose production. Conversely, insulin resistant liver disease such as non-alcoholic fatty liver disease, tend to have increased ferritin levels. Iron depletion in such patients manifested to improve liver damage and function. Iron accumulation in pancreas induces β cells injury, apoptosis through detrimental ROS generation (Cooksey, R. C, et al., 2004). In addition, iron overload could increase lipolysis, decrease glucose oxidation and alter adipokines in adipose tissue. Diet-induced iron overload may also decrease adiponectin (Huang J, et al., 2011) through FOXO1-mediated transcription repression (Gabrielsen JS et al., 2012). Moreover, iron negatively regulates leptin expression via cAMP-responsive element binding protein activation (CREB activation) to increase food intake and regulate metabolism (Gao Y et al., 2015). In skeletal muscle, accumulated iron increases fatty oxidation rate and decreases glucose oxidation (Huang, J, et al., 2011). However, the underlying mechanisms about the association between iron overload and insulin resistance in skeletal muscle is not well studied.
18
Figure 13.ROS generation and scavenging in HCV infected cells (Charlène Brault et al., Viruses. 2013 Mar; 5(3): 954–980)
Fig. 14. Role of Serum Uric Acid and Ferritin in the Development and Progression of NAFLD. (Rosa Lombardi., 2016)
19
6. Diabetes and muscle
Lean muscle mass generally contributes up to about 50% of total body weight in young adults [Robach P et al., 2007]. It is the largest insulin-sensitive tissue in the body and accounts for 80% of glucose uptake under euglycaemic hyperinsulinemic conditions [Smith AG et al., 2005]. Skeletal muscle insulin resistance is a key process in the development of type 2 diabetes, which may be observed decades before beta cell failure and hyperglycaemia develop.
Previous studies have demonstrated that muscle loss and decreased muscle strength may contribute to the development of diabetes. For example, in older individuals, the association of diabetes with impaired gait and low walking speed might be mediated by impaired muscle function [Volpato S et al., 2012]. Ageing skeletal muscle has reduced oxidative capacity, subsequently increased ROS production, which could lead to mitochondrial DNA mutagenesis and inflammation. Both mitochondrial dysfunction and chronic low-grade inflammation contribute to insulin resistance [Kim JA et al., 2008]. Furthermore, ageing could increase fat infiltration to skeletal muscle. Intermuscular fat impairs insulin action and induce insulin sensitivity through reducing muscular blood flow, or increasing local secretion of pro-inflammatory adipokines [Miljkovic I et al., 2015].
Conversely, insulin resistance or diabetes could also affect muscle mass, strength and physical performance. Several studies have suggested that the patients with diabetes represent accelerated loss of muscle mass and strength, which is greater as longer diabetes duration or higher HbA1c, while these phenomena were attenuated by insulin sensitizer utilization [Lee CG et al., 2011]. It is likely more evident that lower skeletal muscle mass results in reduced capacity for glucose disposal in older adults with sarcopenia. In older individuals, part of the mobility limitations with diabetes is directly mediated by the effect of diabetes on skeletal muscle. Dysglycaemia or insulin, or both, could promote muscle loss after high fasting and post-challenge concentrations of both glucose and insulin even in individuals without diabetes [Barzilay JI et al., 2009]. Relatively severe hyperglycaemia and insulin resistance even associate with slower walking speed [Kuo CK et al., 2009]. Plausible reasons for the pathogenesis of insulin resistance in muscle mass loss and quality impairment are as followings: Insulin resistance impairs PI3K/AKT pathway and reduced protein
20
synthesis pathways. Insulin resistance fails to inhibit autophagy via suppression of mTOR pathway. Impaired insulin or IGF-1 signaling phosphorylates FOXO1 to stimulate E3 enzyme atrogin 1 and muscle ring finger-1 to increase ubiquitin-proteasome proteolytic pathway, which pathway is not shared with age-related sarcopenia [Wang X et al., 2006]. In addition, insulin resistance also associated with mitochondria dysfunction and decreased mitochondria biogenesis.
There are only a few evidences that common pharmacological therapies for type 2 diabetes are beneficial in preventing or reversing sarcopenia in older adults. Metformin, an AMPK agonist, may cause autophagic muscle cell death. Insulin promotes muscle protein synthesis in young adults but not in older individuals, indicating that these pharmacological therapies no protection effects on age-relating muscle wasting (Michela Cetrone et al., 2014). Fortunately, thiazolidinediones improve insulin sensitivity and mitochondrial biogenesis but suppress proteolysis pathways (Wang X et al., 2006).
Resistance exercise gradually increase muscle strength and muscle mass. The combination of progressive resistance training and aerobic exercise results in maximum benefits to weight loss, skeletal muscle mass and strength gain, and improvements in mitochondrial function, insulin sensitivity, and potentially decreasing skeletal muscle apoptosis even in old (mean age 87 years) and frail individuals. [Fiatarone MA et al., 1994] In parallel, increased contractile activity promotes oxidative fiber type transformation, PGC-1a expression, mitochondrial activity, content and biogenesis, muscle protein synthesis, or reduces inflammation and oxidative stress. Exercise could also increase in GLUT4 protein expression and translocation in an insulin-independent manner, mainly through AMPK signaling pathway, finally improves glucose metabolism [Lira VA et al., 2010, Wasserman DH. 2009]. Satellite cells in muscle might also be activated by exercise. [Thornell LE et al., 2011]
Protein supplementation either before or immediately after exercise could promote muscle protein synthesis and improve insulin sensitivity compare to delayed protein ingestion. [Tipton KD et al., 2001]. In contrast, low protein intake associated with decreased muscle strength in individuals with high concentrations of inflammatory markers. [Bartali B et al., 2012] Supplementation with high-protein meal replacements, or specifically with essential or
21
branched-chain amino acids, or both, might be beneficial, while compared to the clear beneficial effects of exercise on muscle health, the beneficial effects of diet on sarcopenia has not yet been definitively shown adequately and needs further study. Nevertheless, there is no doubt that muscle health associated with development and treatment of diabetes.
Skeletal muscle contains 10–15% of body iron [Robach P et al., 2007]. Precise iron regulation in skeletal muscle is critical for preventing insulin resistance and diabetes. However, PA-induced intracellular iron disturbances in skeletal muscle and the effects of these disturbances on PA-induced insulin resistance have not yet been studied.
7. TfR1 endocytosis via clathrin mediated endocytosis
Transferrin binds to TFR-1 forms a TF-TFR complex, which internalized into cells by clathrin-mediated endocytosis, and tfR1 often used as a marker of this pathway. [Widera A
et al., 2003] Depend on many different cargoes and accessory adaptor proteins being used,
clathrin-mediated endocytosis is very versatile. Here we will describe this pathway below with transferrin as an example. Five stages were required to form a clathrin-coated vesical: initiation, cargo selection, coat assembly, scission and uncoating. Iron-transferrin-tfR1 complex activates adaptor protein complex, and this stimulates clathrin molecules sorting. Clathrin triskelions then recruit to the plasma membrane through interacting with adaptor proteins and complex (such as adaptor protein 2 (AP2)) and accessory protein (such as AP180 and epsin). [McMahon, H.T et al., 2011] All of the additional accessory proteins are recruited to the complex, later stretch and deform the cell membrane to form vesicles. These clathrin-coated vesicles containing transferrin-tfR1 complex are pinched off by dynamin and released into the cytoplasm to accomplish transferrin-tfR1 internalization [Schmid, S.L. et al., 2011]. When transferrin-tfR1 complex contained endosome is acidification, ferric iron is released from transferrin, then apo-transferrin bound to tfR1 in vesicles recycles to the membrane surface and transports iron molecules again [Huotari, J. et al., 2011. Grant, B. D.
et al., 2009].
Clathrin-mediated endocytosis has a range of different functions, such as modulating the membrane surface proteins’ expressions; sampling the cell’s environment for growth and guidance cues; internalizing nutrients into cells; regulating signaling pathways; retrieving
22
proteins deposited after vesicle fusion; and recycling membrane components via lysosomal degradation [McMahon, H.T. et al., 2011].
Figure 15. Reciprocal regulation of signaling and endocytosis: Implications for the evolving cancer cell. (2017)
Fig. 16. Cargoes of various sizes can be endocytosed by clathrin-coated pits in a
constitutive or stimulated manner (McMahon HT et al. Nat Rev Mol Cell Biol. 2011
23
8. Calcium regulates clathrin-mediated endocytosis
Calcium is one of the modulators of clathrin-mediated endocytosis [Royle SJ. 2006, Wu XS
et al., 2009, Ci W et al., 2003], indicating that calcium may regulate Tf receptor recycling.
Calcium reportedly binds to the calcium binding domain of the clathrin light chain, modulating clathrin assembly in vitro and intracellular calcium may play a part in the vesical function. [Royle SJ. et al., 2006]. At a single nerve terminal, calmodulin senses calcium and might initiate various forms of endocytosis, including clathrin-dependent slow endocytosis, bulk endocytosis, rapid endocytosis and endocytosis overshoot (excess endocytosis) [Wu XS
et al., 2009]. Akiyama S et al. also demonstrated that the potential role of iron on tfR1
recycling. They have shown that verapamil potentiates the effect of a toxic conjugate formed with Pseudomonas exotoxin and a monoclonal antibody to the human transferrin receptor (anti-TFR-PE) and enhances the effect of Pseudomonas exotoxin (PE). Verapamil may directly or indirectly inhibit the influx into lysosomes of some other factor, such as calcium, which is necessary for the activity of the lysosomal enzymes, or the synthesis or activity of lysosomal proteases. As the results, verapamil delayed anti-TFR-PE complex remaining in the lysosome than PE only, further leading to more cell death. However, it is not known whether the enhanced toxicity of EGF-PE in the presence of verapamil is due to its delayed degradation in lysosomes or some more general effect of verapamil on cancer cell membrane permeability. [Akiyama, S.. Gottesman. M. M. et al., 1984.] These implicated the possible effect of calcium on transferrin recycling.
Fig. 17. Calcium regulates clathrin-mediated receptor endocytosis. (Modified from K. L. A. Souza., 2004)
24
9. Saturated free fatty acid and calcium
Calcium levels are often increased by PA treatment, subsequently inducing insulin resistance (Ly LD et al., 2017, Lanner JT et al., 2006) through the following possible mechanisms. Saturated FFAs induce cytosolic and mitochondrial ROS, which raises cytosolic calcium through inhibition of sarco/endoplasmic reticulum Ca2+ ATPase (SERCA) activity to suppress calcium enters to endoplasmic reticulum ER (Cnop M et al., 2010) or activates both type 1 IP3 receptors (IP3R) and ryanodine receptor 1 (RYR1) to release ER calcium to cytosol (Contreras-Ferrat A et al., 2014). Calcium deficiency in the ER impairs chaperones of the protein folding machinery and results in the accumulation of misfolded proteins. This ER stress augments ER ROS production and further exacerbates oxidative stress. The result of ER calcium release elevated cytosolic and mitochondrial matrix calcium concentrations, triggering ROS generation and facilitating to mitochondrial permeability transition pore opening. In addition, ER calcium depletion activates store-operated calcium channel (SOC) to promote persistent calcium influx from extracellular space, which may increase cytosolic and mitochondrial Ca2+ to an intolerable level (Choi SE et al., 2007), resulting in a vicious cycle of ROS formation and Ca2+ dysregulation. These mitochondrial dysfunction and ER stress induced by lipotoxicity may contributes to pancreatic β-cells failure, insulin resistance in peripheral tissues and diabetic complications.
Figure 18. Proposed mechanism of lipotoxicity in type 2 diabetes (Oxidative stress and calcium dysregulation by palmitate in type 2 diabetes Luong Dai Ly et al., 2017)
25
Figure 19. Mechanism suggested for store operated Ca 2+ entry (SOCE) (Phospholipase A2 as a Molecular Determinant of Store-Operated Calcium Entry, Tarik Smani et al., 2016)
10. The link between iron and calcium
The study about iron overload cardiomyopathy (IOC) is well conducted in thalassemia patients. Recent evidence has suggested that L-type calcium channels (LTCC) primarily transport Ca+2, but in some conditions such as iron overloaded cardiomyocytes, it can also transport Fe+2 [Tsushima RG et al., 1999, Atar D et al. 1995], even though the mechanisms of non-transferrin-bound-iron (NTBI) entry into cardiomyocytes are still controversial. While some studies have suggested that LTCC might be a major pathway for NTBI entery. Iron uptake was elevated in excitable tissues than non excitable tissues, the plausible reason is that excitable tissues have more LTCC than non excitable tissues. [Parkes JG et al., 1997, Randell EW et al., 1994]. In addition, iron levels enhanced along with increased LTCC activity [Randell EW et al., 1994, Templeton DM et al., 2003, Oudit GY et al., 2003]. In the heart, LTCC agonist Bay K 8644 triggered nifedipine sensitive Fe2+ uptake through
26
enhancing LTCC activity [Tsushima RG et al., 1999]. Oudit et al. have shown more definitive evidence that LTCC blockers verapamil and amlodipine could treat iron overloaded cardiomyopathy (IOC) through inhibiting the LTCC current to attenuate myocardial iron accumulation and subsequent oxidative stress, ultimately preserve heart structure and function and improve survival [ Oudit GY et al., 2003]. Cardiac-specific LTCC α1-subunit transgenic iron overloaded mice displayed twofold higher myocardial iron and oxidative stress levels and greater cardiac function impairment. Some others suggest that T-type calcium channel (TTCC) may be the alternative portal of iron entry [Kumfu S et al., 2012, Kumfu S et al., 2011]. Anyhow, the above findings have revealed that in cardiomyocytes, either the LTCC or TTCC as the main candidate for NTBI influx. Therefore, CCBs is considered as potential preventive and therapeutic strategy for treating IOC [Oudit GY et al., 2003]. Based on this theory, calcium seems to compete to iron entery. Interestingly, Chen et al. also demonstrated that the calcium channel blockers verapamil and amlodipine decreased the uptake of Fe3+, but not Fe2+, in cultured HL-1 cardiomyocytes under iron overload conditions [Chen MP et al., 2014], indicating that calcium may also regulate Fe3+ uptake. Similar to this result, thapsigargin-elevated intracellular calcium speeds up the initial rate of tfR1-mediated cellular iron uptake and increases the cellular capacity in taking up iron either through tfR1 expression or Tf-tfR1 complex recycling by increasing PKC and actin polymerization in K562 cells [Ci W et al., 2003]. Taken together, these studies indicate that calcium may have an alternative pathway to regulate ferric iron entry except for modulation of ferrous iron influx.
27
28
A. MATERIALS
Deferoxamine (DFO; 9533), ferric chloride (FeCl3; 10025-77-1), ferrous sulfate (FeSO4; 7782-63-0), dimethyl sulfoxide (2438), actinomycin D (A9415), thapsigargin (T9033), and A23187 (C7522) were purchased from Millipore Sigma (Burlington, MA, USA). Deferasirox (sc-207509) was purchased from Santa Cruz Biotechnology (Dallas, TX, USA). Calcein AM (564061) was obtained from BD Biosciences (San Diego, CA, USA). Bovine serum albumin (BSA; 22070008), insulin, Fluo-3 AM (12171422-5), BAPTAAM (126150-97-8), and PA (P5585) were purchased from Millipore Sigma. TF from Human Serum, Alexa Fluor 488 Conjugate (T13342) was obtained from Thermo Fisher Scientific (Waltham, MA, USA); 2-[N-(7-nitrobenz-2-oxa-1,3-diazol-4-yl) amino]-2-deoxyglucose (2-NBDG; N13195) and phalloidin (A12380) were also purchased from Thermo Fisher Scientific. Chemicals were dissolved in appropriate media or dimethyl sulfoxide and then used at the recommendation concentrations. Anti-phosphorylated IGF-I Receptor b (Tyr1135/1136) /Insulin Receptor b (IR) (Tyr1150/1151) (3024), insulin receptor b (4B8) (3025), phosphorylated PKB (Akt) (Ser473,9271), total Akt (9272), phosphorylated glycogen synthase kinase 3a/b (GSK-3a/b) (Ser21/9, 9331), total GSK-3a/b (9332), phospho-JNK (4671), total JNK (9252), and IRP1(20272) antibodies were obtained from Cell Signaling Technology (Danvers, MA, USA). Anti–ferritin heavy chain (FTH) (ab65080) was obtained from Abcam (Cambridge, United Kingdom). Anti–b actin (A300-491A) was obtained from Bethyl Laboratories (Montgomery, TX, USA). TfR1 (sc9099) and IRP2 (sc33682) antibodies were purchased from Santa Cruz Biotechnology.
29
B. METHODS
1. Preparation of PA
PA/BSA conjugates were prepared as described previously (Jeon JY et al., 2016). Briefly, 20 mmol/L of PA solution in 0.01 mol/L NaOH was incubated at 70°C for 30 min and fatty acid soaps were subsequently complexed with 5% BSA in PBS at a 1:3 volume ratio. These PA/BSA conjugates were then administered to differentiated HSMMs at a final PA concentration of 0.4 mM.
2. Cell culture
Undifferentiated human skeletal muscle myoblasts (HSMMs) were obtained from Lonza (Walkersville, MD, USA). Myoblasts were maintained in a SKGM Skeletal Muscle Growth Bullet Kit (CC-3161 & CC-4139; Lonza) containing 2 mM glutamine, 50 U/ml streptomycin, and penicillin at 37°C in 5% CO2 atmosphere. Myoblast cells were differentiated by switching the medium to Dulbecco’s modified essential medium supplemented with 2% horse serum, and the medium was replaced every 5–6d. Normal HSMMs were grown for 6d before harvesting for protein or RNA analysis. Differentiation states were tested with several differentiation markers such as MYH2, MYOG, MYOD, Mef2C, and TNNT genes by using real-time quantitative PCR (qPCR). Differentiated cell morphology was checked with phalloidin
3. Myotube staining
Differentiated myotubes were fixed with 3.7% formaldehyde solution for 10 min. Subsequently, samples were incubated in PBS with 0.1% Triton X-100, 2.5% Alexa Fluor 568–conjugated phalloidin (Thermo fisher Scientific), and 2.5% DAPI (Thermo Fisher Scientific) at room temperature in the dark for 20–30min. Phalloidin stains filamentous actin, DAPI labels cell nuclei. After washing samples 3 times with PBS, they were mounted on glass slides. Fluorescence was observed under a confocal microscope (Nikon, Tokyo, Japan).
30
4. Immunoblot analysis
HSMMs were homogenized at 4°C in RIPA buffer [150 mM NaCl, 1% NP-40, 0.5% deoxycholate, 0.1% SDS, 50 mM Tris-HCl, pH 7.5, and protease inhibitor cocktail (Roche Applied Sciences)] and incubated on ice for 20 min. The resulting lysate was centrifuged at 13,000 rpm for 10 min at 4°C. Aliquots of the supernatant were removed for protein analysis by the Bradford method. An equal volume of 2× SDS sample buffer (125 mM Tris–HCl, pH 6.8, 4% SDS, 4% 2-mercaptoethanol, and 20% glycerol) was added to each cell lysate. Equal amounts of protein (5–10 μg) were loaded on 8–12% polyacrylamide gels, electrophoresed, and transferred to polyvinylidene difluoride (PVDF) membranes (Millipore, Bedford, MA, USA). Target antigens were reacted with primary antibodies after blocking the PVDF membranes with 5% skim milk for 30 min. After binding with secondary antibodies (horseradish peroxidase-conjugated anti-mouse IgG or anti-rabbit IgG antibodies), immunoreactive bands were detected with an enhanced chemiluminescence system (Pierce, Rockford, IL, USA). Band intensities were determined through densitometric analysis using the one-dimensional Quantity One 1D image analysis system (Bio-Rad, Hercules, CA, USA). Protein levels were normalized to total protein values.
5. RNA isolation, quantitative real-time PCR, and semi-quantitative reverse transcriptase-PCR
Total RNA was isolated from cells or muscle tissues and prepared using the RNAiso Plus reagent (TaKaRa Bio Inc., Shiga, Japan) according to the manufacturer’s instructions. HSMM cDNA was then synthesized with avian myeloblastosis virus reverse transcriptase using random 9-mers. The cDNA was then used as a template for PCR amplification using gene-specific primer sets described in the supplemental data (Table 1). Quantitative real-time PCR (qRT-PCR) was performed using SYBR Green (TaKaRa Bio Inc.) and a TaKaRa TP-815 instrument. All expression values were normalized to human RPL32 mRNA levels. The expression levels of human iron metabolism-related genes were determined using a semi-quantitative reverse transcriptase PCR (RT-PCR) technique performed with an RNA PCR kit (version 3.0; TaKaRa Bio Inc.). The cDNA was used as the PCR template with the gene-specific primer sets described in the supplemental data (Table 2). PCR was performed with
31
the following conditions: denaturation at 95°C for 5 min, followed by 34 cycles of denaturation at 95°C for 30 s, annealing at 60°C for 30 s, and extension at 72°C for 1 min, with a final extension at 72°C for 10 min. Amplified DNA was analyzed by 1% agarose gel electrophoresis. All expression values were normalized to human GAPDH mRNA levels.
6.Transfection of siRNAs
Transfection of small interfering RNAs (siRNAs): Twenty-one nucleotide siRNA duplexes were designed and synthesized by Bioneer (Seoul, Korea). These siRNA sequences are listed in the supplemental data (Table 3). HSMMs were transfected with siRNA oligonucleotides and GFP oligonucleotides using Lipofectamine 2000 (Invitrogen). Briefly, 2 × 10⁵ cells were seeded into each well of a 6-well plate and incubated overnight. On the following day, cells were transfected with siRNAs or GFP oligonucleotides as a negative control at a final concentration of 100 nM using Lipofectamine 2000 according to the manufacturer’s instructions. At 24 h after transfection, HSMMs were differentiated by switching the medium to differentiation medium before harvesting for qRT-PCR or western blotting.
7. Uptake of 2-NBDG by HSMMs
Differentiated HSMMs were pretreated with PA (0.4 mM) for 24 h. The glucose uptake assay was performed as described previously (Lee MS et al., 2012). Briefly, cells were starved for 16 h and then pre-incubated in Krebs–Ringer bicarbonate buffer (pH 7.4) containing 2 % BSA at 37°C for 30 min. They were then treated with 500 μmol/L 2-NBDG with or without 100 nmol/L insulin at 37°C for 3 h. The cells were then washed with ice-cold PBS three times and lysed with cell lysis buffer. Cell lysates were centrifuged at 12,000 rpm for 30 min at 4°C. Fluorescence was measured in the resulting supernatants (excitation 475 nm, emission 550 nm) using a SpectraMax Gemini EM microplate reader (Molecular Devices, Sunnyvale, CA, USA).
8. Measurement of intracellular labile iron pool
Iron-sensitive fluorescent calcein dye was used to evaluate the labile iron pool (LIP) as described previously (Jung IR et al., 2015). Briefly, differentiated HSMMs were incubated in
32
Krebs-Ringer buffer (10 mM HEPES, 5 mM NaHCO3, 1 mM MgCl2, 129 mM NaCl, 4.8 mM KCl, 1.2 mM KH2PO4, 2.5 mM CaCl2, 2% BSA) with 0.5 μM calcein AM for 15 min. Free calcein without metal-bound calcein was measured for fluorescence (excitation 488 nm, emission 517 nm) using a SpectraMax Gemini EM microplate reader. To quantify the fluorescence values, HSMMs were grown and differentiated in 96-well plates and the experiment was repeated. Fluorescence values were then obtained by measuring the fluorescence after excitation at 488 nm and emission at 517 nm on a SpectraMax Gemini EM microplate reader. Intracellular LIP was stained with 0.5 μM calcein AM for 15 min, and then observed by confocal microscopy. Relative LIP levels were determined by comparing the fluorescence originating from iron-bound calcein.
9. Animal model and insulin tolerance tests
C57BL/6J male mice were purchased from Japan SLC, Inc. (Hamamatsu, Japan). All animal experiments were approved by the Animal Ethics Committee of the Laboratory Animal Research Center (Ajou University Medical Center). These mice were housed in a temperature-controlled room (22 6 2°C) with a 12/12-h light/dark cycle and fed ad libitum. Eight-week-old male C57BL/6J mice were given iron dextran (9004-66-4,D8517; Millipore Sigma) as previously described (24). Briefly, 5 mg of iron dextran was administered intraperitoneally 2 times a week for 4 week, before insulin tolerance test (ITT) analysis. To prepare the insulin resistance mouse model, 8-wk-old male C57BL/6J mice were fed a high-fat (HF) diet (12492, 60% kcal from high-fat; Research Diets, New Brunswick, NJ, USA) for 8 wk. Mice were randomly divided into 3 groups: 1) normal diet group, 2) HF group, and 3) HF + 100 mg/kg DFO group. These mice were intraperitoneally administered either vehicle or DFO (100 mg/kg) every other day for 7 wk. For ITTs, mice had food withheld for 6 h and intraperitoneally injected with insulin (1 U/kg; Millipore Sigma). Blood samples were taken at different time points (0, 15, and 60 min after insulin treatment) from the tail vein. Plasma glucose levels were measured by using an Accu-Chek glucometer (Roche, Basel, Switzerland).
33
Iron concentrations in muscle were analyzed by using the Quanti Chrom Iron Assay Kit (DIFE-250; Bio Assay Systems, Hayward, CA, USA) according to the manufacturer’s protocol. In brief, the extracted muscle (50mgmuscle/piece) was weighed and mechanically homogenized in 200ml lysis buffer (RIPA) with protease and phosphatase inhibitors. The crude lysates were further lysed with an ultrasound sonicator; hydrochloric acid was added (0.01 M final concentration); and the mixture was incubated for 30 min with mixing every 10 min. The lysate was centrifuged at 4°C for 15 min, and the supernatant was used to assay iron concentration.
11. Study subjects and skeletal muscle biopsy
Twelve patients with type 2 diabetes and 10 normal glucose tolerance participants were enrolled. Age among the12patients with type 2 diabetes and the 10 normal glucose tolerance participants was not significantly different (38.7 6 11.4 and 47.9 6 10.2yr, respectively, P=0.140). Also, BMIs between the 2 groups were not significantly different (24.464.0 and 25.662.4kg/m2; P = 0.232). A muscle biopsy was performed in the overnight fasted state. A percutaneous biopsy sample of the vastus lateralis muscle was obtained 15–20 cm above the knee by using a Bergstr¨om needle. Biopsy samples were immediately blotted free of blood, frozen, and stored in liquid nitrogen until use. Ethics approval was obtained from the Institutional Review Board of Ajou University Hospital, Suwon, South Korea. Comprehensive informed consent was obtained from all individual participants included in the study.
12. Measurement of intracellular calcium levels
Intracellular calcium levels were determined by measuring Fluo-3 AM fluorescence using a confocal laser scanning microscope (Zeiss, Jena, Germany) as described previously ( Choi SE et al., 2007). Briefly, differentiated HSMMs were plated on glass-bottomed culture dishes (MatTeck Co., Ashland, MA, USA) at 37 °C in DMEM with 2% horse serum as differentiated medium for 6 days. After stimulation with A23187 (2 μM), fluorescence images were captured (excitation: 488 nm, emission: 505 nm) and subsequently digitized. Calcium intensities were calculated with DVC-1310 (DVC Co., Austin, TX, USA) and
34
presented as percent change compared to basal levels (F/F0). Averages and standard errors (mean 6 SEM) were calculated using Microsoft Excel 2000 (Microsoft Corp., Redmond, WA, USA).
13. Analysis of GFP-labeled iron and Tf complex uptake
To detect the translocation of green fluorescent protein (GFP)-labeled iron and Tf complex from the media to the cytosol, HSMMs were grown and differentiated in 24-well plates, followed by treatment with 0.4 mM PA or calcium agonists (500 nM thapsigargin, 100 nM A23187) for 24 h. GFP-labeled Tf internalization was performed using Meier’s method [Meier O et al., 2002] with some modifications. Briefly, GFP-labeled iron and Tf complex was treated at a concentration of 20 μg/mL for 12 h. After washing with cold live cell imaging solution (LCIS), intracellular Alexa Fluor 488-labeled Tf conjugate was observed under a confocal microscope (488 nm excitation, 517 nm emission) (Carl ZeissAG).
14. Statistical analyses
Data are presented as the mean ± SE of at least three independent experiments. Statistical differences between different groups were determined using Student’s t-test and Fisher’s exact test. P-values < 0.05 indicated statistical significance.
35
Table 1. Nucleotide sequences of sets for real-time PCR.
Genes RT-PCR: Primer sequence NCBI number size
TFR1 F:5’TCAAGGTTTCTGCCAGCCCA3’ NM_011638.4 100 R:5’TTTGCTGGCCCAGTTGCTGT3’ DMT1 F:5’TACCCATCCTCACGTTCACA3’ NM_001146161.1 100 R:5’CAGACGATCAGGACCAGGAT3' FTH F:5’ACCGCGATG ATGTGGCTTTG3’ NM_010239.2 101 R:5’ATTCGGCCACCTCGTTGGTT3’ FPN1 F:5’ATCGGATGTGGCACTTTGCG3’ NM_016917.2 95 R:5’TGGCTCCCAGGACCAGAACA3’ IRP1 F:5’TCTTGGTTGGGGTGTCGGTG3’ NM_007386.2 100 R:5’TCCCCATCAGCCTGTAGCCA3’ IRP2 F:5’TGTTGAAGTGCCCTTTTTCC3’ R:5’AGTTTTCACTGCCTCCCTCA3’ NM_022655.3 100 RPL32 F:5’AAGCGAAACTGGCGGAAACC3’ NM_172086.2. 90 R:5’CCCATAACCGATGTTGGGCA3'
36
Table 2. Nucleotide sequences of sets and reaction condition for semi-quantitative PCR. Genes semi-PCR NCBI number size
TFR1 ATCTCGGTCATCAGGATTGC NM_001128148.2 302 CTGTGCCTACACCGGATTTT DMT1 CACCGGACCAGGTTTTCTTA XM_005268912.4 400 CTTCCGCAAGCCATATTTGT FPN1 GTCATCGGCTGTGGCTTTAT NM_014585.5 399 AGTGTAGGCGTACCCTGTGG FTH1 CTGGAGCTCTACGCCTCCTA BC105802.1 380 ACGTGGTCACCCAATTCTTT GAPDH S: GGTGAAGGTCGGAGTCAACG NM_001289746.1 497 A: CAAAGTTGTCATGGATGACC
37
Table 3. Nucleotide sequence of siRNAs.
Genes siRNA : Primer sequence
GFP Sense: 5’GUUCAGCGUGUCCGGCGAG3’ Antisense:5’CUCGCCGGACACGCUGAAC3’ tfR1 Sense: 5’CUGGAUAAAAUGAGGUUCA Antisense:5’UGAACCUCAUUUUAUCCAG tfR1 Sense:5’CUGGAAAACAGACUCUACA3’ Antisense:5’UGUAGAGUCUGUUUUCCAG3’ DMT1 Sense: 5’GUGAACAUAGCCAAAAGUA3’ Antisense:5’UACUUUUGGCUAUGUUCAC3’ FPN1 Sense:5’UCACUCUUGUUCAAGACUA3’ Antisense:5’UAGUCUUGAACAAGAGUGA3’ FTH Sense:5’GACGUUCUUCGCCGAGAGU3’ Antisense:5’ACUCUCGGCGAAGAACGUC3’ IRP1 Sense:5’GUUGCUCCUGAACAUCAUA3’ Antisense:5’UAUGAUGUUCAGGAGCAAC3’ IRP1 Sense:5’CAGGAUUGUUAGCAAAGAA3’ Antisense:5’UUCUUUGCUAACAAUCCUG3’ IRP2 Sense:5’GAAUUGAGCUGGACACAUU3’ Antisense:5’AAUGUGUCCAGCUCAAUUC3’ IRP2 Sense:5’CAGAUAGUCCCAGUAUACU3’ Antisense:5’AGUAUACUGGGACUAUCUG3’
38
39
A.
Human skeletal muscle myoblasts differentiation.To differentiate the myoblasts to myotubes, myoblasts were maintained in a SKGM Skeletal Muscle Growth Bullet Kit (CC-3161 & CC-4139; Lonza) containing 2 mM glutamine, 50 U/ml streptomycin, and penicillin at 37°C in 5% CO2 atmosphere. Myoblast cells were differentiated by switching the medium to Dulbecco’s modified essential medium supplemented with 2% horse serum, and the medium was replaced every 5–6d. Normal HSMMs were grown for 6d before harvesting for protein or RNA analysis. Differentiation states were tested with several differentiation markers such as MYH2, MYOG, MYOD, Mef2C, and TNNT genes by using real-time quantitative PCR (qPCR). Those genes significantly increased from day 2 (Fig 20B). Differentiated cell morphology was checked with phalloidin (Fig 20A). Differentiated myotubes were fixed with 3.7% formaldehyde solution for 10 min. Subsequently, samples were incubated in PBS with 0.1% Triton X-100, 2.5% Alexa Fluor 568–conjugated phalloidin (Thermo fisher Scientific), and 2.5% DAPI (Thermo Fisher Scientific) at room temperature in the dark for 20–30min. Phalloidin stains filamentous actin, DAPI labels cell nuclei. After washing samples 3 times with PBS, they were mounted on glass slides. Fluorescence was observed under a confocal microscope (Nikon, Tokyo, Japan).
40
Figure 20. A. Differentiated cell morphology was stained with phalloidin and observed by
confocal microscopy. Data are expressed as the mean ± SE from three independent
experiments. B. Human skeletal muscle myoblasts (HSMMs) were seeded into each well of a 6-well plate and incubated overnight. On the following day, myoblasts were differentiated by switching the medium to differentiation medium. Skeletal muscle myotubes differentiation marker genes such as MYOD, Mef2C, MYOG, TNNT, and MYH2 were analyzed by qRT-PCR at an indicated day, gene expressions were normalized to actin gene expression, relative to expression levels at day 0 (time at which differentiation media was added to the cells); *** p < 0.001 vs. day 0 using Student’s t test.
41
B. PA treatment induces insulin resistance in HSMMs
To demonstrate the underlying mechanisms of PA-induced insulin resistance, HSMMs were incubated with two different concentrations of PA and insulin signaling was then analyzed with p-AKT1 and p-GSK-3α/β antibodies. Administration of 0.2 mM and 0.4 mM PA decreased p-IR expression by 0.63- and 0.25-fold, respectively. The expression of p-AKT and p-GSK-3α/β exhibited a similar pattern. However, the total protein levels of IR, Akt, and GSK-3α/β were unaffected by PA administration (Fig. 21A). These results indicate an insulin-resistant state. In this study, myotubes were incubated with 0.4 mM PA for 24h to induce insulin resistance. We also investigated glucose uptake by using 2-NBDG in PA-treated myotubes. Insulin stimulation increased 2-NBDG uptake by 1.49-fold compared with the BSA-treated control. However, PA treatment decreased 2-NBDGuptakeby0.91-foldcomparedwithBSA-treated control conditions (Fig.21B), indicating that PA administration impaired glucose uptake. These results confirmed that PA impairs insulin sensitivity.
42
Figure 21. Palmitate induced reduction of insulin-stimulated AKT, phospho-GSK and glucose uptake in HSMMs. A. Skeletal muscle cells were harvested 20 min after
insulin (50nM) treatment of 0.4 mM PA for 24h. Representative immunoblots showing phospho - (Ser 473), total - AKT and phospho -, total - GSK in skeletal muscle cells. The data are given as means±standard error. *P<0.05, ** P<0.01. B. Skeletal muscle cells were harvested 20 min after insulin (50nM) treatment of 0.4 mM PA for 24h. The data are given as means±standard error. ** P<0.01.
43
C. PA increases intracellular iron levels
An increasing body of evidence suggests an association between iron homeostasis and insulin resistance. Disruption of iron homeostasis may contribute to the development of insulin resistance and diabetes (Jung IR et al., 2015, Simcox JA et al., 2013). To detect the intracellular labile iron levels under PA-induced insulin resistance conditions in HSMMs, we examined the cytosolic LIP by measuring the fluorescence of calcein AM-stained cells. When calcein AM enters cells, it rapidly converts to fluorochromic alcohol calcein, which chelates labile iron and simultaneously quenches its fluorescence (Tenopoulou M et al., 2007). Larger amounts of intracellular iron indicate lower calcein fluorescence intensity, and vice versa. As shown in Figure 22A, microscopy observations showed a significant decrease (0.70-fold) in fluorescence signals in PA-treated myotubes, similar to the effects of adding FeSO4 and FeCl3 well-known iron donors, to increase intracellular iron levels. In contrast, the iron chelator DFO, as a negative control, increased the fluorescence signals. In addition, cotreatment with DFO and PA increased fluorescence signals by 1.38-fold compared with PA treatment alone. The same results were obtained from fluorescence ELISA (Fig. 22B).
44
Figure 22. Intracellular iron levels increased by palmitate. A,B. HSMMs were treated
with different iron ions (0.1 mM FeCl3; 0.1 mM FeSO4), iron chelator (0.5 mM deferoxamine, DFO) or 0.4 mM palmitate (PA) for 24 h. Intracellular labile iron pool (LIP) fluorescence was assessed by staining with 0.5 μM calcein AM, a fluorescent iron-sensitive probe, for 15 min, and then observed by confocal microscopy (A) or fluorescence ELISA (B)