3-2 / M. S. Weaver
• IMID 2009 DIGEST
Abstract
We demonstrate a new commercial green phosphorescent organic light emitting device (OLED) in a bottom emission device and top emission microcavity. The bottom and top emitting phosphorescent OLEDs (PHOLEDTMs) had
luminance efficiencies of 60cd/A and 137cd/A respectively, at a luminance of 1,000cd/m2.The top emission microcavity
was close to 1953 NTSC color requirements with 1931 CIE color coordinates of 0.231, 0.718. A record green PHOLED lifetime of >3,500hrs to LT95 from 4000cd/m2 is
demonstrated for the microcavity device.
1. Introduction
In order to compete with liquid crystal displays (LCDs), manufacturers are using phosphorescent organic light-emitting device (PHOLED)1 technology
in active matrix (AM) OLED commercial displays due to the superior power efficiency. PHOLEDs harvest both singlet and triplet excitons resulting in devices that can be four times as efficient as fluorescent OLEDs2,3. The majority of AMOLED
products have been small displays mainly targeted for use in mobile applications where power efficiency is important due to battery power constraints.
PHOLEDs also provide advantages in large area wall plug display applications e.g. televisions. PHOLED technology reduces the display temperature rise by reduction of the overall power consumption4. A
key benefit of low operating temperature is the
extension in the OLED display lifetime as degradation is temperature dependent5,6.
In this paper, we demonstrate the properties of a green PHOLED system7 , 8 necessary to realize
commercial performance in mobile OLED displays and televisions. Color chromaticity, power efficiency and lifetime requirements are discussed. Typically OLEDs have broad electroluminescence (EL) emission spectra e.g. full width half maximum (FWHM) >50nm. However in order to achieve saturated colors, particularly for blue or green, this requires narrower emission spectra9. The impact on
display performance from the use of microcavities10
combined with green PHOLEDs is discussed and a new high color saturation, high efficiency, long-lifetime green PHOLED is presented.
2. Experimental
Bottom and top emitting PHOLEDs were fabricated under a high vacuum condition (~1.10-7 Torr) by
vacuum thermal evaporation (VTE) and had the same generic device structure: anode/ hole transport layer (HTL)/ emissive layer (EML) /electron transport layer (ETL)/cathode. The organic and metal layers were thermally deposited at 0.2–4 Å/s. The microcavity PHOLED contained a different HTL layer. In the case of the standard device the anode was indium tin oxide
Long-lifetime Green Phosphorescent OLEDs for Low Power Displays
Michael S. Weaver1, Vadim I. Adamovich1, Sean C. Xia1, James J. Fiordeliso1, Raymond C. Kwong1, Julie J. Brown1, Kwan-Hee Lee2, Choon
Woo Lim2 and Sung Chul Kim2 1Universal Display Corp., Ewing, NJ 08618, USA Phone: +609 671 0980, E-mail: [email protected]
2Samsung Mobile Display, San#24, Nonseo-Dong, Giheung-Gu, Yongin-Si, Gyeonggi-Do, 446-711, South Korea
3-2 / M. S. Weaver
IMID 2009 DIGEST •
(ITO) and the structure was completed with a 1 nm layer of LiF and a 100 nm layer of Al as the cathode contact. For the top emitting cavity devices the anode was a reflective metal and the cathode was a transparent conductor. Both PHOLED architectures were encapsulated in a dry nitrogen atmosphere (<1 ppm H2O and O2) using a glass lid and a UV cured
epoxy edge seal. A CaO getter was inserted inside the encapsulated package to absorb byproducts of the cured epoxy and any residual water or oxygen present within the encapsulated volume.
3. Results and discussion
In 1953 the National Television Standards Committee (NTSC) system which defined the color video standard for analog definition television was established. Here the 1931 Commission Internationale d’Eclairage (CIE) co-ordinates for green were defined as 0.210, 0.710. However the NTSC defined color gamut, due to the performance of cathode ray tube (CRT) phosphors, was never used very much for broadcast video. In fact most of the world has until recently used target 1931 CIE coordinates for green, for broadcast video, of 0.290≤x≤0.310 and 0.595≤y ≤0.60011. More recently the Digital Cinema Initiative
(DCI) published a standard for a green 1931 CIE of 0.265, 0.690. Therefore it is not clear at this time what the exact CIE target should be for green OLEDs. While the typical broadcast video standards for green can be achieved with typical Lambertian emitting OLEDs it will be more challenging to realize more saturated targets such as the DCI or original 1953 NTSC color coordinates.
For blue and green OLEDs, realizing saturated color co-ordinates is difficult due to the coincidence of these colors with the photopic response curve. The low energy vibronic components of blue and green emission spectra have an increased contribution to the perceived color coordinate due sensitivity of the eye in the green region of the spectrum. To achieve more saturated emission to approach NTSC RGB color coordinates, narrowed EL emission spectra need to be achieved. Two approaches are often used: (1) color filters and (2) microcavities. The color filter (1) approach has the disadvantage of reducing the power efficiency of the display as emitted light is lost through absorptive losses. This approach however can also be used in combination with (2) to fine tune the emission for a more efficient design. The use of microcavities (2) has been widely reported within the OLED community12,13. In this work applying a top
emission microcavity structure to a new unsaturated green PHOLED results in a dramatic shift in the 1931 Commission Internationale d’Eclairage (CIE) co-ordinates from (0.341, 0.615) to (0.231, 0.718).
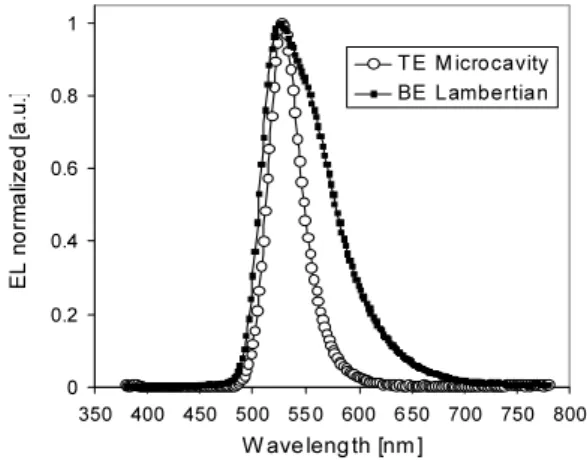
Fig. 1. Normalized EL spectra of a green standard (solid squares) and a microcavity PHOLED (open circles).
Fig. 1 shows the electroluminescence spectra measured at 10mA/cm2 of the commercial green
PHOLED emitter in a bottom (Lambertian) emission (pattern) device (standard) and in a top emitting microcavity structure. The standard PHOLED has an electroluminescence spectrum peak wavelength of 526nm and a FWHM of 72nm. The microcavity PHOLED has an electroluminescence spectrum peak wavelength of 528nm and a FWHM of 34nm.
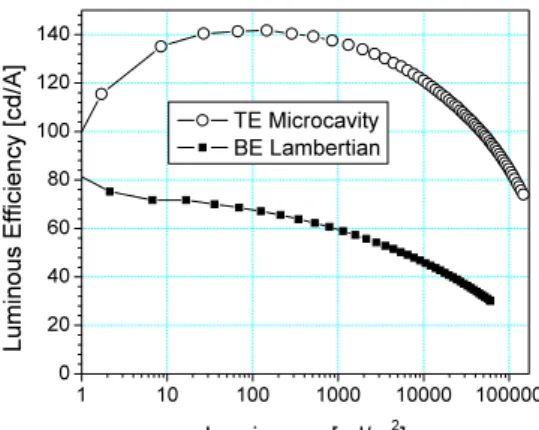
Fig. 2 shows the luminous efficiency (LE) performance of the two devices. The standard structure has an efficiency of 60cd/A at 1,000cd/m2
with a peak efficiency of 72 cd/A at 16 cd/m2. For the
microcavity devices efficiency was boosted normal to the substrate where the efficiency of the microcavity structure was 137cd/A at 1,000cd/m2 with a peak
efficiency of 142 cd/A at 150 cd/m2. 0 0.2 0.4 0.6 0.8 1 350 400 450 500 550 600 650 700 750 800 Wavelength [nm] EL no rm ali ze d [ a.u .] TE MicrocavityBE Lambertian
3-2 / M. S. Weaver
• IMID 2009 DIGEST
Fig. 2. Luminous efficiency vs. luminance plot of a green standard (solid squares) and a microcavity PHOLED (open circles).
Fig. 3. Luminance vs. voltage plots of a green standard (solid squares) and a microcavity PHOLED (open circles).
Fig. 3 shows the voltage luminance characteristics of the two PHOLEDs. The driving voltage of the standard and microcavity devices at 1,000cd/m2 was
4.7V and 5.6V respectively. A summary of the green PHOLED device characteristics is given in Table 1.
Fig. 4 shows the lifetime of the microcavity top emission device driven at a constant DC current. The new green is exceptionally stable. At an initial luminance of 4,000cd/m2 the device is predicted to
live for ~3,500hrs with only a 5% reduction in luminance. This data is taken without any burn in.
Further improvements in the device lifetime are anticipated as the device structure is further optimized. TABLE 1. Comparison of a standard and a microcavity green PHOLED.
1931 CIE At 1,000 nits Structure x y λ max [nm]fwhm [nm] Voltage [V] [cd/A]LE Microcavity 0.231 0.718 528 34 4.7 137 Standard 0.341 0.615 526 72 5.6 60
Fig. 4. Lifetime at constant current of the microcavity PHOLED from an initial luminance of 4,000cd/m2.
4. Summary
The development of long-lifetime high efficiency green PHOLED will allow manufacturers, in combination with red PHOLEDs, to reduce the power consumption in AMOLED displays by ~40% as compared to a display designed with conventional fluorescent OLEDs. Here we demonstrate commercial performance for a new green PHOLED emitter that exhibits record longevity and longevity efficiency product.
Acknowledgements
The authors would like to thank the entire UDC team for their support in this work.
2 3 4 5 6 7 8 9 0.1 1 10 100 1000 10000 Lu mi na nc e [ cd /m 2] Voltage [V] TE Microcavity BE Lambertian 1 10 100 1000 10000 100000 0 20 40 60 80 100 120 140 Lu mi no us E ffic ien cy [c d/A ] Luminance [cd/m2] TE Microcavity BE Lambertian 0.95 0.96 0.97 0.98 0.99 1.00 0 1,000 2,000 3,000 4,000 Time [Hours] -N or ma liz ed Lu m ina nc e - RT at 4,000 nits
3-2 / M. S. Weaver
IMID 2009 DIGEST •
5. References
1 M. A. Baldo, D. F. O’Brien, Y. You, A. Shoustikov, S. Sibley, M. E. Thompson, S. R. Forrest, Nature,395,
p.151 (1998).
2 C. Adachi, M. A. Baldo, M. E. Thompson, S. R. Forrest, J. Appl. Phys., 90, p.5048 (2001).
3 C. Adachi, M.E. Thompson, S.R. Forrest, IEEE J. on Selected Topics in Quantum Electronics, 8[2],
p.372 (2002).
4 M. Lu, M. Hack, R. Hewitt, M. S. Weaver, J. J. Brown, IEEE J. of Display Tech., 4[1], p.47 (2008).
5 H. Aziz, Z. Popovic, D.; N-X. Hu, Appl Phys Lett.,
81[2], p.370 (2002).
6 M. Ishii, Y. Taga, Appl. Phys. Lett., 80[18], p.3430
(2002).
7 M.S. Weaver, V.I. Adamovich, R.C. Kwong, J.J.Brown IMID/IDMC/ASIA Display ‘08 Digest,
50[2] p.1513 (2008).
8 M.S.Weaver, V.Adamovich, J.J.Brown K-H Lee, C.W.Lim, S.C.Kim SID 09 Digest, 23[3], p.314
(2009).
9 S. Tokito, T. Tsutsui, Y. Taga, J. of Appl Phys.,
86[5], p.2407 (1999).
10 A. Dodabalapur, L. J. Rothberg, T. M. Miller, E. W. Kwock, Appl. Phys. Lett.,64, p.2486 (1994).
11 M. S. Brennesholtz, Information Display,22, p. 24
(2006).
12 S. Tokito, Y. Taga, T. Tsutsui. Syn. Met.,91, p. 49
(1997).
13 V. Bulovic, V.B. Khalfin, G. Gu, P.E. Burrows, D.Z. Garbuzov, S. R. Forrest, Phys Rev B: Condensed Matter and Materials Physics, 58[7] , p.3730 (1998).