P1-65 / C. G. Son
• IMID 2009 DIGEST
Abstract
We have studied that the secondary electron emission characteristics of functional layers which have different kinds of MgO sub-micrometer size powder in AC-PDP. We used cathodoluminescence(CL) and gamma focused ion beam (γ-FIB) system for measurement of secondary electron emission characteristics. Also we made 6 inch test panel which applied functional layers for evaluation of discharge characteristics.
1. Introduction
Nowadays, PDP trend is high efficiency and high resolution, but the high efficiency is especially believed the most important factor in AC-PDP. Hence, it is no doubt for a lot of research groups to try hard to resolve the high efficiency problem. There are many solutions that have been shown up to resolve this problem, but among those solutions, additional functional layer on MgO protective layer is most paid attention to a key issue of AC-PDP. In this study, we measured CL spectrum and secondary electron emission coefficient of functional layer which have different kinds of MgO sub-micrometer size powder, compared each functional layers for high efficiency AC-PDP.
2. Experimental
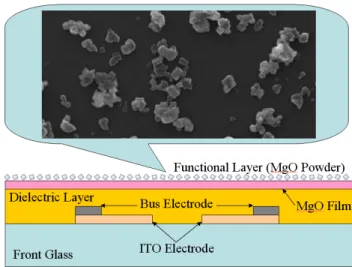
Figure 1 shows the structure of AC-PDP front panel which applied functional layer. The functional layer coating method is various such as spray coating,
screen printing, etc. In this experiment, we used 6 inch test panel which has functional layer by spray coating method.
Fig. 1. Structure of AC- PDP front panel which applied functional layer
3. Results and discussion
Figure 2 shows the CL spectrum of each MgO powder, sample A to D. It is shown that the CL spectrums are different in accordance with each MgO powders which have different element. In this experiment, we formed each kind of MgO powder on the MgO protective layer used by the spray coating method. Figure 3 shows the SEM (Scanning Electron Microscopy) image of each MgO powder on the MgO protective layer. It is shown that the shape and particle size is different in accordance with MgO powders.
Secondary Electron Emission Characteristics of
Functional Layer in AC-PDP
Chang Gil Son
1, Young Gyu Han
1, Yong Hee Kim
1, Byeong Seong Cho
1,
Young Jun Hong
1, Ki Baek Song
1, Young Joo Bae
2, In Tae Kim
2and Eun Ha Choi
11Charged Particle Beam and Plasma Laboratory / PDP Research Center, Dept. of Electrophysics,2Dept. of Chemistry, Kwangwoon Univ., 447-1 Wolgye Dong, Nowon Gu,
Seoul, Korea
Tel.:82-2-940-5662, E-mail: [email protected]
P1-65 / C. G. Son
IMID 2009 DIGEST •
Hence, each MgO powder CL spectrum is different. It is also shown that the MgO particles are scattered on the MgO protective layer.
Fig. 2. CL spectrum of each MgO powders.
Fig. 3. SEM image of each MgO powders on the MgO protective layer.
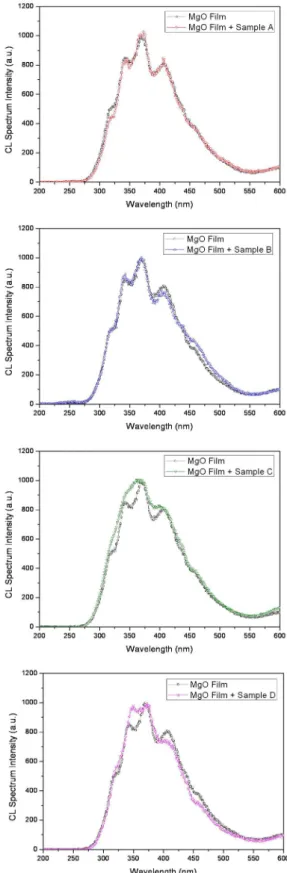
Figure 4 shows the CL spectrum results which formed functional layer by each MgO powder on the MgO film. The CL spectrum tendency is similar to only MgO film spectrum. These results showed that the each MgO particles are scattered on the MgO protective layer as shown figure 3. However, in accordance with MgO powder A to D, the CL spectrum intensity and peak wavelength are some changed. Specially, Sample D case, 345 nm peak was shifted 350 nm and intensity more increased than other cases. The change of CL intensity and peak wavelength has influence on the secondary electron emission characteristics of MgO protective layer. For confirmed the secondary electron emission characteristics, we measured secondary electron emission coefficient of each case sample used by
γ-FIB system.
Fig. 4. CL spectrum results which formed functional layer by each MgO powder on the MgO film.
P1-65 / C. G. Son
• IMID 2009 DIGEST
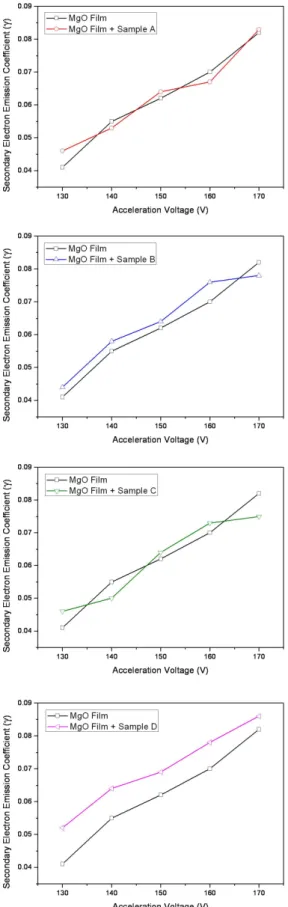
Fig. 5. Secondary electron emission coefficient results which formed functional layer by each MgO powder on the MgO film.
Figure 5 shows the secondary electron emission coefficient results which formed functional layer by each MgO powder on the MgO film. It is shown that the secondary electron emission coefficient is similar to tendency sample A, B and C cases. However sample D case, the secondary electron emission coefficient increased than other cases. This result was related to CL spectrum result as shown figure 4. The secondary electron emission coefficient value was changed by a little change of CL spectrum. The minute difference of CL spectrum has effect on discharge characteristics.
Fig. 6. Firing voltage of each test panels which applied sample D1 and sample D2 functional layer in accordance with driving frequency.
Figure 6 shows the firing voltage of each test panels which applied sample D1 and sample D2 functional layer in accordance with driving frequency. The test panel for this experiment is a 6 inch, VGA class AC-PDP with a cell pitch of 1080 ㎛. The thickness of MgO protective layer was 7,000Å and the deposition temperature was 300℃ and deposition ratio was 20 Å/s in this experiment. And discharge gas, we used Ne + Xe (15%) mixture gas and pressure was 400 Torr. As you see the figure 6, the sample D2 functional layer test panel has lowest firing voltage from 227 to 230 V and non functional layer test panel has highest firing voltage from 245 to 251 V. These results caused by different of secondary electron emission coefficient. As you see the figure 5, the secondary electron emission coefficient of sample D functional layer test panel is higher than non functional layer test panel. Therefore, firing voltage of case D functional layer is lower than non functional layer test panel.
P1-65 / C. G. Son
IMID 2009 DIGEST •
4. Summary
In this study, we have shown the different characteristics in according to each kinds of MgO powder which has different element used for the functional layer. It is shown that the change of CL spectrum which applied each kinds of MgO powder on the MgO protective layer has impact on the secondary electron emission coefficient. Specially, sample D case has the highest secondary electron emission coefficient value caused by increase of CL intensity around 350nm. Hence, the test panel firing voltage which applied sample D functional layer is lower than non functional layer test panel. So, we expect that the AC-PDP luminous efficiency is increased by fitting functional layer.
Acknowledgement
This work was supported by the IT R&D program of MKE/IITA. [2009-S-009-01, Development of Eco-friendly 50” Quadro Full HD PDP Technology]
5. References
1. J. P. Boeuf : J. Phys. D, Appl. Phys. 36, 66-70 (2003).
2. E. H. Choi, H. J. Oh, Y. G. Kim, J. J. Ko, J. Y. Lim, J. G. Kim, D. I. Kim, G. S. Cho, and S. O. Kang: Jpn. J. Appl. Phys. Part 1 37, 7015 (1998).
3. E. H. Choi, J. Y. Lim, Y. G. Kim, J. J. Ko, D. I. Kim, C. W. Lee, and G. S. Cho: J. Appl. Phys. 86, 6525 (1999).
4. J. Y. Lim, J. S. Oh, B. D. Ko, J. W. Cho, S. O. Kang, G. S. Cho, H. S. Uhm and E. H. Choi: J. Appl. Phys. 94, 764 (2003).
5. M. Amatsuchi, A. Hirota, H. Lin, T. Naoi, E. Otani, H. Taniguchi, K. Amemiya: IDW (2005) 435. 6. Han S. Uhm, Eun H. Choi and Guang S. Cho: Appl.
Phys. Lett. 94, 031501 (2009)
7. C. G. Son, S. H. Kim, S. H. Jung, Y. G. Han, H. S. Uhm and E. H. Choi : J. Korean Vacuum Society Vol. 18, No.2, 92-96 (2009)